1 3
Eur J NutrDOI 10.1007/s00394-015-1075-y
ORIGINAL CONTRIBUTION
Deteriorated glucose metabolism with a high-protein,
low-carbohydrate diet in
db
mice, an animal model of type 2
diabetes, might be caused by insufficient insulin secretion
Emi Arimura1,2 · Wijang Pralampita Pulong2 · Ancah Caesarina Novi Marchianti2,4 · Miwa Nakakuma2,3 · Masaharu Abe2 · Miharu Ushikai2 · Masahisa Horiuchi2
Received: 8 April 2015 / Accepted: 8 October 2015 © Springer-Verlag Berlin Heidelberg 2015
Results The db–H diet mice showed significantly higher
water intake, urinary volume, and glucose levels than db–L
diet mice but similar levels of excreted urinary C-peptide. In contrast, control-H diet mice showed significantly higher C-peptide excretion than control-L diet mice. Both types of mice fed H diet excreted high levels of urinary albumin.
When maltose mixtures were administered, db–L
mix-ture mice showed significantly higher blood glucose after
30 min than db–H mixture mice. However, db mice
admin-istered starch–H mixture showed significantly higher blood
glucose 120–300 min post-administration than db–L
mix-ture mice, although both groups exhibited similar insulin levels.
Conclusions High-protein, low-carbohydrate diets dete-riorated diabetic conditions and were associated with
insuf-ficient insulin secretion in db mice. Our findings may have
implications for dietary management of diabetic symptoms in human patients.
Keywords High-protein diet · Insulin secretion · db
mice · Oral administration · Urinary C-peptide
Introduction
Recently increasing numbers of diagnosed diabetes mel-litus (DM) and diabetic nephropathy cases worldwide are more likely related to lifestyle than to genetic factors, as global genetic diversity has not changed appreciably over
this short period of time [1–3]. Lifestyle factors, including
nutrition, have markedly shifted in the past several decades, although the impact of altered nutrition on development of DM and diabetic nephropathy is not fully understood and
remains controversial [4–6]. Initial diets of many Japanese
individuals, such as second-generation Japanese-American Abstract
Purpose We previously showed the deleterious effects of increased dietary protein on renal manifestations and
glucose metabolism in leptin receptor-deficient (db) mice.
Here, we further examined its effects on glucose metabo-lism, including urinary C-peptide. We also orally adminis-tered mixtures corresponding to low- or high-protein diets to diabetic mice.
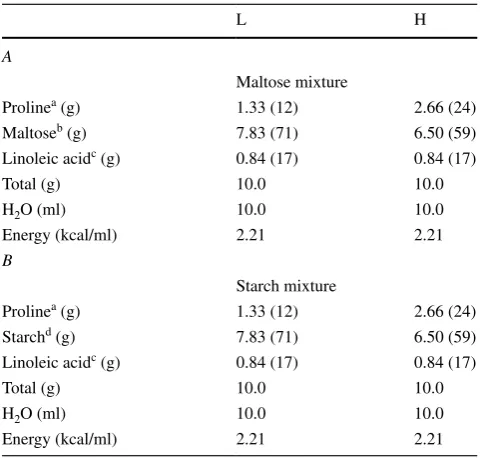
Methods In diet experiments, under pair-feeding (equiva-lent energy and fat) conditions using a metabolic cage, mice were fed diets with different protein content (L diet: 12 % protein, 71 % carbohydrate, 17 % fat; H diet: 24 % protein, 59 % carbohydrate, 17 % fat) for 15 days. In oral admin-istration experiments, the respective mixtures (L mixture: 12 % proline, 71 % maltose or starch, 17 % linoleic acid; H mixture: 24 % proline, 59 % maltose or starch, 17 % lin-oleic acid) were supplied to mice. Biochemical parameters related to glucose metabolism were measured.
Electronic supplementary material The online version of this article (doi:10.1007/s00394-015-1075-y) contains supplementary material, which is available to authorized users.
* Masahisa Horiuchi
1
Major in Food and Nutrition, Department of Life
and Environmental Science, Kagoshima Prefectural College, 1-52-1 Shimo-Ishiki, Kagoshima 890-0005, Japan
2
Department of Hygiene and Health Promotion Medicine, Graduate School of Medical and Dental Sciences, Kagoshima University, 8-35-1 Sakuragaoka, Kagoshima 890-8544, Japan
3 Takata Hospital, 5-1 Horie-cho, Kagoshima 892-0824, Japan 4
Eur J Nutr
1 3
men, have since conformed to modern Western diets, resulting in increased consumption of lipids and animal protein but decreased intake of carbohydrates and dietary fibre. This nutritional change might be implicated in the
onset and development of DM [7]. While dietary fat is a
recognized factor in deteriorating insulin sensitivity, dietary protein may stimulate insulin secretion, leading to
exhaus-tion of β-cell function in the pancreas, although this
rela-tionship is also controversial [6, 8].
To limit DM in Japanese individuals with decreased
insulin secretion capacity [9], we should consider how
their diet affects development of DM and diabetic nephrop-athy. Therefore, we previously examined the effect of clinically relevant dietary protein content diets (12–24 %
energy) on glucose levels and renal manifestations in db
mice, an animal model for DM exhibiting leptin receptor deficiency and a relatively low capacity for insulin
secre-tion [10, 11]. We found that a high-protein,
low-carbohy-drate diet increased blood glucose levels and deteriorated renal manifestations, in contrast to a low-protein,
high-carbohydrate diet [12]. Similarly, a human study revealed
that a high-protein diet led to highly advanced glycation,
often resulting in HbA1c production [13]. In some diabetic
cases, deterioration of blood glucose levels appears linked
to low-carbohydrate, high-protein diets [14], although the
pathophysiological mechanism involved is still unclear. Therefore, in the present study, we evaluated the effects of dietary protein content on glucose metabolism
in young db mice without severe diabetic complications
under pair-feeding and metabolic cage conditions. Addi-tionally, we examined levels of blood glucose and
insu-lin after the oral administration to db and control mice
of mixtures corresponding to low-protein or high-protein diets and containing different types of carbohydrates. Our findings provide evidence of deteriorating glucose metabolism in diabetic animals due to the consumption of a high-protein diet that may be linked to insufficient insulin secretion.
Materials and methods
Animals
Four-week-old male diabetic db mice [C57BLKS(BKS).
Cg-+ Leprdb/+ Leprdb/J] with a homozygous mutation
in the leptin receptor gene and non-diabetic control (CT)
mice (BKS.Cg-Dock7m +/ Dock7m +/J) were purchased
(Charles River Japan, Kanagawa, Japan) [15]. The mice
were housed individually with a humidity- and
temper-ature-controlled (50 ± 10 %, 22 ± 2 °C) facility under a
12-h light/dark cycle (0700–1900 h). The mice had ad libi-tum access to water.
Food and water intake of mice in metabolic cages
For pair-feeding metabolic cage experiments, 8 CT and
16 db mice were randomly separated and housed
indi-vidually in cages (3600M021, Tecniplast Japan, Co., Ltd., Tokyo, Japan) for 3 days and received one of the two protein diets: 12 % (low protein; L) or 24 % (high protein; H) protein composed of 50 % animal and 50 % plant protein (Supplementary Table 1). For the pair-fed experiments, we first measured the amount consumed by the control mice that were fed the L diet ad libitum. Control mice that were fed the H diet ad libitum con-sumed a similar amount of food. The total amount of food consumed was 48.5 g (mean) in 15 days; therefore,
we supplied 3.23 g per day to the db mice. After 3 days
of acclimation, db–H and db–L mice were supplied diets
for 15 days equivalent to amounts consumed by CT-L
mice housed individually in metabolic cages [16] with
ad libitum access to food. The body weight (BW) of each mouse was measured between 0700 and 0900 h on the 7th and 14th days. Water intake was measured once per week. Urine was collected and measured from 0700 to
0700 h at days 6–7 and 13–14 and stored at −80 °C for
later analysis. On the final day (day 15), mice were anes-thetized by pentobarbital (100 mg/kg) after 6-h fasting (0700–1300 h), and blood was collected from the hearts. The blood was mixed with EDTA (final concentration of 4 mM) and centrifuged, and the supernatant was stored at
−80 °C for later analysis. Organs, including the kidneys,
heart, liver, and fat surrounding the epididymis were weighed.
Measurement of blood glucose and insulin levels after oral administration of dietary mixtures with different protein content
Sixteen CT and 16 db mice at 4 weeks of age were housed
individually for 1 week and received a standard diet (CE2: 29 % protein; CLEA Japan, Shizuoka, Japan). Subse-quently, the mice were randomly separated and fasted overnight (1400–0800 h). The next day, mice were orally administered one of the dietary mixtures corresponding to an L diet or H diet with maltose as the carbohydrate
source (Table 1) at 5.0 ml/kg body weight. Blood glucose
was measured from the tail veins of mice with a glucose metre (FreeStyle Freedom; Nipro Corp., Osaka, Japan) before and at 15, 30, 60, 120, 240, and 300 min after the oral administration of the respective dietary mixture. After 1-week acclimation, the mice were randomly separated and fasted overnight (1400–0800 h). The next day, mice were orally administered one of the dietary mixtures with
solu-ble starch as the carbohydrate source (Tasolu-ble 1), as well as
Eur J Nutr
1 3
in other 10 CT and 9 db mice after 1-week acclimation
using plasma prepared from EDTA-treated blood collected from the mice’s tail veins before and at 15, 60, 150, and 240 min after oral administration of the dietary mixture.
Biochemical measurements
Blood glucose and urinary glucose were measured by a commercial kit (glucose CII-test Wako; WAKO, Tokyo, Japan) according to the manufacturer’s instructions. Lep-tin, insulin, urinary C-peptide, and urinary albumin were measured by their respective ELISA kits (R&D Systems, Minneapolis, MN; Morinaga Institute of Biological Sci-ence Inc., Kanagawa, Japan; Yanaihara Institute Inc., Shi-zuoka, Japan; Exocell Inc., Philadelphia, PA). Creatinine clearance (Ccr) was calculated by the following equation:
Ccr (ml/h) = [Urine volume (ml/day) × urinary creatinine
(mg/ml)]/[24 (h) × blood creatinine (mg/ml)]. Creatinine
was measured by a kit based on a reaction of creatininase (CRE-EN; Kainos Lab. Inc., Tokyo, Japan).
Statistical analysis
Values are shown as mean ± standard error (SE).
Statisti-cal analysis was performed using the one-way or two-way
(repeated measurement) analysis of variance (ANOVA) as appropriate. Significant differences were determined using Fish-er’s PSD test for multiple comparisons or an unpaired Student’s
t test. P < 0.05 indicated statistical significance (Ekuseru-Tokei
2010; Social Survey Research Information, Tokyo, Japan).
Results
Body weight and renal manifestations of mice under pair-feeding and metabolic cage conditions
The CT-H mice consumed similar amounts of food to CT-L mice, although the CT-L mice had ad libitum access to food.
While the db mice showed significantly higher BW than the
CT mice fed their respective diets (Fig. 1a), for both types of
mice there was no significant effect of diet type on BW. As
shown in Fig. 1b–d, db mice also showed significantly higher
amounts of water intake, urinary volume, and glucose than CT mice fed their respective diets. Although both CT groups
showed similar measurements, db–H mice showed
signifi-cantly higher levels of all three parameters than db–L mice.
Furthermore, Fig. 1e shows that db mice had significantly
higher urinary albumin levels than CT mice according to each diet and that all H diet mice, regardless of the genotype, showed significantly higher urinary albumin levels than the L diet mice. Creatinine clearance, another indicator of
kid-ney function, was significantly lower in db mice than in CT
mice under both diet conditions (Table 2), but we observed no
significant difference in the Ccr of the db and CT mice with
respect to each diet group. In addition, the db–L mice excreted
significantly higher levels of urinary C-peptide than the CT-L mice, and although the CT-H mice exhibited increased excre-tion of urinary C-peptide compared to the CT-L mice, we saw no significant difference in urinary C-peptide excretion
between the db–L and db–H mice (Fig. 1f).
Kidney weight was significantly lower in db mice than in
CT mice and significantly higher in db–H mice than in db–L
mice (Table 2). Although CT-H mice had higher-weight
kidneys than CT-L mice, the difference did not reach
sig-nificance (P= 0.28). We also weighed other organs and
tis-sues, including the liver, white adipose tissue (WAT), and the
heart. These measurements revealed that db mice had
higher-weight livers and fat surrounding the epididymis but signifi-cantly lower-weight hearts than CT mice according to each diet. However, there was no significant effect of diet type on the weight of the liver, WAT, or heart for the two groups.
Hormone levels and biochemical parameters of blood and urine samples
We examined fasting blood glucose (FBG), leptin, and
insulin levels in db and CT mice under metabolic cage
Table 1 Composition of the three major nutrients in the mixtures
used in the oral administration test
The number within parentheses indicates per cent of energy provided The mixture is comprised of 50 % water
a Proline (Wako Pure Chemical Industries) b Maltose (Wako Pure Chemical Industries) c
Linoleic acid (Wako Pure Chemical Industries)
d
Starch (Wako Pure Chemical Industries)
Eur J Nutr
1 3
condition. For FBG, db–L mice showed significantly
higher values than db–H mice, but we saw no
signifi-cant difference in FBG between CT mice fed with the
respective diets. Similarly, db mice showed significantly
higher insulin levels than CT mice with respect to each
diet, while insulin levels within the db and CT groups
did not significantly differ between diets. The db–L
mice exhibited significantly higher leptin levels than
Water intake
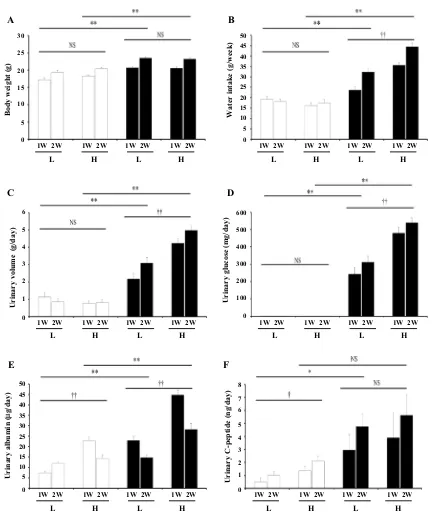
Fig. 1 Under pair-feeding and metabolic cage conditions, body
weight (a), water intake (b), urinary volume (c), urinary glucose (d), urinary albumin (e), and urinary C-peptide (f) of CT (open column) and db (closed column) mice fed with different diets during 2 weeks are shown. Data are presented as means + SE from 4 CT and 8 db
mice under the respective conditions and were analysed by two-way ANOVA (repeated measurements). *P < 0.05, **P < 0.01 compared with CT mice fed with the respective diet. †P < 0.05, ††P < 0.01
Eur J Nutr
1 3
CT-L mice, but leptin levels did not differ significantlywithin the db or CT groups fed each diet. Hormone and
FBG measurements are summarized in Table 2.
Effect of maltose and soluble starch on glucose and insulin levels in CT and db mice
To determine the cause of higher urinary glucose levels
found in db–H mice compared to db–L mice, we examined
changes in blood glucose after administration of the various
diet mixtures (Table 1). The db mice administered the L–
maltose mixture showed significantly higher blood glucose
values than db mice administered the H–maltose mixture
after 30 min post-administration (354 ± 49 vs. 206 ± 32,
P < 0.05) (Fig. 2A1). We observed no significant
differ-ences in blood glucose between CT mice and db mice after
administration of the H and L mixtures containing maltose
at 120–300 min (Fig. 2A1, A2). In contrast, although db–H
mice administered a soluble starch mixture showed
simi-lar blood glucose levels to db–L–starch mixture mice after
30 min post-administration (Fig. 2B1), the db–H–starch
mixture mice showed significantly higher blood glucose
levels than db–L–starch mixture mice during 120–300 min
post-administration (Fig. 2B1, B2). The db mice
adminis-tered the mixtures containing starch showed higher blood glucose from 120 to 300 min than the control mice admin-istered the H or L mixtures. Although we did not measure urinary glucose in this experiment, the higher blood glu-cose might be reflected in the urinary gluglu-cose excretion.
As shown in Fig. 2C, db mice administered both soluble
starch mixtures had higher blood insulin levels at 0–240 min
post-administration than CT mice administered the corre-sponding mixtures. Notably, we saw no significant differ-ence in blood insulin levels between mice administered the
H–starch or L–starch mixtures within the db or CT groups.
Discussion
Our study revealed that high-protein diets increased urinary output and glucose levels under metabolic cage conditions. Urinary glucose excretion increased if the protein/carbo-hydrate ratio in the diet increased, while insulin excretion, measured as urinary C-peptide, was unaffected. This
find-ing was only observed in the db mice. The control mice
might produce additional insulin to compensate for the H
diet. On the other hand, db mice cannot produce adequate
insulin, as shown by the high glucose concentration in the blood. That difference might be due to the capacity of the islets to secrete insulin, implying that the toxicity of the H diet in terms of glucose metabolism might be related to residual insulin capacity.
The deterioration of glucose metabolism resulting from the H diet was further evidenced by increased blood
glu-cose and constant insulin levels in db mice following the
administration of a high-proline mixture with low amounts of starch-based carbohydrates. Thus, a high-protein, low-carbohydrate diet composed of polysaccharides, such as starch, worsens metabolic symptoms in diabetic mice.
To examine the relationship between diet and insu-lin secretion, we collected urine from young mice under pair-feeding and metabolic cage conditions without
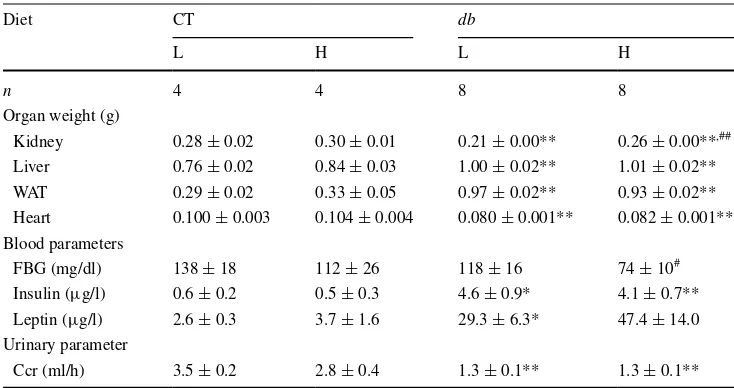
Table 2 Effects of diets on
organ weights, blood, and urinary parameters in CT and db mice
Values are mean ± SE. Values were analysed by Student’s t test
FBG fasting blood glucose, Ccr creatinine clearance, WAT white adipose tissue * P < 0.05; ** P < 0.01 compared with CT mice fed the respective diet
#
P < 0.05; ## P < 0.01 compared with the respective genotype mice fed L diet
Diet CT db
L H L H
n 4 4 8 8
Organ weight (g)
Kidney 0.28 ± 0.02 0.30 ± 0.01 0.21 ± 0.00** 0.26 ± 0.00**,##
Liver 0.76 ± 0.02 0.84 ± 0.03 1.00 ± 0.02** 1.01 ± 0.02** WAT 0.29 ± 0.02 0.33 ± 0.05 0.97 ± 0.02** 0.93 ± 0.02** Heart 0.100 ± 0.003 0.104 ± 0.004 0.080 ± 0.001** 0.082 ± 0.001** Blood parameters
FBG (mg/dl) 138 ± 18 112 ± 26 118 ± 16 74 ± 10#
Insulin (µg/l) 0.6 ± 0.2 0.5 ± 0.3 4.6 ± 0.9* 4.1 ± 0.7** Leptin (µg/l) 2.6 ± 0.3 3.7 ± 1.6 29.3 ± 6.3* 47.4 ± 14.0 Urinary parameter
Eur J Nutr
1 3
severe secondary complications, such as decreased BW. In our previous study, a high-protein diet led to dete-rioration of glucose metabolism, but lowered BW in
db mice under pair-fed conditions for 10 weeks [12].
Therefore, we now investigated how diets with varying protein and carbohydrate contents may affect the
dia-betic condition of db mice for a shorter duration without
also affecting BW. The db mice fed a high-protein,
low-carbohydrate diet showed significantly higher values of water intake, urinary volume, and urinary glucose than
db mice fed a low-protein, high-carbohydrate diet, but
did not exhibit a significant BW change. These mice experienced worsening diabetic symptoms associated with insufficient insulin secretion as evidenced by uri-nary C-peptide excretion levels, which have also been
observed in human diabetic patients [17]. This finding
suggests that db mice fail to compensate for
protein-induced gluconeogenesis due to reduced capacity for
insulin secretion [10].
We selected db mice because these mutants exhibit
rela-tively low insulin secretion but enhanced gluconeogenesis and are commonly used as a model for studying type 2
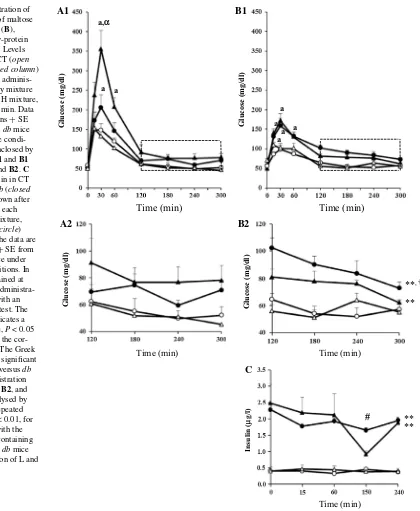
Fig. 2 Oral administration of
mixtures composed of maltose (A) or soluble starch (B), corresponding to low-protein or high-protein diets. Levels of blood glucose in CT (open column) and db (closed column) mice are shown after adminis-tration of each dietary mixture (L mixture, triangle; H mixture, circle) during 0–300 min. Data are presented as means + SE from 7 to 8 CT and 8 db mice under their respective condi-tions. The squares enclosed by the dotted lines in A1 and B1 are enlarged as A2 and B2. C Levels of blood insulin in CT (open column) and db (closed column) mice are shown after the administration of each dietary mixture (L mixture, triangle; H mixture, circle) during 0–240 min. The data are presented as means + SE from 5 CT and 4–5 db mice under their respective conditions. In A1 and B1, data obtained at the same time after administra-tion were analysed with an unpaired Student’s t test. The Roman letter “a” indicates a significant difference, P < 0.05 versus CT mice with the cor-responding mixture. The Greek letter “α” indicates a significant
difference, P < 0.05 versus db mice with the administration of H mixture. In A2, B2, and C, the data were analysed by two-way ANOVA (repeated measurement). **P < 0.01, for CT versus db mice with the respective mixtures containing starch. †P < 0.05, for db mice with the administration of L and H mixtures
Glucose (mg/dl) Glucose (mg/dl)
Eur J Nutr
1 3
diabetes [10, 11]. Similarly, using a type 1 diabetes
ani-mal model with insufficient insulin secretion due to β-cell
damage, Linn et al. [18] reported that a high-protein diet
deteriorated the animals’ diabetic condition. In that study, animals fed a diet composed of 38 % protein, 19 % car-bohydrate, and 43 % fat experienced a significantly higher
incidence of diabetes and reduced β-cell mass than animals
fed a diet of 17 % protein, 43 % carbohydrate, and 39 % fat. Based on previous and current studies, insufficient insulin secretion may be related to the deterioration of glu-cose metabolism induced by a high-protein diet, although these effects could be ameliorated if insulin secretion can be restored. Earlier studies indicate that Asian populations tend to show a lower capacity for insulin secretion than
Caucasian populations [9, 10]. Thus, Asian patients may
be more sensitive to dietary protein than Caucasian people with respect to DM development, due to their lower insulin secretion capability.
Data related to glucose metabolism from mice kept in metabolic cages were not consistent with data obtained from mice at the end of the experimental period. In our
previous experiments, db–H mice ate more food than db–L
mice under ad libitum conditions [12]. The present
experi-ment was performed using pair-fed conditions; therefore,
the db–H mice may have fasted longer than the db–L mice.
The data on urinary glucose obtained from mice in meta-bolic cages may correspond precisely to the daily glucose
metabolism of db mice.
Although dietary protein impacted several renal manifes-tations, including kidney weight, Ccr, and urinary albumin,
db mice had significantly lower weight of kidneys than CT
mice fed with the same diet. The high-protein effects are
consistent with previous reports [12, 19, 20], but the
lower-weight kidneys of the db mice are inconsistent with
find-ings of some studies [12, 20]. This inconsistency could be
explained by the age at which the mice were killed, which was at 6 weeks of age in our study, likely before the onset of many diabetic complications. Additionally, increased urinary C-peptide excretion may be linked to lower
kid-ney weight under diabetic conditions [21]. Recently,
Nor-dquist et al. [21] reported that urinary C-peptide can
sup-press glomerular filtration rate in mice through constriction of glomerular afferent arteries, resulting in lower-weight kidneys, which our data support. Our results also indicate that a high-protein diet increased urinary albumin in both
CT and db mice, which is inconsistent with our previous
report regarding db mice under long-term conditions [12].
Although further experiments are needed to determine the direct effect of dietary protein on renal manifestations, this discrepancy may be explained by the presence or absence of BW change, as BW has been associated with urinary
albumin concentration [22]. However, our current study
utilized short-term experiments in which we observed no
significant BW change; therefore, the effects of a high-pro-tein diet may be more clearly reflected in urinary albumin excretion levels.
To specifically investigate how dietary protein affects glucose metabolism, we selected diets composed of various amounts of proline, maltose or soluble starch, and linoleic acid. Proline is a common amino acid found in many foods of the Western diet (e.g., white bread and cheese) and the
Japanese diet (rice and momen-tofu) (Table 3). As shown in
Table 3, proline may be consumed at higher levels in
West-ern countries, based on the high ratios of proline in WestWest-ern versus Japanese foods. Proline is also the second most plen-tiful amino acid in casein and soy bean proteins, which were
used as the protein sources in the diet experiment [23].
Moreover, proline is a highly soluble amino acid [24]
and favourable substrate for gluconeogenesis [25]. The
composition of amino acids in the diet greatly influences the biological value of protein, and physiological pro-cesses like gluconeogenesis might therefore be altered by diets containing a single type of amino acid. Therefore, the results of the present study should be considered care-fully. We selected linoleic acid because it has the highest
fatty acid content in soybean oil [26]. As shown in Fig. 2,
the difference was small between mice treated with the
db–L mixture and db–H mixture. However, the amount
administered (0.28 kcal/25 g of BW) was 1/50th,
com-pared to the diet consumed in a day (13.9 kcal) (Table 1
and supplementary Table 1). Therefore, this significant difference could explain the difference in the diet
experi-ments. We found that db–L mixture mice had higher
glu-cose levels at 30 min post-administration with a
maltose-based mixture than db–H mixture mice administered with
the same carbohydrates. In contrast, both db–L mixture
mice and db–H mixture mice administered a soluble
starch mixture showed similar glucose levels at 30 min post-administration. During the later phases of nutrient
uptake, the db–H mixture mice administered the starch
mixture showed significantly higher glucose levels than
the starch-administered db–L mixture mice, indicating
that higher glucose levels were not relieved by increased insulin levels, possibly due to higher insulin resistance
[27, 28]. Additionally, blood glucose levels were similar
from 120 to 300 min in the db mice treated with the two
maltose mixtures. The postprandial analyses of glucose and insulin after the intake of mixtures containing either maltose or starch revealed different results depending on the source and amount of carbohydrate. Although the diets used in the metabolic cage experiments were
com-posed of α and β cornstarch and sucrose, the difference
was in the amount of α cornstarch, which resembled the
Eur J Nutr
1 3
Table 3 Composition of amino acids of staple food and representative side dishes in Japan and Western countries
The values of the respective amino acids are shown as weight (mg) and percentage (%) per 100 g foods. The values were calculated from the data published by
The Ministry of Education, Culture, Sports, Science, and Technology in Japan [32]
Ratio 1 and Difference 1 mean the ratio and difference, respectively, of weight of amino acid of well-milled rice and white table bread Ratio 2 and Difference 2 mean the ratio and difference, respectively, of weight of amino acid of momen-tofu and beef
Ratio 3 and Difference 3 mean the ratio and difference, respectively, of weight of amino acid of momen-tofu and cheese Proline is stressed by italic
Amino acid Staple foods Side dishes
Well-milled rice
White table bread
Ratio 1 Difference 1 Momen-tofu Beef Cheese Ratio 2 Difference 2 Ratio 3 Difference 3
mg % mg % mg mg % mg % mg % mg
Alanine 130 5.6 260 3.0 2.00 130 300 4.1 1100 6.1 670 2.7 3.67 800 2.23 370
Arginine 190 8.2 290 3.4 1.53 100 560 7.7 1200 6.6 820 3.4 2.14 640 1.46 260
Aspartic acid 220 9.5 350 4.0 1.59 130 850 11.7 1700 9.4 1700 7.0 2.00 850 2.00 850
Cystine 53 2.3 190 2.2 3.58 137 95 1.3 210 1.2 120 0.5 2.21 115 1.26 25
Glutamic acid + glutamine 410 17.8 3000 34.7 7.32 2590 1400 19.3 2800 15.5 5000 20.5 2.00 1400 3.57 3600
Glycine 110 4.8 320 3.7 2.91 210 300 4.1 1100 6.1 440 1.8 3.67 800 1.47 140
Histidine 61 2.6 200 2.3 3.28 139 190 2.6 730 4.0 720 3.0 3.84 540 3.79 530
Isoleucine 91 3.9 310 3.6 3.41 219 320 4.4 810 4.5 1200 4.9 2.53 490 3.75 880
Leucine 190 8.2 600 6.9 3.16 410 560 7.7 1500 8.3 2300 9.4 2.68 940 4.11 1740
Lysine 83 3.6 170 2.0 2.05 87 450 6.2 1600 8.8 1900 7.8 3.56 1150 4.22 1450
Methionine 61 2.6 130 1.5 2.13 69 92 1.3 520 2.9 580 2.4 5.65 428 6.30 488
Phenylalanine 120 5.2 440 5.1 3.67 320 380 5.2 740 4.1 1200 4.9 1.95 360 3.16 820
Proline 110 4.8 1000 11.6 9.09 890 390 5.4 840 4.6 2600 10.7 2.15 450 6.67 2210
Serine 130 5.6 410 4.7 3.15 280 380 5.2 720 4.0 1100 4.5 1.89 340 2.89 720
Threonine 84 3.6 240 2.8 2.86 156 280 3.9 820 4.5 830 3.4 2.93 540 2.96 550
Tryptophan 35 1.5 94 1.1 2.69 59 98 1.4 210 1.2 290 1.2 2.14 112 2.96 192
Tyrosine 96 4.2 280 3.2 2.92 184 280 3.9 620 3.4 1300 5.3 2.21 340 4.64 1020
Valine 130 5.6 360 4.2 2.77 230 330 4.5 890 4.9 1600 6.6 2.70 560 4.85 1270
Eur J Nutr
1 3
the db mice, but not in the control mice, indicating that
by using the high-proline mixture containing starch, the higher blood glucose could not be compensated by higher insulin secretion, which was similar to the high-protein diet experiments with the metabolic cage. The higher
blood glucose in db mice administered the high-proline
mixture containing starch could be explained by the dif-ferent content of starch. However, the difdif-ferent amount of proline might affect the results; therefore, further stud-ies are required to determine how different amounts and sources of proteins and carbohydrates are involved in glu-cose and insulin metabolism.
This result is consistent with a previous report on type 1
diabetes in human patients [29] that found subjects required
more insulin after ingesting a high-protein diet, indicating insufficient insulin response and increased insulin resistance
[29]. Depending on an individual’s insulin secretion
capac-ity, a high-protein diet may also deteriorate glucose metabo-lism in patients with type 2 diabetes. Of note, the compo-sition of diets is not precisely known in terms of chemical substances; therefore, known chemical substances are nec-essary to confirm the effects of a high-protein diet. In our present study, the results obtained in the diet experiment were reproduced with the administration of known chemical substances, including maltose or soluble starch, proline, and
linoleic acid (Figs. 1, 2) [12]. To examine the effect of high
protein, this result obtained from the experiments with pure chemical substances has been thought to be significant.
Dietary protein also affects intestinal carbohydrate absorption. For example, a low-protein diet has a relatively large amount of polysaccharides, which normally suppress
the intestinal absorption of glucose [30, 31]. Our present
study suggests that when starch-based carbohydrates such as polysaccharides are present (i.e., as found in Asian foods), a low-protein diet may be recommended to Asian diabetic patients more readily than to the Caucasian patients, due to the consideration of insulin secretion capacity.
In conclusion, high-protein and low-carbohydrate diet deteriorated glucose metabolism in addition to showing renal manifestations, including urinary albumin in asso-ciation with insufficient insulin secretion. Although these findings were obtained via animal experiments, the vari-ous insulin secretion capacities of different populations of humans should be considered when patients with DM are treated by dietary manipulation.
Acknowledgments We thank Chiko Nishinosono for administra-tive assistance and the Joint Research Laboratory, Kagoshima Uni-versity Graduate School of Medical and Dental Sciences, for the use of its facilities. This work was supported by grants from the Minis-try of Education, Culture, Sports, Science, and Technology in Japan (#22500650 and #25350873 to E. A. and #21590704 to M. H.) and funded by the Kodama Memorial Fund for Medical Science Research.
Author contributions E.A., W.P., and M.H. obtained and analysed data and wrote the manuscript. A.M., M.N., M.A., and M.U. contrib-uted to discussions of experimental design and analysis and reviewed the manuscript.
Compliance with ethical standards
Conflict of interest The authors declare no potential conflicts of interest.
Ethical standard This study was approved by the Ethics Committee for Animal Experimentation at Kagoshima University.
References
1. Zimmet P, Alberti KGMM, Shaw J (2001) Global and societal implications of the diabetes epidemic. Nature 414:782–787 2. Remuzzi G, Benigni A, Remuzzi A (2006) Mechanisms of
pro-gression and repro-gression of renal lesions of chronic nephropathies and diabetes. J Clin Invest 116:288–296
3. Magkos F, Yannakoulia M, Chan JL, Mantzoros CS (2009) Man-agement of the metabolic syndrome and type 2 diabetes through lifestyle modification. Ann Rev Nutr 29:223–256
4. Layman DK, Clifton P, Gannon MC, Krauss RM, Nuttall FQ (2008) Protein in optimal health: heart disease and type 2 diabe-tes. Am J Clin Nutr 87:1571S–1575S
5. Pan Y, Guo LL, Jin HM (2008) Low-protein diet for diabetic nephropathy: a meta-analysis of randomized controlled trials. Am J Clin Nutr 88:660–666
6. Rietman A, Schwarz J, Tomé D, Kok FJ, Mensink M (2014) High dietary protein intake, reducing or eliciting insulin resist-ance? Eur J Clin Nutr 68:973–979
7. Tsunehara CH, Leonetti DL, Fujimoto WF (1990) Diet of sec-ond-generation Japanese–American men with and without non-insulin-dependent diabetes. Am J Clin Nutr 52:731–738 8. Metges CC, Barth CA (2000) Metabolic consequences of a high
dietary-protein intake in adulthood: assessment of the available evidence. J Nutr 130:886–889
9. Kuroe A, Fukushima M, Usami M et al (2003) Impaired β-cell function and insulin sensitivity in Japanese subjects with normal glucose tolerance. Diabetes Res Clin Pract 59:71–77
10. Shafrir E, Ziv E, Mosthaf L (1999) Nutritionally induced insulin resistance and receptor defect leading to β-cell failure in animal models. Ann N Y Acad Sci 892:223–246
11. Davis RC, Castellani LW, Hosseini M et al (2010) Early hepatic insulin resistance precedes the onset of diabetes in obese C57BLKS-db/db mice. Diabetes 59:1616–1625
12. Arimura E, Horiuchi M, Kawaguchi H, Miyoshi N, Aoyama K, Takeuchi T (2013) Low-protein diet improves blood and urinary glucose levels and renal manifestations of diabetes in C57BLKS-db/db mice. Eur J Nutr 52:813–824
13. Goldberg T, Weijing C, Peppa M et al (2004) Advanced glycoxi-dation end products in commonly consumed foods. J Am Diet Assoc 104:1287–1291
14. Gannon MC, Nuttall FQ, Saeed A, Jordan K, Hoover H (2003) An increase in dietary protein improves the blood glucose response in persons with type 2 diabetes. Am J Clin Nutr 78:734–741 15. Chen H, Charlat O, Tartaglia LA et al (1996) Evidence that
the diabetes gene encodes the leptin receptor: identification of a mutation in the leptin receptor gene in db/db mice. Cell 84:491495
Eur J Nutr
1 3
BALB/c and C57BL/6 J mice following acclimatization in meta-bolic cage. Lab Anim 44:218–225
17. Burke BJ, Hartog M, Heaton KW, Hooper S (1982) Assessment of the metabolic effects of dietary carbohydrate and fibre by measuring urinary excretion of C-peptide. Hum Nutr Clin Nutr 36:373–380
18. Linn T, Strate C, Schneider K (1999) Diet promotes β-cell loss by apoptosis in prediabetic nonobese diabetic mice. Endocrinol-ogy 140:3767–3773
19. Correa-Rotter R, Hostetter TH, Rosenberg ME (1992) Effect of dietary protein on renin and angiotensinogen gene expression after renal ablation. Am J Physiol 262:F631–F638
20. Teixeira SR, Tappenden KA, Erdman JW Jr (2003) Altering die-tary protein type and quantity reduces urinary albumin excretion without affecting plasma glucose concentrations in BKS.cg-m +Leprdb/+ Leprdb (db/db) mice. J Nutr 133:673–678
21. Nordquist L, Lai EY, Sjöquist M, Patzak A, Persson AEG (2008) Proinsulin C-peptide constricts glomerular afferent arterioles in diabetic mice. A potential renoprotective mechanism. Am J Physiol Regul Integr Comp Physiol 294:R836–R841
22. Savino A, Pelliccia P, Giannini C et al (2011) Implications for kidney disease in obese children and adolescents. Pediatr Neph-rol 26:749–758
23. Aguilera A, Reis de Souza TC, Mariscal-Landín G, Escobar K, Montaño S, Bernal MG (2015) Standardized ileal digestibility of proteins and amino acids in sesame expeller and soya bean meal in weaning piglets. J Anim Physiol Anim Nutr 99:728–736 24. Jensen KT, Löbmann K, Rades T, Grohganz H (2014) Involving
co-amorphous drug formulations by the addition of the highly water soluble amino acid, proline. Pharmaceutics 6:416–435
25. Krebs HA, Notton BM, Hems R (1966) Gluconeogenesis in mouse-liver slices. Biochem J 101:607–617
26. Chen Y, Cao Y, Zhao L, Kong X, Hua Y (2014) Macronutrients and micronutrients of soybean oil bodies extracted at different pH. J Food Sci 79:C1285–C1291
27. Bois-Joyeux B, Chanez M, Azzout B, Peret J (1986) Studies on the early changes in rat hepatic fructose 2,6-bisphosphate and enzymes in response to a high protein diet. J Nutr 116:446–454 28. Li H, Lee J, He C, Zou M-H, Xie Z (2014) Suppression of the
mTORC1/STAT3/Notch1 pathway by activated AMPK prevents hepatic insulin resistance induced by excess amino acids. Am J Physiol Endocrinol Metab 306:E197–E209
29. Peters AL, Davidson MB (1993) Protein and fat effects on glu-cose responses and insulin requirements in subjects with insulin-dependent diabetes mellitus. Am J Clin Nutr 58:555–560 30. Kiehm TG, Anderson JW, Ward K (1976) Beneficial effects of
a high carbohydrate, high fiber diet on hyperglycemic diabetic men. Am J Clin Nutr 29:895–899
31. Chandalia M, Garg A, Lutjohann D et al (2000) Beneficial effects of high dietary fiber intake in patients with type 2 diabe-tes mellitus. N Engl J Med 342:1392–1398