A NEW FORMULA FOR RATE OF SWELLING OF
EXPANSIVE CLAY SOILS
Agus Setyo Muntohar * And Roslan Hashim**
*
Department of Civil Engineering,
Muhammadiyah University of Yogyakarta, Yogyakarta, Indonesia 55183
**
Department of Civil Engineering, University of Malaya, Kuala Lumpur, Malaysia.
ABSTRACT
The study of engineered expansive soils attracts the attention of researchers since this soil is mixed and increasingly used in many geotechnical and geoenvironmental application. This paper attempts to the study of swelling properties i.e. swell and swelling pressure, rate of swell, and water adsorption during swell. The kaolin-bentonite mix and sand-bentonite mix specimens are statically compacted and tested in conventional oedometer apparatus for swelling determination. The results of the study show that the mechanism of swell follows three distinct stages: intervoid, primary, and secondary swelling. The swell occurs since the soils adsorb water during water uptake. The rate of swell and maximum swelling are successfully determined using hyperbolic equation.
Key words: expansive soil, swelling, rate of swell, water adsorption
INTRODUCTION
Potentially expansive soils, commonly, are found almost anywhere in the world, especially in the arid or semi-arid regions, and temperate climate zones. Although expansive soils have been recognized as problematic soils, but in the underdeveloped countries, much of expansive soils problems may not have been recognized. During many decades ago, severe damage of structure, for example foundation and floor crack, roadway distress, have been reported in many countries.
researchers since this soil is mixed and increasingly used in many geotechnical and geoenvironmental application. Thus, further understanding of the mechanism and properties of swelling lead to increase the confidence level before applying such materials in the field. This paper presents the study of swelling and also establishes a simple correlation with water adsorption during swelling.
Basic considerations
Previous researchers have been studied swelling behavior, mechanics of swelling, and compressibility of expansive soil mixtures (Sivapullaiah et al., 1996; Komine and Ogata, 1994, Alawaji, 1999). The researches discuss interestingly on the effect of factors affecting swelling and compressibility of expansive soils such as initial water content and initial dry density. Sridharan and Nagaraj (1999) denote that plastic clay under zero confining pressure will imbibe water until their water absorption capacity becomes zero and reach an equilibrium condition. Since the magnitude of water adsorption will depend upon the equilibrium suction pressure in the sample, which will depend on the height of the sample above the water source. The swell of expansive is strongly related to the variation of water content. It will be swelling as water content increases. This soil-water characteristics curve is commonly used for the relationship between soil suction and volumetric or gravimetric water content (Miao et al., 2002; Alonso et al., 1999). However, the attention also has to be related to the rate of swelling and the variation of water adsorption during swelling.
RESEARCH METHOD
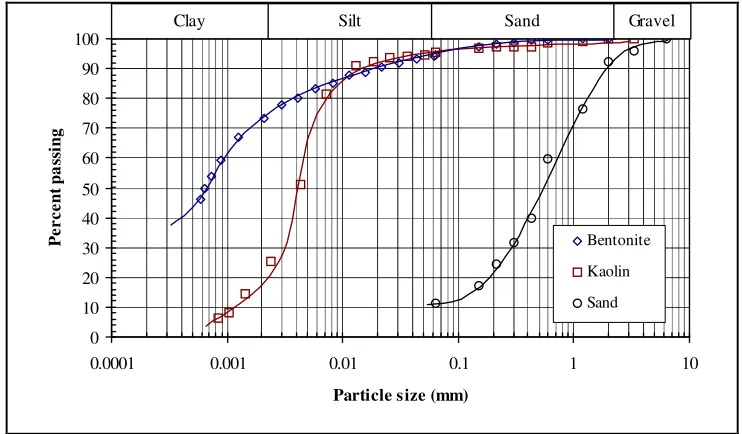
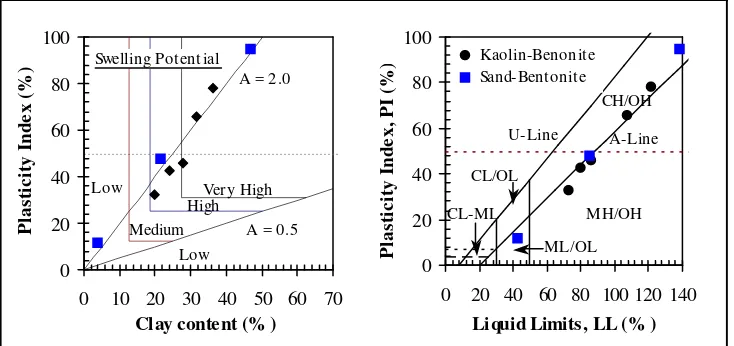
The soils used in this study are commercial bentonite clay, kaolin, and fine sand. The particle size distributions of the soils are shown in Figure 1, and the basic properties are listed in Table 1. These soils were mixed between bentonite – kaolin and bentonite - sand to produce varies specimens. Percentage of bentonite by weight is varied 5, 10, 20, and 30 percents for kaolin – bentonite mixture and 10, 30, and 50 percents for sand – bentonite mixture. The index properties of this soil samples are presented in Table 2 and the plasticity and potential expansiveness of soil – bentonite mixtures are illustrated in Fig. 2.
Table 1.Physical properties of the soil used
Soils description
Sand %
Silt %
Clay %
D50
m LL PL LS Activity, PI/CF Bentonite a 5.4 2.4 73.2 0.62 307.3% 45.4% 17.4% 3.6
Kaolin 4.3 75.6 19.9 4.1 72.3% 39.8% 6.6% 1.6
Note: a Wyoming bentonite,b Mining sand (24.5% Gravel), NP : non-plastic, LL : Liquid Limit, PL : Plastic Limit, LS : Linear Shrinkage, PI : plasticity Index, CF : Clay fraction
0 10 20 30 40 50 60 70 80 90 100
0.0001 0.001 0.01 0.1 1 10
Particle size (mm)
P
e
r
c
e
n
t
p
a
ss
in
g
Bentonite Kaolin Sand
Clay Silt Sand Gravel
Figure 1.Particle size distribution of soils.
Table 2. Index properties of soil samples
Soils description Soil Code
CF (%) LL (%) PL (%) PI (%) LS (%)
Kaolin–Bentonite Mixtures
5% Bentonite KB1 26.9 76.9 39.4 37.5 7.7 10% Bentonite KB2 30.0 89.7 42.2 47.5 12.3 20% Bentonite KB3 32.5 106.8 44.4 62.4 13.8 30% Bentonite KB4 39.0 121.5 43.1 78.4 14.0 Sand–Bentonite Mixtures
10% Bentonite SB1 4.0 42.9 21.1 21.8 2.4 30% Bentonite SB2 21.7 85.1 27.2 57.9 4.3 50% Bentonite SB3 47.0 138.3 43.2 95.1 8.8
curvature (Cc) are 9.08 and 1.19 respectively. Further, the sand can be classified into well-graded sand with gravel (SW). Muntohar and Hashim (2002) reported that the clay fraction in the kaolin-bentonite and sand-bentonite mixtures increased almost linearly with increasing bentonite content.
0 20 40 60 80 100
0 20 40 60 80 100 120 140
Liquid Limits, LL (% )
P la st ic it y I n d e x , P I (%
) Kaolin-Benonit e
Sand-Bentonit e A-Line U-Line MH/OH ML/OL CL/OL CH/OH CL-ML 0 20 40 60 80 100
0 10 20 30 40 50 60 70 Clay content (% )
P la st ic it y I n d e x ( % ) Very High High Medium Low Low
A = 0.5 A = 2.0 Swelling Pot ent ial
Figure 2. Potential expansiveness and plasticity chart of soil-bentonite mixtures.
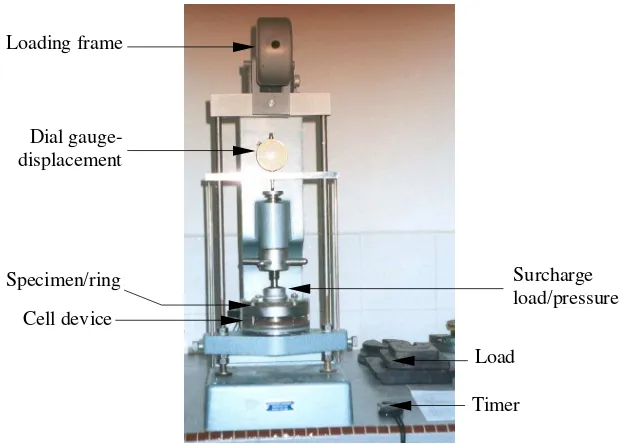
Timer
Surcharge load/pressure Specimen/ring
Load Dial
gauge-displacement
Cell device Loading frame
Figure 3. Rear oedometer for swelling determination.
ANALYSIS AND DISCUSSION
Swelling Mechanism
Elapsed Time (min)
0.1 1 10 100 1000 10000
S w e ll ( % ) 0 10 20 30 40 50 5% 10% 20% 30% 10% 30% 50% Percent Bentonite: Kaolin-Bentonite (KB) Sand-Bentonite (SB)
Figure 4. Swelling behavior (as percent of initial height) of s
oil-bentonite mixtures.
Elapsed Time (min)
0.1 1 10 100 1000 10000
P e r c e n ta g e o f T o ta l S w e ll ( % ) 0 20 40 60 80 100 5% 10% 20% 30% 10% 30% 50% Percent Bentonite: (KB) (SB)
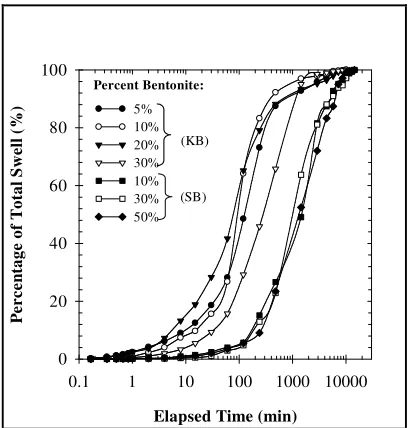
Figure 5. Swelling behavior (as percent of total swell) of soil-bentonite mixtures.
maximum amount of swelling generally increases with increasing bentonite content. Figure 4 depicts, even at the same percentage of bentonite, that considerable differences exist in the nature of time-swell relationship. At low bentonite content, the rate of swelling is very slow with sand but increases gradually with decrease in the particle size of the non-swelling fraction.
Figure 5 replots the time-swell relationship as percentage of the maximum swell. Here, the percent swell at a particular time is calculated as the ratio of amount of swell of the mixture at that time to the total swell and is denoted as a percentage. This is observed that for sand – bentonite mixtures, the rate of swelling is very slow and follow a similar swell path. In other hand, it was observed that the swelling almost completed within 1440 min (24 hrs) for kaolin mixtures for all percentage of bentonite.
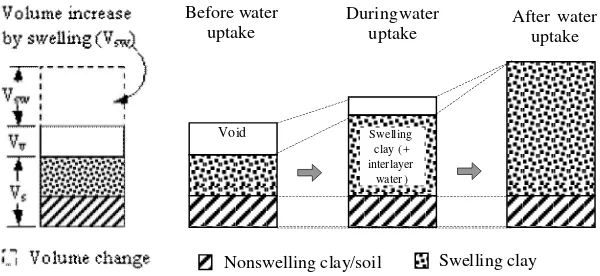
Dakshanamurthy (1978) notes two stage of swelling. In the first stage of hydration of dry clay particles, water is adsorbed in successive monolayer on the surface of montmorillonite clay apart which referred to as interlayer or intercrystalline swelling. The second phase of swelling is due to double-layer repulsion. Large volume changes accompany this stage of swelling. These occurrences can be approached closer as illustrated in Figure 6, which the curve can be divided into three phases. Initial swelling is generally less than 10% of the total swelling. This is essentially due to swelling of the bentonite clay particles within the voids of the coarser non-swelling fraction.
Void Swelling
clay (+ interlayer
water)
Nonswelling clay/soil Swelling clay Before water
uptake After uptake water
During water uptake
Figure 6. The model of swelling deformation of compacted expansive clay.
Furthermore, the swelling mechanism of compacted expansive clay can be illustrated by the model as given in Figure 6. The volume of swelling clay particles, such as montmorillonite, increase by absorbing water into the interlayer of montmorillonite, and the void in the compacted expansive clay are filled by this volume
Rate of Swelling and Maximum Swelling
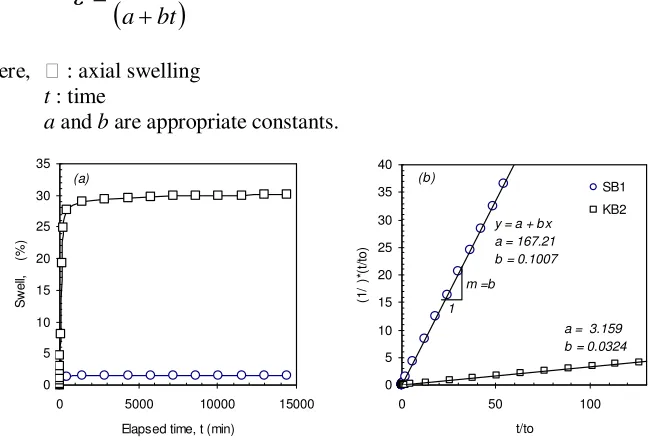
It is very limited reference discussing the rate of swelling. Basma and Tuncer (1991) defined the rate of swelling as the time to 50% swell, t50s, i.e. the time to half the full swell. This definition was adopted from theory for determination of rate of consolidation. However, it should be taken note that mechanics of swell and consolidation are totally different. Daksanamurthy (1978) propose a hyperbolic equation to predict swelling of expansive soils as given in equation 1.
a
bt
t
(1)where, : axial swelling t : time
a and b are appropriate constants.
0 5 10 15 20 25 30 35
0 5000 10000 15000
Elapsed time, t (min)
S w e ll,e ( % ) (a)
y = a + b x a = 167.21 b = 0.1007
a = 3.159 b = 0.0324
0 5 10 15 20 25 30 35 40
0 50 100
t/to (1 /e )* (t /t o ) SB1 KB2 m =b 1 (b)
Figure 7. Determination of the coefficients rate of swelling.
The constants, a and b, can be obtained by means linearized the non linear curved. Typical plots of percentage vertical swelling, e, versus time, t, as presented
in Figure 7a, have been transformed into plots of
t
versus t. It should be noted
swelling path. Moreover, the rate of swelling can be known by the value of the slope, b, which it shows the flow of swelling path. Therefore, b is then defined as coefficient of rate of swelling. The steeper slope is a sign of the rate of swelling is shorter than plane slope as shown in Figure 7b, which the rate of swelling of SB1 soil is faster than KB1 soil. The coefficients of rate of swelling for each tested specimens, ms, are presented in Table 3.
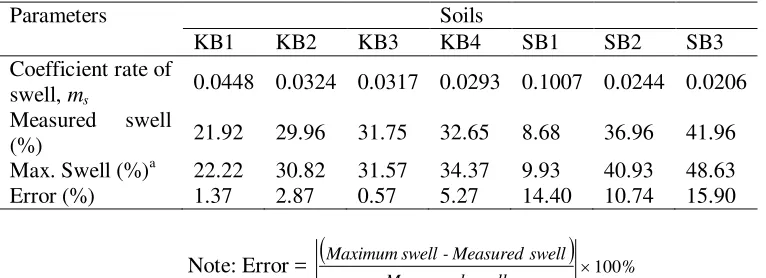
Table 3. Swelling properties of expansive soils
Parameters Soils
KB1 KB2 KB3 KB4 SB1 SB2 SB3 Coefficient rate of
swell, ms
0.0448 0.0324 0.0317 0.0293 0.1007 0.0244 0.0206
Measured swell
(%) 21.92 29.96 31.75 32.65 8.68 36.96 41.96 Max. Swell (%)a 22.22 30.82 31.57 34.37 9.93 40.93 48.63 Error (%) 1.37 2.87 0.57 5.27 14.40 10.74 15.90
Note: Error =
%swell easeured M
swell Measured
swell Maximum
100
The maximum swelling can be also predicted using hyperbolic equation, where is obtained from the asymptotic line of the hyperbola. It is calculated using equation 2 below.
b
1
b
t
a
1
lim
t
lim
t t
max
(2)Typical data presented in Table 3, basically, shows a good agreement between the maximum swelling predicted and the maximum swelling measured over a period of 10 days. However, the observation period is inadequate to present the maximum swelling especially for sand – bentonite mixtures samples as resulted in vast discrepancy (error). Meanwhile, several researchers state that the hyperbolic relationship proves an accuracy to predict maximum swelling (Dakshanamurthy, 1978; Al-Mukhtar et al., 1999; Waddah et al., 1999).
Water Absorption During Swell
particles such as montmorillonite increased by absorbing water into the interlayers of montmorillonite, and the voids in the compacted expansive clay are thought to be filled by this volume increase. This does not increase the volume of compacted expansive clays.
Based on the previous discussion and using a basic relationship among unit weight, void ratio, moisture content, and specific gravity, the water adsorption at the given time during swell can be determined as follows.
o s v o
1
e
V
V
e
1
e
(3)where, Vv = Vw = w Gs (4)
Vs = s
w s
G
(5)
Substitute equation 4 and 5 to equation 32, the approximate water adsorption (wa)
is given below.
wa =
w s oe
1
(6)where, eo : initial void ratio of specimen
s : density of soil particles (Mg/m
3
)
w : water density ( = 1 Mg/m
3
)
0 40 80 120 160 200
0 30 60 90 120 150
Elapsed time (x 100, minutes)
W a te r a d s o rp tio n , wa ( % ) KB1 KB2 KB3 KB4 SB1 SB2 SB3 (a) 0 40 80 120 160 200
0 10 20 30 40 50
Sw ell (%)
W a te r a d s o rp tio n , wa ( % ) (b)
Figure 8. Water adsorption during swelling
Swelling Pressure
Swell pressure is defined here as the pressure required to compress the specimen, that has been soaked and completed the swell under seating pressure, back into its original configuration (before swell). The swell pressure was measured by the pre-swelled method for simplicity; however, there is experimental evidence that different methods gave similar results (Borgesson, 1989; El-Sohby & Rabba, 1981) especially at high density.
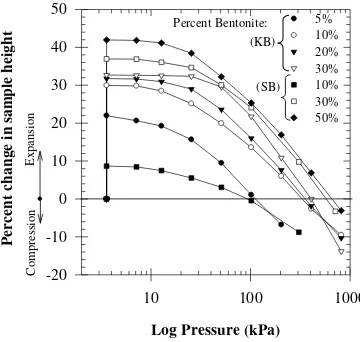
Figure 9 shows the change in sample height (%) and pressure (kPa) curves for soil – bentonite mixtures, which is determined from oedometer test. At least two essential values can be attracted from this results i.e. compressibility and swelling pressure of compacted soil.
Log Pressure (kPa)
10 100 1000
P e rc en t ch a n g e in s a m p le h e ig h t -20 -10 0 10 20 30 40 50 5% 10% 20% 30% 10% 30% 50% E xpa ns ion C o m pr es si o n Percent Bentonite: (KB) (SB)
The figure shows that the swell pressure increase with increasing bentonite content. Sand – bentonite mixtures exhibit greater swelling pressure than other mixtures. It is perhaps caused by the greater initial dry density and lower water content when the specimen was compacted. This is in agreement with El-Sohby and Rabba (1981).
Mathew and Rao (1997) indicate that by increasing the valence of exchangeable cations in homoionized clay, the overall compression in the system is reduced and the pre-consolidation pressure (pc) is increased. The equilibrium void ratio at any applied pressure is a direct function of the repulsive forces arising from the interaction of adjacent diffuse double layers and pore fluid. As the valence of exchangeable cations in the clay increased, there is a reduction in the diffuse double –layer thickness and in the magnitude of the repulsive forces. These finally result in a lower equilibrium void ratio at any given pressure until higher pressures are reached (Sridharan & Choudhury, 2002).
CONCLUSIONS
The swelling and swelling pressure of bentonite mixed kaolin and sand, generally increases in relation with bentonite percentage. Apart from the mineralogical and clay content, the amount and size of the non-swelling fraction play role in governing the swelling and compression behavior. In general, the swelling of soils occurs in three distinct stage: intervoid swelling (initial), primary swelling and secondary swelling. The volume change occurred since the compacted soil adsorbed water during water uptake which is linearly correlated to swell. The rate of swell and maximum swelling can be estimated by using hyperbolic equation. The rate of swell is term as coefficient rate of swell (ms) which is obtained from the constants of hyperbolic equation.
REFERENCES
Alawaji, H.A., 1999, “Swell and compressibility characteristics of sand – bentonite mixtures inundated with liquids”, Applied Clay Science, Vol. 15, Issues 3-4, pp. 411 – 430.
Al-Mukhtar, M., Touray, J.C., and Bergaya, F., 1999, “Une argile modèle pour l’étude du gonflement des sols argileux: la laponite-Na de synthèse”, Sciences de la terre et des planètes, Vol. 329, pp. 239 – 242.
Alonso, E.E., Vaunat, J., and Gens, A., 1999, ”Modeling the mechanical behaviour of expansive clays”, Engineering Geology, Vol. 54, pp. 173 – 183.
Borgesson, L., 1989, “Laboratory testing and computer simulation of clay barrier behavior”, Proceeding, The Ninth International Clay Conference, AIPEA, Strasbourg, pp. 117 – 126.
Daniel, D.E. and Wu, Y.K., 1993, Compacted clay liners and covers for arid sites, Journal of Geotechnical Engineering, ASCE Vol. 119 (2), pp. 223 – 237. El-Sohby, M.A., and Rabba, E.A., 1981, “Some factors affecting swelling of
clayey soils”, Geotechnical Engineering, Vol. 12, pp. 19 – 39.
Mathew, P.K., and Rao, S.N., 1997, “Influence of cations on compressibility behavior of a marine clay”, Technical Note, Journal of Geotechnical and Geoenvironmental Engineering, ASCE Vol. 123 (11), pp. 1071 – 1073. Miao, L., Liu, S., and Lai, Y., 2002, “ Research of soil-water characteristics and
shear strength features of Nanyang expansive soil”, Engineering Geology, Vol. 65, pp. 261 – 267.
Muntohar, A.S., and Hashim, R., 2002, “Properties of engineered expansive soils”, Proceeding, The 1st Technical Postgraduate Symposium, University of Malaya, 16 – 17 October 2002, pp. 272 – 276.
Sridharan, A., and Nagaraj, H.B., 1999, “Absorption water content and liquid limit of soils”, Geotechnical Testing Journal, Vol. 22 No. 2, pp. 121 – 127. Sridharan, A., and Choudhury, D., 2002, “Swelling pressure of sodium
montmorillonites”, Géotechnique, Vol. 52 No. 6, pp. 459 – 462.
Waddah, S. A., Khalid, A.A., and Al-Zou'bi, S.M., 1999, ” Influence of pore water chemistry on the swelling behavior of compacted clays”, Applied Clay Science, Vol.5, pp. 447 – 462.