SHRIMPS CAUGHT BY SET NET IN DIFFERENT
MANGROVE CONDITIONS IN THE ESTUARY
OF SUNGAI KAKAP, WEST KALIMANTAN
MACHMUD
POST GRADUATE SCHOOL
BOGOR AGRICULTURAL UNIVERSITY
BOGOR
THESIS STATEMENT AND INFORMATION SOURCES
Hereby I declare that thesis of Shrimps Caught by Set Net in Different Mangrove Conditions in the Estuary of Sungai Kakap, West Kalimantan is my own casing, and that no part of whole thesis has been printed or published in other universities yet. The information sources cited from other authors were mentioned in the text and in the references.
Bogor, September 2006
Machmud
ABSTRACT
MACHMUD. Shrimps Caught by Set Net in Different Mangrove Conditions in the
Estuary of Sungai Kakap, West Kalimantan. Under supervision of UNGGUL AKTANI, AGUSTINUS M. SAMOSIR, and ARIO DAMAR.
Mangrove ecosystem provides many benefits to local people both ecologically and economically. Unfortunately, the mangrove forest has been degraded, due to the increasing pressures of anthropogenic activities. Consequently, it would diminish most of the life supported by mangrove, and threaten the security of local people livelihood. This research was carried out to study the influence of mangrove plant conditions on shrimp catches in set nets and how this contribute to local management plan. The method applied for mangrove was transect line, and shrimps were collected with set net, and then they were related each other to analyze the influences. This study showed that links between mangrove plant conditions (area, density and coverage) and shrimp catch total and carapace length give positive regression. Significant positive correlations are shown by the relationship between percentage of mangrove area and number of Udang Ambai
(Metapenaeus lysianassa) with 1.0-1.5 cm carapace length with a simple linear regression
ABSTRAK
MACHMUD. Udang yang Ditangkap dengan Set Net (Ambai) pada Kondisi Mangrove yang Berbeda di Estuari Sungai Kakap, Kalimantan Barat. Dibimbing oleh UNGGUL AKTANI, AGUSTINUS M. SAMOSIR, dan ARIO DAMAR.
Ekosistem mangrove memiliki manfaat baik secara ekologi maupun ekonomi bagi kehidupan masyarakat lokal. Namun dengan meningkatnya aktivitas manusia, hutan mangrove mengalami degradasi yang akan menyebabkan menurunnya berbagai kehidupan yang ditopang oleh keberadaan ekosistem tersebut, dan akan mengancam pada mata pencaharian masyarakat lokal. Tujuan penelitian ini adalah untuk mengkaji pengaruh kondisi tanaman mangrove pada penangkapan udang di dalam set net dan kontribusinya terhadap perencanaan pengelolaaannya. Metode yang digunakan untuk mangrove adalah transek garis, dan udang ditangkap menggunakan set net (ambai), dan kemudian dihubungkan satu sama lain untuk menganalsis pengaruhnya. Hasil studi ini menunjukkan bahwa hubungan kondisi tanaman mangrove (luas, kerapatan dan penutupan) dan tangkapan udang total dan panjang carapace memberikan regresi yang positif. Persentase luas mangrove terhadap jumlah Udang Ambai (Metapenaeus lysianassa) dengan panjang
© Copyright property is owned by Machmud, 2006 All rights reserved
SHRIMPS CAUGHT BY SET NET IN DIFFERENT
MANGROVE CONDITIONS IN THE ESTUARY
OF SUNGAI KAKAP, WEST KALIMANTAN
MACHMUD
Thesis
as a partial fulfillment for Master Science Degree in Marine and Coastal Resources Management
POST GRADUATE SCHOOL
BOGOR AGRICULTURAL UNIVERSITY
BOGOR
Thesis Title : Shrimps Caught by Set Net in Different Mangrove Conditions in the Estuary of Sungai Kakap, West Kalimantan
Name : Machmud
Register Number : C251040334
Approved by Advisory Board
Dr. Unggul Aktani Supervisor
Ir. Agustinus M. Samosir, M.Phil.
Co-supervisor Dr. Ir. Ario Damar, M.Si. Co-supervisor
Acknowledged by Head of Study Program
Prof. Dr. Ir. Rokhmin Dahuri, M.S.
Dean of Post Graduate School
Dr. Ir. Khairil Anwar Notodiputro, M.S.
PREFACE
Hereby I would like to give thankfulness God who has been giving its blessing to me, so I could complete my thesis with title Shrimps Caught by Set Net in Different Mangrove Conditions in the Estuary of Sungai Kakap, West Kalimantan. This thesis is as a partial fulfillment for master science degree in Coastal and Marine Resources Management Study Program.
I acknowledge the Marine and Coastal Resources Management Project at Marine Affair and Fisheries for providing a scholarship of Sandwich Master Degree Program in Bogor Agricultural University and Aarhus University-Denmark.
I also thank all persons for supporting to complete my thesis and to finish this study program, namely:
1. Dr.Unggul Aktani, Ir. Agustinus M. Samosir, M.Phil and Dr. Ir. Ario Damar, M.Si as my supervisors who gave tuition, advices, and guidance to complete from proposal research to thesis.
2. Ir. Ki Agus Abdul Azis, M.Sc as a guess examiner and Dr. Ir. Mennofatria Boer, DEA as a academic commission examiner for giving corrections and suggestions to improve this thesis.
3. The official of post graduate sandwich program; Dr.Ir. Bambang Widigdo, M.Sc, Dr. Ir. Yusli Wardiatno, M.Sc, Dr.Ir. M. Muklis Kamal. M.Sc, and Mrs. Ola for facilitating the need of sandwich students during study.
4. Prof. Vibeke Simonsen and Prof. Mogens from Aarhus University Denmark who gave suggestions and guidance in my minor thesis composing during the study in Aarhus University, Denmark
5. Mr. Hardiono and staff from Fisheries Resort of Sungai Kakap for assisting during data collection.
6. My colleagues in post graduate sandwich program; Zainal, Zaitul, Efrizal, Saptoyo, Edo, Coki, Kusdiantoro, Neti, Normawati, Yesi, and Eiren for cooperation, friendship, support, and advices during study.
7. All relations who could not be mentioned individually for their assistances and cooperation.
Finally, I hope this thesis can give benefits to every one who need it. .
BIOGRAPHY OF AUTHOR
The author was born in Sumedang West Java on 08 January 1973 from the couple of H.Odjo, BA and Hj. Runasih, and the youngest from four brothers.
In 1992, the author was graduated from Senior High School (SMAN 2 Sumedang), and in 1997 the author was graduated from Bogor Agricultural University (Institut Pertanian Bogor) with Program Study of Agricultural Economic and Resources, Socia l Economic Departement, Faculty of Agriculture. In 2004, the author got schoolarship of Sandwich Master Degree Program in Bogor Agricultural University and Aarhus University-Denmark provided by Marine and Coastal Resources Management Project (MCRMP) at Ministry of Marine Affair and Fisheries.
The author is a government employee, from 1998 to 2003 he had been working in Ministry of Agriculture Jakarta, and from 2003 to day he have been working in Ministry of Marine Affair and Fisheries Jakarta.
DEDICATION
TO
My mother, Hj. Runasih and my father, H. Odjo, BA who have mothered, educated, guided and prayed.
And TO
My wife, Nurul Quddusy, SP for her unfailing love, support and prayer, and to our children, Sulthon Kamel, Izatannisa Nurma Ramadhani, Tsamada Akhsani, and Dhia
SHRIMPS CAUGHT BY SET NET IN DIFFERENT
MANGROVE CONDITIONS IN THE ESTUARY
OF SUNGAI KAKAP, WEST KALIMANTAN
MACHMUD
POST GRADUATE SCHOOL
BOGOR AGRICULTURAL UNIVERSITY
BOGOR
THESIS STATEMENT AND INFORMATION SOURCES
Hereby I declare that thesis of Shrimps Caught by Set Net in Different Mangrove Conditions in the Estuary of Sungai Kakap, West Kalimantan is my own casing, and that no part of whole thesis has been printed or published in other universities yet. The information sources cited from other authors were mentioned in the text and in the references.
Bogor, September 2006
Machmud
ABSTRACT
MACHMUD. Shrimps Caught by Set Net in Different Mangrove Conditions in the
Estuary of Sungai Kakap, West Kalimantan. Under supervision of UNGGUL AKTANI, AGUSTINUS M. SAMOSIR, and ARIO DAMAR.
Mangrove ecosystem provides many benefits to local people both ecologically and economically. Unfortunately, the mangrove forest has been degraded, due to the increasing pressures of anthropogenic activities. Consequently, it would diminish most of the life supported by mangrove, and threaten the security of local people livelihood. This research was carried out to study the influence of mangrove plant conditions on shrimp catches in set nets and how this contribute to local management plan. The method applied for mangrove was transect line, and shrimps were collected with set net, and then they were related each other to analyze the influences. This study showed that links between mangrove plant conditions (area, density and coverage) and shrimp catch total and carapace length give positive regression. Significant positive correlations are shown by the relationship between percentage of mangrove area and number of Udang Ambai
(Metapenaeus lysianassa) with 1.0-1.5 cm carapace length with a simple linear regression
ABSTRAK
MACHMUD. Udang yang Ditangkap dengan Set Net (Ambai) pada Kondisi Mangrove yang Berbeda di Estuari Sungai Kakap, Kalimantan Barat. Dibimbing oleh UNGGUL AKTANI, AGUSTINUS M. SAMOSIR, dan ARIO DAMAR.
Ekosistem mangrove memiliki manfaat baik secara ekologi maupun ekonomi bagi kehidupan masyarakat lokal. Namun dengan meningkatnya aktivitas manusia, hutan mangrove mengalami degradasi yang akan menyebabkan menurunnya berbagai kehidupan yang ditopang oleh keberadaan ekosistem tersebut, dan akan mengancam pada mata pencaharian masyarakat lokal. Tujuan penelitian ini adalah untuk mengkaji pengaruh kondisi tanaman mangrove pada penangkapan udang di dalam set net dan kontribusinya terhadap perencanaan pengelolaaannya. Metode yang digunakan untuk mangrove adalah transek garis, dan udang ditangkap menggunakan set net (ambai), dan kemudian dihubungkan satu sama lain untuk menganalsis pengaruhnya. Hasil studi ini menunjukkan bahwa hubungan kondisi tanaman mangrove (luas, kerapatan dan penutupan) dan tangkapan udang total dan panjang carapace memberikan regresi yang positif. Persentase luas mangrove terhadap jumlah Udang Ambai (Metapenaeus lysianassa) dengan panjang
© Copyright property is owned by Machmud, 2006 All rights reserved
SHRIMPS CAUGHT BY SET NET IN DIFFERENT
MANGROVE CONDITIONS IN THE ESTUARY
OF SUNGAI KAKAP, WEST KALIMANTAN
MACHMUD
Thesis
as a partial fulfillment for Master Science Degree in Marine and Coastal Resources Management
POST GRADUATE SCHOOL
BOGOR AGRICULTURAL UNIVERSITY
BOGOR
Thesis Title : Shrimps Caught by Set Net in Different Mangrove Conditions in the Estuary of Sungai Kakap, West Kalimantan
Name : Machmud
Register Number : C251040334
Approved by Advisory Board
Dr. Unggul Aktani Supervisor
Ir. Agustinus M. Samosir, M.Phil.
Co-supervisor Dr. Ir. Ario Damar, M.Si. Co-supervisor
Acknowledged by Head of Study Program
Prof. Dr. Ir. Rokhmin Dahuri, M.S.
Dean of Post Graduate School
Dr. Ir. Khairil Anwar Notodiputro, M.S.
PREFACE
Hereby I would like to give thankfulness God who has been giving its blessing to me, so I could complete my thesis with title Shrimps Caught by Set Net in Different Mangrove Conditions in the Estuary of Sungai Kakap, West Kalimantan. This thesis is as a partial fulfillment for master science degree in Coastal and Marine Resources Management Study Program.
I acknowledge the Marine and Coastal Resources Management Project at Marine Affair and Fisheries for providing a scholarship of Sandwich Master Degree Program in Bogor Agricultural University and Aarhus University-Denmark.
I also thank all persons for supporting to complete my thesis and to finish this study program, namely:
1. Dr.Unggul Aktani, Ir. Agustinus M. Samosir, M.Phil and Dr. Ir. Ario Damar, M.Si as my supervisors who gave tuition, advices, and guidance to complete from proposal research to thesis.
2. Ir. Ki Agus Abdul Azis, M.Sc as a guess examiner and Dr. Ir. Mennofatria Boer, DEA as a academic commission examiner for giving corrections and suggestions to improve this thesis.
3. The official of post graduate sandwich program; Dr.Ir. Bambang Widigdo, M.Sc, Dr. Ir. Yusli Wardiatno, M.Sc, Dr.Ir. M. Muklis Kamal. M.Sc, and Mrs. Ola for facilitating the need of sandwich students during study.
4. Prof. Vibeke Simonsen and Prof. Mogens from Aarhus University Denmark who gave suggestions and guidance in my minor thesis composing during the study in Aarhus University, Denmark
5. Mr. Hardiono and staff from Fisheries Resort of Sungai Kakap for assisting during data collection.
6. My colleagues in post graduate sandwich program; Zainal, Zaitul, Efrizal, Saptoyo, Edo, Coki, Kusdiantoro, Neti, Normawati, Yesi, and Eiren for cooperation, friendship, support, and advices during study.
7. All relations who could not be mentioned individually for their assistances and cooperation.
Finally, I hope this thesis can give benefits to every one who need it. .
BIOGRAPHY OF AUTHOR
The author was born in Sumedang West Java on 08 January 1973 from the couple of H.Odjo, BA and Hj. Runasih, and the youngest from four brothers.
In 1992, the author was graduated from Senior High School (SMAN 2 Sumedang), and in 1997 the author was graduated from Bogor Agricultural University (Institut Pertanian Bogor) with Program Study of Agricultural Economic and Resources, Socia l Economic Departement, Faculty of Agriculture. In 2004, the author got schoolarship of Sandwich Master Degree Program in Bogor Agricultural University and Aarhus University-Denmark provided by Marine and Coastal Resources Management Project (MCRMP) at Ministry of Marine Affair and Fisheries.
The author is a government employee, from 1998 to 2003 he had been working in Ministry of Agriculture Jakarta, and from 2003 to day he have been working in Ministry of Marine Affair and Fisheries Jakarta.
DEDICATION
TO
My mother, Hj. Runasih and my father, H. Odjo, BA who have mothered, educated, guided and prayed.
And TO
My wife, Nurul Quddusy, SP for her unfailing love, support and prayer, and to our children, Sulthon Kamel, Izatannisa Nurma Ramadhani, Tsamada Akhsani, and Dhia
TABLE OF CONTENTS
Pages
LIST OF TABLES ... xi
LIST OF FIGURES ... xii
LIST OF APPENDIXS ... xiv
INTRODUCTION ... 1
Background ... 1
Hypothesis ... ... 2
Objectives ... 2
Advantages ... 2
LITERATURE REVIEWS ... 3
Mangrove ... 3
Shrimps ... 4
Relationship between Mangrove and Shrimps ... 5
Management of Mangrove and Shrimp Catches ...………. 7
METHODS ………... 10
Research Framework …... 10
Study Area ... 10
Data Collections ... 12
Mangrove ... 12
Shrimps ... 13
Data Analyses ... 14
RESULT AND DISCUSSION ... 18
Result ... 18
Mangrove Conditions in the Estuary of Sungai Kakap……... 18
Set Net Fishery in the Estuary of Sungai Kakap ... 19
Relationship between Mangrove and Shrimp Catches ... 21
Discussion ... 27
Relationship between Mangrove and Shrimp in the Estuary of Sungai Kakap ... 27
Management of Mangrove and Set Net Fishery... 30
CONCLUSION AND RECOMMENDATION ... 34
Conclusion ………... 34
Recommendation ………..…... 34
REFERENCE ... 35
LIST OF TABLES
Pages 1 The kinds of mangrove data, procedures, and equipments conducted
during sampling in the estuary of Sungai Kakap, 2006 ... 13 2 The kinds of shrimp data, procedures, and equipments conducted during
sampling in the estuary of Sungai Kakap, 2006 ... 13 3 A design of regression with more than value of Y (shrimp catches) per
value of X (mangrove condition) with equal sample sizes ... 17 4 The present covering of mangrove area in the estuary of Sungai Kakap,
2006 ……….. 18
5 Share of species to total shrimp abundance in six different stations (ST),
the estuary of Sungai Kakap, 2006... 20 6 Distribution mean
(
x±SE)
of individual shrimp numbers per set net in sixLIST OF FIGURES
Pages 1 The life cycle of penaeid shrimps (Masrtosudarmo and
Ranoemihardjo, 1979 in Eidman et al., 1983) ... 4 2 The research framework of the influence of mangrove conditions on
shrimp catches in set nets ... 10 3 A map of Sungai Kakap Sub District, Pontianak District, West
Kalimantan ... 11 4 Schematic representation of sampling for mangroves and shrimp
catches in the set nets in the estuary of Sungai Kakap ... 12 5 The density, coverage and important value of mangroves in six
different stations, the estuary of Sungai Kakap, 2006 ... 19 6 Distribution mean
(
x±SE)
of M. lysianassa numbers with 1.0-1.5 cmCL and 1.6-2.0 cm CL in six different stations, the estuary of Sungai
Kakap, 2006 ………... 21
7 The regression line and equation between percentage of mangrove area (S. caseolaris and N. fruticans) and individual number of shrimp
catches ……… 22
8 The regression line and equation between percentage of mangrove area (S. caseolaris and N. fruticans) and individual number of M.
lysianassa (1.0-1.5 cm CL) ……… 23
9 The regression line and equation between density of S. caseolaris and
individual number of shrimp catches ………. 23 10 The regression line and equation between density of S. caseolaris and
individual number of M. lysianassa (1.0-1.5 cm CL) ……… 24
11 The regression line and equation between density of N.fruticans and
individual number of M. lysianassa (1.0-1.5 cm CL) ……… 24
12 The regression line and equation between coverage of S. caseolaris
and individual number of shrimp catches ……….. 25 13 The regression line and equation between coverage of S. caseolaris
and individual number of M. lysianassa (1.0-1.5 cm CL) ………. 25
14 The regression line and equation between coverage of N.fruticans and
individual number of M. lysianassa (1.0-1.5 cm CL) ……… 25
15 The regression line and equation between Important Value of S.
16 The regression line and equation between Important Value of S.
caseolaris and individual number of M. lysianassa (1.0-1.5 cm CL) … 26
17 The regression line and equation between Important Value of
N.fruticans and individual number of M. lysianassa (1.0-1.5 cm CL) .. 26
18 Zonings for land use planning of a mangrove and shrimp catch
LIST OF APPENDIXES
Pages 1 The Population of Sungai Kakap Subdistrict, 2003 ... 39 2 Physical parameters during sampling study in the estuary of Sungai
Kakap, 2006 ... 40 3 A set net fixed to sample shrimps in the estuary of Sungai Kakap ... 42 4 The features of “Berembang” (local name) in the estuary of Sungai
Kakap, 2006 ... 43 5 The features of “Udang Ambai”, “Udang Bajang”, “Udang Bulan”,
“Udang Gantung” and “Udang Galah” (local name) in the estuary of
Sungai Kakap, 2006 ... 44 6 Confidence limit of shrimp catches distribution
( )
(
)
(
x± tdf,95% ×SE)
or) 96 . 1
( SE
x± × for six different stations in the estuary of Sungai
Background
Mangrove ecosystem provides many benefits to local people, both ecologically and economically. Especially since this ecosystem gives important sources of food for incredible diverse lives, such as fishes, crabs, shrimps, prawns, and mollusks (Choong et al., 1990; Snedaker, 2005). Many penaeid species spawn in offshore, but they use mangroves as refuge and feeding grounds during later stages (Christensen, 1983). For instance, mangrove ecosystem in the estuary of Sungai Kakap has certain benefits on local fisheries specifically on shrimp catches.
Unfortunately, the mangrove ecosystem in the estuary of Sungai Kakap has been degraded, due to the increasing pressures of anthropogenic activities, such as agricultural activities, infrast ructure and residential. Study of Sudara and Singkran (2005) showed that mangrove degradation caused a decreasing in fish abundance and species richness. Furthermore, Melana et al. (2000) have shown that for every hectare of mangrove cut down, a corresponding reduction in fish catch is estimated to be 1.08 tons per year. Thus, the mangrove degradation in Sungai Kakap would threaten the shrimp catches in those areas, and finally impact the security of local people livelihood.
These causal-effect relatio nships should be understood by all stakeholders and adjusted by local government in making especially policy on coastal resources management. According to FAO (1995) the success of the resources management will be achieved if all people involved in the management strive to maintain or restore the coastal ecosystem.
Based on this phenomenon, the problems of study are formulated: 1. What are the present conditions of mangrove in Sungai Kakap?
2. Do the mangrove conditions influence on shrimp catches in set nets in Sungai Kakap?
2
Hypothesis
The shrimp catches in set nets are influenced by the mangrove conditions .
Objectives
The objectives of this study are:
1. To identify the characteristics and conditions of mangrove.
2. To identify the characteristics and distributions of shrimps in set nets. 3. To study the influence of mangrove conditions on shrimp catches in set nets. 4. To recommend a management alternative of mangrove and set net fishery.
Advantages
The advantages of this study are:
1. Academically, the study results are expected to enrich the education literatures, especially on the influence of mangrove conditions on shrimp catches in set nets, and able to become a source for next researchers to further studies.
Mangrove in estuary provides important roles on commercial fisheries specifically for shrimp productions. On the other hand, the anthropogenic activity pressures, such as residential and agricultural activities, cause damage to this ecosystem and can destroy the fisheries. From this knowledge the people should be understood about the relationship between the mangrove healtheness and fisheries production (Simonsen, 2005). This chapter will review mangrove, shrimps, and the management.
Mangrove
The mangrove terminology is used to define both a group of plants and a habitat type in the coastal zone (Spalding, 2001). Eventhough mangroves consist of a group of plants from many different genera and families; they exhibit numerous similarities in appearance, physiology, reproduction and adaptation to habitat (Osborne, 2000). Mangroves can survive in high salinity conditions, extreme tides, strong winds, high temperatures, muddy, and anaerobic soils (Kathiresan and Bingham, 2001). These adaptations to extreme conditions will determine the patterns of zonation in mangrove communities (Spalding, 2001).
According to Zamani (2005), in general the mangrove zonations are divided into three zones, namely: seaward zone, landward zone, and transition zone. The seaward zone is an area which is found in proximity to shallow marine systems with sandy substrates and often dominated by Avicennia and usually associated with Sonneratia. The landward zone
positioned behind the seaward zone is an area in the swamps dominated by Rhizophora,
Bruguiera and Xylocarpus (Chapman, 1976 in Choong et al., 1990). And the transition
zone is an area which located between mangrove forest and low land terrestrial forest, usually dominated by Nypa fruticans and several species of palm trees (Bengen, 2004).
Nypa fruticans is also mainly found along the channel margins in the upper and middle
reaches of South East Asian estuaries where the salinity is between 1‰ and 10‰ (Robertson et al., 1991 in Blaber, 1997).
In West Kalimantan, the mangrove vegetations as pioneer community are dominated by Api-Api (Avicennia marina), bogem (Sonneratia caseolaris) or perepat
(Sonneratia alba). In the river banks are usually grown by Bakau (Rhizophora mucronata
and Rhizophora apiculata). The landward sides are dominated by Berus (Bruguiera
4
mucronata and Rhizophora apiculata), while Nipah (Nypa fruticans) thrive in river bank
and estuary (The Strategic Planning (“Renstra”) of West Kalimantan Province, 2003).
Shrimps
The shrimps are classified as class of Crustacean, order of Decapoda, and suborder Natantia that are divided into three infraorders, Penaeidae, Caridea, and Stenopodidea (Dore and Frimodt, 1987). The infraorder of Panaeidae that included in the family Penaeidae of the super-family Penaeoidea is the important commercial shrimps of marine tropical and sub-tropical waters (Dall, 1981) that consist of two genuses, namely: Penaeus and Metapenaeus (Naamin, 1979 in Eidman et al., 1983) and that include 110 species (Holthis, 1980 in Eidman et al., 1983). For example, the important commercial shrimp in the estuary of Sungai Kakap is Metapenaeus lysianassa (“Udang Ambai” in local name),
with the total production 438.8 tons in 2005 (Fishery and Marine Resort of Sungai Kakap Sub District, 2006).
In nature, the penaeid shrimps have three kinds of life cycle involving shrimps live in offshore, shrimps live in inshore, and shrimps live in both the waters (Kirkegaard, 1975 in Eidman et al., 1983). However, almost all the shrimp larvae, both freshwater and seawater, need estuary for growing into juvenile (Martosudarmo and Ranoemihardjo, 1979 in Eidman et al., 1983; D’Abramo and Brunson, 1996). The juvenile of marine shrimps tend to move into deeper waters in accordance growth, and the sexual maturity is usually achieved in waters of oceanic salinity (Dall, 1981). Figure 1 describes the life cycle of shrimps from eggs to adult shrimp and their habitats.
Figure 1 The life cycle of penaeid shrimps (Masrtosudarmo and Ranoemihardjo, 1979 in Eidman et al., 1983).
water might be an important factor in the immigration of postlarval penaeid shrimp from the sea to their nursery grounds, such as estuaries, bays, and coastal lagoons. Pearse & Gunter (1957) in Mair (1980) noted that it was generally the younger or smaller stages of animals which inhabit low salinities, and although there are some exceptions, this certainly applies to the Penaeidae.
Chong et al. (1990) explained that the coastal mangroves and mud flats were important nursery areas for commercially important prawn species belonging to the genera Penaeus and Metapenaeus. Furthermore, Ronnback et al. (2002) showed that Penaeus
indicus had a significant prefe rence for fringe mangroves over the adjacent sand flat and
Metapenaeus monoceros was significantly more abundant in the sand flat than in the
mangrove fringe, although this habitat preference was not evident for juvenile and sub-adult life stages. Additionally, Eidman et al. (1983) showed that the abundances of
Metapenaeus ensis and M. lysianassa were influenced by spring and low tide, but the
abundances of Penaeus monodon and P. merguiensis in Banten Bay were not influenced
by tidal inundation.
Relationship between Mangrove and Shrimps
Mangrove has an important role as nursery grounds, feeding grounds, and spawning grounds for waters biotes (fishes, shrimps, crabs, molluscs, etc.) (Christensen, 1983; Choong et al. 1990; Baran and Hambrey, 1999; Kathiresan and Bingham, 2001; Spalding, 2001; Dahuri et al., 2001; Adeel and Pomeroy, 2002; Dahuri, 2003; Gunarto, 2004; Bengen, 2005). Two main reasons why mangrove is important as habitat for aquatic species are: (1) it provides abundance food for an incredible diversity of life, namely: coastal and offshore marine communities (Choong et al., 1990; Clough et al., 1994; Snedaker, 2005), (2) mangrove roots above and below the ground provide many different kinds of habitats, where aquatic animals can live and shelter from predation (Christensen, 1983; Clough et al., 1994; Melana et al., 2000; Ronnback et al., 2002).
6
influenced by the presence of vegetation like mangrove forests and seagrass beds (Ronnback et al., 2002)
Penaeid shrimp species in the Indo-Pacific are reported to have a preference for mangrove as nursery ground including Penaeus indicus (Chong et al., 1990), P.
merguiensis (Vance et al., 1990 in Ronnback et al., 2002), P. monodon (de Freitas, 1986 in
Ronnback et al., 2002), and P. penicil-latus (Chong et al., 1990). Other penaeid shrimp
species are, however, not confined to mangrove habitats as nursery grounds. For instance,
P. duorarum (Sheridan, 1992 in Ronnback et al., 2002), P. esculentus and P. semisulcatus
(Robertson & Duke, 1987 in Ro nnback et al., 2002) seem to have a preference for submerged macrophytes like seagrass and algal beds. Metapenaeus monoceros (de Freitas,
1986 in Ronnback et al., 2002) and M. ensis (Robertson & Duke, 1987 in Ronnback et al.,
2002) are more widespread, occurring on seagrasses, mud flats, mangrove channels, etc. Yanez-Arancibia et al. (1985) in Baran and Hambrey (1999) explained that a clear positive correlation was shown between commercial finfish catches and the total area of coastal vegetation - mostly mangroves in the Gulf of Mexico. Still in this area, Turner (1977) in Baran and Hambrey (1999) found a positive correlation between shrimp catches and the vegetated surface area of estuaries. In addition, Martosubroto and Naamin (1977) in Baran and Hambrey (1999), in Indonesia, showed a positive correlation between annual catch of prawns and area of mangrove. Paw and Chua (1989) in Baran and Hambrey (1999), found in the Philippines a positive correlation between mangrove area and penaeid shrimp catch. Staples et al. (1985) in Baran and Hambrey (1999), in Australia found a positive correlation between the total length of mangrove lined rivers and the annual catch of banana prawns, and Pauly and Ingles (1986) in Baran and Hambrey (1999) showed that most of the variance of the MSY (Maximum Sustainable Yield) of penaeids could be explained by a combination of area of mangrove habitats. Furthermore, Melana et al. (2000) have shown that for every hectare of mangrove cut down, a corresponding reduction in fish catch per year.
Ronnback et al. (1999) have described that the faunal distribution patterns in open water habitat dominated by mangrove community (Avicennia or Rhizophora) provide new
significant preference for fringe mangroves over the adjacent sand flat, and there was no correlation between shrimp abundance and organic content of sediment. Whereas,
Metapenaeus monoceros was significantly, more abundant in the sand flat than in the
mangrove fringe. In addition, Eidman et al. (1983) showed that the distribution pattern of shrimps follow the distribution pattern of mangrove (Avicennia sp), where the shrimp
abundances were less to upstream parallel with the richness of Avicennia species which
was also less to landward.
Management of Mangrove and Shrimp Catches
Management of mangrove ecosystems is an effort that should be done to prevent a decrease of mangrove areas, so that the roles of this ecosystem can be sustainable to fulfill the needs of the present without compromising the ability of future generations to meet theirs (UN, 1987). The fundamental objective of mangrove ecosystem management is to promote conservation, and where necessary restoration or rehabilitation and sustainable use of mangrove ecosystems and their associated habitats to benefit local to global populations (Macintosh and Ashton, 2005).
Identificatio n of existing condition of mangrove that based on the location, ecological characteristics and values could be used to determine the preservation, conservation or sustainable utilization areas. The pristine mangrove forest should be preserved or declared as forest reserves, while mangrove areas near or adjacent to known habitats important as fish, mollusk and crustacean nurseries and/or fishing grounds should not be alienated or released for development. Some mangrove areas in urban areas should be conserved exclusively for sustainable utilization by the local people who should be involved in any reforestation and maintenance efforts. Rehabilitating areas of destroyed mangroves through natural regeneration, assisted if necessary by active intervention, including restoration of the hydrological regime and/or planting mangroves. Mangroves on small islands serve as a major ecological component of the island ecosystem and should in no case be disturbed. Mangroves in estuarine areas should be protection zone areas of mangroves preserved on the banks of the mouth of the river fronting the sea (Macintosh and Ashton, 2005).
8
attention should be taken to support the livelihoods of mangrove fishers, to promote awareness of mangrove ecosystems, and to help local communities to adopt a sustainable management of mangrove.
According to Centre of Research and Fisheries Development (1992) management practice of shrimp resources should consider fisheries management strategic including size control, allowable catch number, effort control, and selective fishing gear in order to get the optimal and sustainable fisheries. A closing technique and fishing seasons are to control the number and shrimp sizes. Allowable catch size can be carried out by mesh size control so it can protect the young shrimps. Effort control is to prevent over fishing in certain area through to create a new fishing ground in other places or to limit the number of fishing effort wit h license restriction. While selective fishing gear is fishing gear, which have been designed to exclude/reduce the capture of unwanted sizes and species of fish and the incidental catch, and release these excluded fish from the fishing gear with a high survival (FAO, 1995).
As a river buffer zone, mangrove areas in Sungai Kakap are managed by Forestry Office (UU No 41 1999), while shrimp catches management is under Fishery Office, especially for fishing licenses of all fishing gears operated and fee of fishery business. Based on these regulations, the coordination between these institutions must be done to ensure the application of management. According to FAO (1995) the success of this management will be achieved if all people involved in this management strive to maintain or restore the coastal ecosystem. Therefore, the sustainable ecosystem management can be attained through community based management approaches that provide a sense of belongings with full participation, cooperation and empowerment of the all involved stakeholders
the management will be better implemented and managed when the local communities (i.e. fishermen) and other related stakeholders are more involved in the resources management and the access rights are distributed more effectively and rightfully.
METHODS
Research Framework
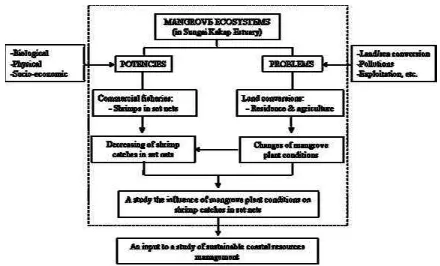
The research framework of shrimps caught by set net in different mangrove conditions in the estuary of Sungai Kakap is shown in Figure 2.
Figure 2 The research framework of shrimps caught by set net in different mangrove conditions.
Study Area
[image:35.596.84.524.204.470.2]population of Sungai Kakap Sub District) (Statistical Bureau of Pontianak District, 2003) (Appendix 1).
Figure 3 A map of Sungai Kakap Sub District, Pontianak Regency, West Kalimantan The physical characteristics in the estuary of Sungai Kakap recorded during the sampling are:
- The maximum tidal range was 0.3 –1.9 m (neap tide 0.82 m on 29 April 2006 and spring tide 1.60 m on 3 June 2006). The variation in high tide was ranged from 1.4 to 1.9 m, and in low tide was ranged from 0.3 to 0.6 m.
- Water and air temperature were 24 to 27 °C and 25 to 28 °C respectively.
- Salinity was 4 to 6 ‰. The low salinity levels reflected the large input of fresh water from three rivers, namely Kakap River, Pungur Kecil River and Pungur Besar River. - Rainfall varied from 0.4 to 41.8 ml.
- Water clarity and pH were 18 - 21 cm and 6.8 -7.1 respectively. - Water depth varied from 42 to 165 cm during low tide.
- Dissolved oxygen slightly fluctuated from 2.04 to 2.54 mg/l.
# # # # # # # # # # # #
South Chinese Sea
Pontianak City
Teluk Pakadai Sub District
Siantan Sub District
Jeruju Besar P. Panjang Kapuas River Punggur Kecil Sepuk Laut Sungai Kakap Sungai Itik Sungai Rengas Punggur Besar Tanjung Saleh P. Kurnia P. Nyamuk P. Sepuk Perupuk
P. Minyak
P.Tempurung
Sungai Belidak Pal IX
Rasau Jaya Sub District Kalimas
Sungai Kupah
Sout h chine se sea .s hp Sung ai ka kap sub district.shp Sung ai rengas.shp Sung ai itik.shp Sung ai ka kap .shp Je ruju.sh p Sung ai be lida k.shp Pont ianak city.shp Sung ai ku pah .sh p Pung gur kecil.shp Kalimas.shp Pal ix.shp Siant an sub district.shp Rasau jaya sub district.shp Tanjung saleh.shp Pung gur bes ar.shp Sepu k lau t. sh p
Teluk pake dai sub district. shp Mangrove conserv atio n a rea.shp Road. shp
Riv er.shp # Villa ge.shp
Sub district line.shp
N
E W
S
E 109°10’48” E 109°09’36” E 1 0 9°08’24”
E 109°07’12” E 109°12’ E 109°11’12” E 109°12’24” E 109°13’36” E 1 0 9°14’48” E 109°10’48”
E 109°09’36” E 109°08’24”
E 109°07’12” E 109°12’ E 109°11’12” E 109°12’24” E 109°13’36” E 109°14’48”
S 0 ° 04 ’48 ” S 0 ° 05 ’24 ” S 0 ° 03 ’36 ” S 0 ° 02 ’24 ” S 0 ° 01 ’12 ” 0 ° S 0 ° 06 ’36 ” S 0 ° 07 ’48 ” S 0 ° 09 ’ S 0 ° 10 ’12 ” S 0 ° 11 ’24 ” S 0 ° 12 ’36 ” S 0 ° 04 ’48 ” S 0 ° 05 ’24 ” S 0 ° 03 ’36 ” S 0 ° 02 ’24 ” S 0 ° 01 ’12 ” 0 ° S 0 ° 06 ’36 ” S 0 ° 07 ’48 ” S 0 ° 09 ’ S 0 ° 10 ’12 ” S 0 ° 11 ’24 ” S 0 ° 12 ’36 ” Legend: SUNGAI KAKAP SUB DISTRICT MAP PONTIANAK REGENCY
WEST KALIMANTAN
Source: Resort Policemen of Sungai Kakap Forestry Office of West Kalimantan
0 1 2 3 4 Km 1 : 70,000
South Chinese Sea
# # # # # # # # # # # #
South Chinese Sea
Pontianak City
Teluk Pakadai Sub District
Siantan Sub District
Jeruju Besar P. Panjang Kapuas River Punggur Kecil Sepuk Laut Sungai Kakap Sungai Itik Sungai Rengas Punggur Besar Tanjung Saleh P. Kurnia P. Nyamuk P. Sepuk Perupuk
P. Minyak
P.Tempurung
Sungai Belidak Pal IX
Rasau Jaya Sub District Kalimas
Sungai Kupah
Sout h chine se sea .s hp Sung ai ka kap sub district.shp Sung ai rengas.shp Sung ai itik.shp Sung ai ka kap .shp Je ruju.sh p Sung ai be lida k.shp Pont ianak city.shp Sung ai ku pah .sh p Pung gur kecil.shp Kalimas.shp Pal ix.shp Siant an sub district.shp Rasau jaya sub district.shp Tanjung saleh.shp Pung gur bes ar.shp Sepu k lau t. sh p
Teluk pake dai sub district. shp Mangrove conserv atio n a rea.shp Road. shp
Riv er.shp # Villa ge.shp
Sub district line.shp
N
E W
S
E 109°10’48” E 109°09’36” E 1 0 9°08’24”
E 109°07’12” E 109°12’ E 109°11’12” E 109°12’24” E 109°13’36” E 1 0 9°14’48” E 109°10’48”
E 109°09’36” E 109°08’24”
E 109°07’12” E 109°12’ E 109°11’12” E 109°12’24” E 109°13’36” E 109°14’48”
S 0 ° 04 ’48 ” S 0 ° 05 ’24 ” S 0 ° 03 ’36 ” S 0 ° 02 ’24 ” S 0 ° 01 ’12 ” 0 ° S 0 ° 06 ’36 ” S 0 ° 07 ’48 ” S 0 ° 09 ’ S 0 ° 10 ’12 ” S 0 ° 11 ’24 ” S 0 ° 12 ’36 ” S 0 ° 04 ’48 ” S 0 ° 05 ’24 ” S 0 ° 03 ’36 ” S 0 ° 02 ’24 ” S 0 ° 01 ’12 ” 0 ° S 0 ° 06 ’36 ” S 0 ° 07 ’48 ” S 0 ° 09 ’ S 0 ° 10 ’12 ” S 0 ° 11 ’24 ” S 0 ° 12 ’36 ” Legend: SUNGAI KAKAP SUB DISTRICT MAP PONTIANAK REGENCY
WEST KALIMANTAN
Source: Resort Policemen of Sungai Kakap Forestry Office of West Kalimantan
0 1 2 3 4 Km 1 : 70,000
0 1 2 3 4 Km 1 : 70,000
South Chinese Sea
12 - Soil characters included grumosol of the soil type, yellow red of the soil color, and soil
texture with a range from 11.4% to 18.40% of sand, 33.40% to 56.20% of silt, and 32.40% to 49.20 of clay
(Detailed in Appendix 2).
Data Collections
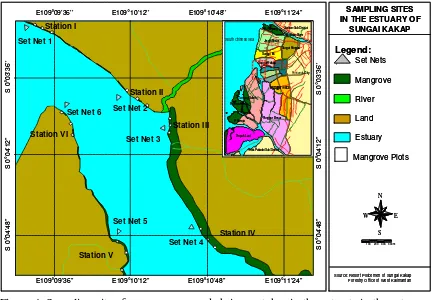
[image:37.596.85.520.353.653.2]The data collections had been divided into three places (each places has two stations) (Figure 4), namely; northern part of the east of estuary (Station I and II), southern part of the east of the estuary of Sungai Kakap(Station III and IV), and the west of estuary (Station V and VI), where they had some different conditions caused by natural factors, such as; river run of and mangrove species (Station I and II were dominated by “Nipah” (local name), Station III and IV were dominated by “Berembang” (local name), and Station V and VI were dominated by Berembang and Nipah.
Figure 4 Sampling sites for mangroves and shrimp catches in the set nets in the estuary of Sungai Kakap.
Mangroves
To identify the characteristics and conditions of mangrove plants, “Transect Line Plots” sampling method (English et al., 1994) was applied. Since the mangrove forest was a narrow (10-100 m), the number of permanent plots had been set up horizontally within
SAMPLING SITES IN THE ESTUARY OF
SUNGAI KAKAP Legend: Set Nets Mangrove River Land Estuary Mangrove Plots
Source: Resort Policemen of Sungai Kakap Forestry Office of West Kalimantan
N
E W
S
100 200 300 400 m l
i
E109°10’12’’ Set Net 1
Set Net 2
Set Net 3
Set Net 4 Set Net 5
Set Net 6
Station III Station IV Station VI Station V Station I Station II S 0 ° 04’12’’
E109°10’12’’
S 0
°
04’48’’
E109°10’48’’ E109°10’48’’ E109°09’36’’
E109°09’36’’ E109°11’24’’
E109°11’24’’
S 0 ° 04’48’’ S 0 ° 04’12’’ S 0 ° 03’36’’ S 0 ° 03’36’’ # # # # # # # # # # # # SouthChinese Sea Pontianak City
Teluk Pakadai Sub District Siantan Sub District Jer uju Besar P. Panjang
Kapuas River
Punggur Kecil
Sepuk L au t Sung ai Kakap
Sungai Itik Sungai Rengas
Punggur Besar Tanjun g Saleh
P. Ku rnia P. Nyamuk P. Sepuk Peru
# # # # # # # # # # # # SouthChinese Sea Pontianak # # # # # # # # # # # # SouthChinese Sea Pontianak City
Teluk Pakadai Sub District Siantan Sub District Jer uju Besar P. Panjang
Kapuas River
Punggur Kecil
Sepuk L au t Sung ai Kakap
Sungai Itik Sungai Rengas
Punggur Besar Tanjun g Saleh
P. Ku rnia P. Nyamuk P. Sepuk Peru
City
Teluk Pakadai Sub District Siantan Sub District Jer uju Besar P. Panjang
Kapuas River
Punggur Kecil
Sepuk L au t Sung ai Kakap
Sungai Itik Sungai Rengas
Punggur Besar Tanjun g Saleh
the fringe along the coast (Figure 4). The kinds of mangrove data, equipments and general procedures can be seen in Table 1.
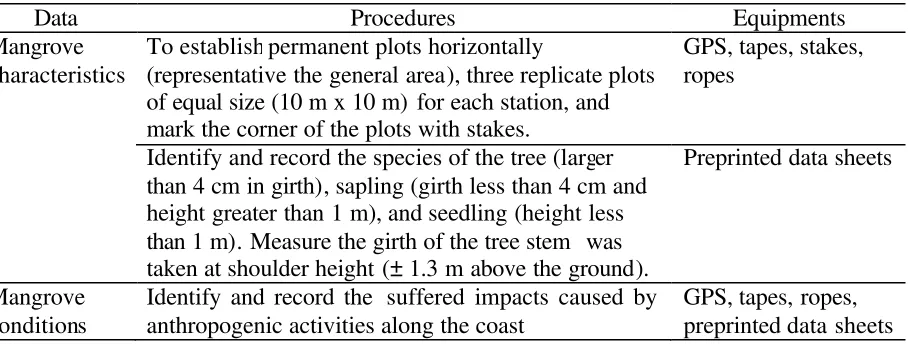
Table 1 The kinds of mangrove data, procedures, and equipments that were conducted during sampling in the estuary of Sungai Kakap, 2006
Data Procedures Equipments
Mangrove characteristics
To establish permanent plots horizontally
(representative the general area), three replicate plots of equal size (10 m x 10 m) for each station, and mark the corner of the plots with stakes.
GPS, tapes, stakes, ropes
Identify and record the species of the tree (larger than 4 cm in girth), sapling (girth less than 4 cm and height greater than 1 m), and seedling (height less than 1 m). Measure the girth of the tree stem was taken at shoulder height (± 1.3 m above the ground).
Preprinted data sheets
Mangrove conditions
Identify and record the suffered impacts caused by anthropogenic activities along the coast
GPS, tapes, ropes, preprinted data sheets
Shrimps
To examine the characteristics and productions of shrimps, shrimp catch data had been collected from six fishermen’s set nets (two sample points for each station) located along the coastal line parallel with mangrove sampling Stations. “Ambai” (set net) consist of loose netting attached between a V-shaped frame made from bamboos stakes or Nypa
fruticans leaves. It caught specially shrimps when it was low tide. A figure in the
[image:38.596.91.546.176.348.2]Appendix 3 describes a set net fixed to sample shrimps in the estuary of Sungai Kakap. The kinds of shrimp data, equipments and general procedures can be seen in Table 2. Table 2 The kinds of shrimp data, equipments and general procedures that were taken
during sampling in the estuary of Sungai Kakap, 2006
Data Procedures Equipments
Shrimp
characteristics
To determine the position of the station located front of mangrove sampling plots about 100 m distances (six stations)
GPS
To catch shrimps using fishermen’s set nets that had been determined as sample (eight replicates undertaken every week for two months, each replicate done in 15 minutes (06.00 – 08.00 a.m) during the study).
Labeled plastic bag
The caught shrimps were observed the species groups and calculated the numbers based on carapace length. Survey had been concentrated on shrimp specimen’s = 1 cm carapace length because of taxonomic problems with smaller specimens.
[image:38.596.84.544.582.782.2]14
Data Analyses
To analyze the mangrove plant healthiness including species density, species frequency, species basal area (coverage) and species important value of mangrove were analyzed with formulas as follows (English et al., 1994):
Density (D):
The density is a number of mangrove plants per unit area.
A n
D i
i = ... (1)
Where: ni = number of individuals of species i
A = area of the plot (m²) Relative Density (RD):
The relative density is comparative between number of plants of a mangrove species i and the total number of mangrove plants.
100
× =
∑
nn
RDi i ... (2)
Where: ni = number of individuals of species i
∑
n = total of number individuals (all species)Frequency (F):
The frequency is probability to be found species i in sampling plot.
∑
=
P P
Fi i ... (3)
Where: Pi = number of sampling where it is found species i
∑
P = total number of samplingRelative Frequency (RF):
The relative frequency is comparative between frequenc y species i and the total frequency. 100
× =
∑
FF
RFi i ... (4)
Where: Fi = frequency of species i
Coverage (C):
Calculate the basal area (BA) for the stand in m² per hectare (ha). BA for each tree is the cross-sectional area at breast height
( )
2 24 cm
DBH
BA= π ... (5)
Where: DBH = trunk diameter of species i
Converting cm² to m², and ground area from m² to hectares
1
2 −
⋅ =
∑
m haA BA
C ... (6)
Where:
∑
BA = total BA of species iA = area of the plot (m²) Relative Coverage (RC):
The relative coverage is comparative between basal area species i and the total basal area all species.
100
× =
∑
CC
RCi i ... (7)
Where: Ci = coverage species i
∑
C = total coverage all speciesImportant Value:
The important value of mangrove species (IVi) is sum of relative density (RDi), relative frequency (RFi), and relative coverage (RCi) (Curtis, 1969 in English at al., 1994)
i i i
i RD RF RC
IV = + + ... (8)
The important value of mangrove species is from 0 to 300. These values show a explanation about the influence or the role of a mangrove species in the mangrove communities.
16 impact, three for rather high impact, four for high impact, and five for severe impact (English et al., 1994)
The species of shrimp samples was observed by direct visual and then correlated with literatures about taxonomic of shrimps (Dore and Frimodt, 1987; Centre of Research and Fisheries Development, 1992); to handle the taxonomic problems, laboratory analysis was conducted.
The distribution of a sample mean analysis was done to know the distribution of the numbers of shrimps (based on both total number and carapace length’s number). The normal distribution has its own standard deviation, that is, a standard deviation of sample means (the standard error of the mean). The used formula was (Fowler and Cohen, 1990):
. .E S
x± ... (9)
Where:
x = a sample mean
n STDEV
SE= = Standard Error of the mean (standard deviation of a sample mean).
To be sure that a population mean lies between indicated limits was needed confidence limits (intervals), 95% or 99% limits was generally used. These were obtained by multiplying the standard error by the appropriate score (t-score or z-score). The formula was as follows:
.) . (t( ,95%) S E
x± df × (a small sample) ... (10)
.) . (z( ,95%) SE
x± df × or x±1.96SE(a large sample, more than 30 samples) ... (11)
Relationship between mangrove plant conditions and shrimp catches was done by a simple regression analysis (Fowler and Cohen, 1990). Simple regression analysis is based on main conditions, namely:
1. There is a linear relationship between a dependent Y variable (shrimp catches) and an independent X variable (mangrove conditions) which implied to be functional or causal. The expected value for the variable Y for any given value X is described by the linear function Y =a+bX
^
3. For any single defined observation of an X variable there is a theoretical population of Y value. The population is normally distributed and the variances of different populations of Y values corresponding to different individual X values are similar. For each value of X (mangrove condition) we sampled Y (shrimp catch) repeatedly, obtaining a sample distribution of Y-value at each of the chosen point of X. There were three different mangrove conditions (northern part of the east of estuary, southern part of the east of estuary, and the west of estuary) and eight replicated shrimp catches, and then there were established a regression of shrimp catches on mangrove conditions using Microsoft Excel program. Table 3 explained a computation design of regression with more than value of Y (shrimp catches) per value of X (mangrove condition) with equal sample sizes.
Table 3 A design of regression with more than value of Y (shrimp catches) per value of X (mangrove condition) with equal sample sizes
Observation
Mangrove conditions = X (a=3)
A B C
Shrimp catches = Y n = 8
Where:
A = northern part of the east of estuary B = southern part of the east of estuary C = the west of estuary
Finally to determine the management option of mangroves and shrimp catches was by zone plan and some other management purposed.
RESULT AND DISCUSSION
Result
Mangrove Conditions in the Estuary of Sungai Kakap
Mangroves in the estuary of Sungai Kakap were dominated by “Berembang”
(Sonneratia caseolaris) (Appendix 4)) and “Nipah” (Nypa fruticans). The mangrove area
[image:43.596.89.528.317.476.2]in the estuary of Sungai Kakap was 72.8 hectares originally (Ministry of Forestry, 1990). The rest of today reduce to around 35.8 hectares (50.8% declining). The main cause the decreasing was land conversion to agricultural activities (29.9%), building infrastructures (11.6%), and illegal mangrove cutting (9.3%) (Table 4).
Table 4 The present covering of mangrove areas in the estuary of Sungai Kakap, 2006 Descriptions A (%) B Area (hectares) (%) C (%) Total (%)
S. caseolaris and N. fruticans 4.3 16.8 24.9 99.6 6.6 29.6 35.8 49.2
Agricultural 10.8 42.4 0.0 0.0 10.9 49.2 21.7 29.9 Illegal Cutting (incl. shrubs) 2.0 7.8 0.1 0.4 4.7 21.2 6.8 9.3 Infrastructure (i.e. residential) 8.4 33.1 0.0 0.0 0.0 0.0 8.4 11.6 Total 25.6 100.0 25.0 100.0 22.2 100.0 72.8 100.0 Where:
A = northern part of the east of estuary B = southern part of the east of estuary C = the west of estuary
Table 4 also demonstrates the present area of mangroves in three different places. The highest mangrove area was found southern part of the east of estuary (99.6%), followed by the west of estuary (29.6%), and northern part of the east of estuary (16.8%).
Index of ‘human pressure’ showed that northern part of the east of estuary had a rather high impact (Σ Code = 3; illegal cutting, agriculture and infrastructures), southern part of the east of estuary had a slight impact (Σ Code = 1; illegal cutting), and the west of estuary had a moderate impact (Σ Code = 2; illegal cutting, agriculture).
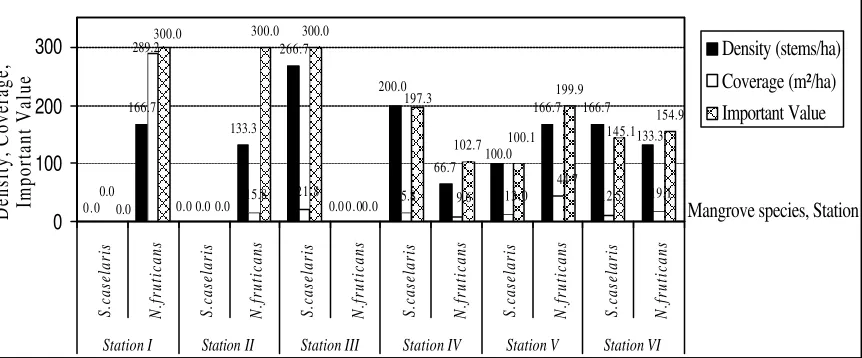
The health of mangrove in six different stations is shown in Figure 5. There is that the Station III was dominated by S. caseolaris with the density was 267 stems/ha, followed
by Station IV 200 stems/ha. The Station I and II were dominated by N. fruticans with the
density were 167 and 133 stems/ha respectively. In Figure 5 also describes that the Station III was covered only by S. caseolaris with 21.8 m²/ha coverage, the Station I and II were
just covered by N. fruticans with 289.2 and 49.3 m²/ha coverage respectively. The
not be found wide differences. The Station I and II which were only dominated by N.
fruticans had one of N. fruticans frequency level, while Station III which was just found S.
caseolaris had one of S. caseolaris frequency level. The Station IV, V and VI which were
found S. caseolaris and N. fruticans had S. caseolaris frequency level to be 1, 0.7, and 1
respectively, and N. fruticans frequency level to be 0.7, 1, and 1 respectively. Besides, the
highest Important Value (IV) of S. caseolaris was found in Station III with values 300,
whereas the highest IV of N. fruticans was found in Station I and II with values 300
respectively.
166.7
133.3 266.7
66.7
166.7 166.7 300.0 300.0
102.7
199.9
154.9
0.0
0.0 0.0
200.0
133.3 100.0
289.2
0.0
0.0 15.8 21.8 0.0 15.8 9.6 13.0 44.7
12.5 19.1 0.0
0.0 0.0
197.3
145.1 100.1
300.0
0 100 200 300
S.caselaris N.fruticans S.caselaris N.fruticans S.caselaris N.fruticans S.caselaris N.fruticans S.caselaris N.fruticans S.caselaris N.fruticans
Station I Station II Station III Station IV Station V Station VI
Mangrove species, Station
Density, Coverage, Important Value
[image:44.596.95.526.255.434.2]Density (stems/ha) Coverage (m²/ha) Important Value
Figure 5 The density, coverage and important value of mangroves in six different stations, the estuary of Sungai Kakap, 2006.
Set Net Fishery in the Estuary of Sungai Kakap
The samples of shrimps from six different set net were caught (eight replicates undertaken every week for two months, each replicate done in 15 minutes (06.00 – 08.00 a.m)). The number of shrimp species was five. From five only two marine species: “Udang Ambai” (local name) (Metapenaeus lysianassa) (Appendix 5), and “Udang
Bajang” (local name) (estimated scientific name is Metapenaeus monoceros (Appendix
5)),; and three freshwater species: “Udang Gantung” (local name) (estimated scientific name is Macrobrachium lanchesteri (Appendix 5)), “Udang Bulan” (local name)
(estimated scientific name is Exopalaemon styliferus (Appendix 5)), and “Udang Galah
(local name) (estimated scientific name is Macrobrachium rosenbergii (Appendix 5)).
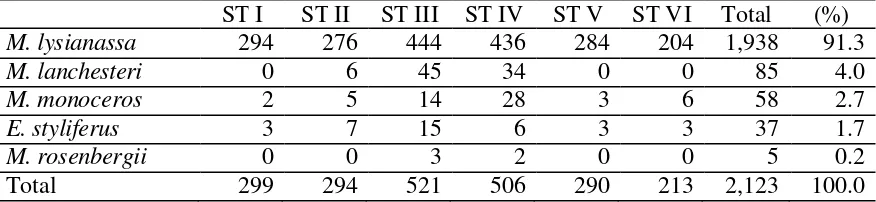
The dominant caught was M. lysianassa (91%), followed by M. lanchesteri (4%) and
other shrimps (M. monoceros, E. styliferus and M. rosenbergii) (5%). Table 5
20 Station III and IV (five species), followed by Station II (four species), and then Station I, V, and VI (three species).
Table 5 Share of species to total shrimp abundance in six different stations (ST), the estuary of Sungai Kakap, 2006 (individual)
ST I ST II ST III ST IV ST V ST VI Total (%)
M. lysianassa 294 276 444 436 284 204 1,938 91.3
M. lanchesteri 0 6 45 34 0 0 85 4.0
M. monoceros 2 5 14 28 3 6 58 2.7
E. styliferus 3 7 15 6 3 3 37 1.7
M. rosenbergii 0 0 3 2 0 0 5 0.2
Total 299 294 521 506 290 213 2,123 100.0
The total shrimp distribution over all samplings (N = 48) was 44±3 shrimps per set net
(
x±SE)
(Table 6) with confidence limit 44±5 shrimps per set net (x±(z(df,95%) ×S.E.))or (x±(1.96×SE)) (Appendix 6). The highest distribution mean of shrimp numbers
among stations (N=8) was found in Station III (65±4 shrimps per set net), followed by Station IV (63±5 shrimps per set), with confidence limit 65±9 shrimps per set net and 63±12 shrimps per set respectively
(
x±(
t(df,95%)×SE)
)
.Table 6 Distribution mean
(
x±SE)
of individual shrimp numbers per set net in sixdifferent stations, the estuary of Sungai Kakap, 2006
No Species I II Stations (individual) III IV V VI Total
1 M. lysianassa 37±4 35±3 56±3 55±3 36±3 26±3 40±2
2 M. monoceros 0±0 1±0 2±1 4±1 0±0 1±0 1±0
3 M. lanchesteri - 1±0 6±1 4±1 - - 2±0
4 E. styliferus 0±0 1±1 2±1 1±0 0±0 0±0 1±0
5 M. rosenbergii - - 0±0 0±0 - - 0±0
Total 37±5 37±4 65±4 63±5 36±3 27±3 44±3
Table 6 shows that the distribution mean of M. lysianassa numbers over all
samplings (N = 48) was 40±2 shrimps per set net with confidence limit 40±4 shrimps per set net (Appendix 6). The highest distribution mean of M. lysianassa numbers among
stations (N=8) was found in Station III (56±3 shrimps per set net) with confidence limit 56±6 shrimps per set net, whereas the lowest distribution mean of M. lysianassa numbers
[image:45.596.88.526.178.279.2]monoceros numbers among stations (N=8) was found in the Station IV (4±1 shrimps per
set net), whereas the lowest distribution mean was occurred in the Station I. In addition, the highest distribution mean of E. styliferus numbers among stations (N=8) was found in
Station III (2±1 shrimps per set net), and the lowest density was happened in three stations, namely: Station I, Station V, and Station VI. The highest distribution mean of both M.
lanchesteri and M. rosenbergii numbers among stations (N=8) were found in Station III,
while in Station I, V, and VI were not found these shrimps.
According to local fishermen M. lysianassa as the major caught was commonly
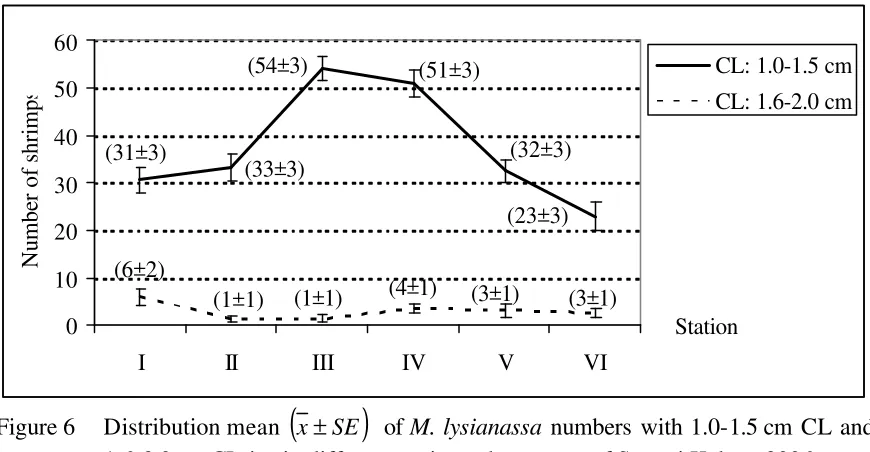
divided into two parts of market products including small shrimps “Halus” (local name) and large shrimps “Kasar” (local name), with carapace length (CL) approximately = 1.5 cm and > 1.5 cm respectively. Figure 6 shows that the highest distribution mean of M.
lysianassa numbers with 1.0-1.5 cm CL was found in Station III (54±3 shrimps per set net
with), and the highest distribution mean with 1.6-2.0 cm CL was found in Station I (6±2 shrimps per set net).
(54±3)
(31±3)
(33±3)
(51±3)
(32±3)
(23±3)
(6±2)
(1±1) (1±1) (4±1) (3±1) (3±1)
0 10 20 30 40 50 60
I II III IV V VI
Station
Number of shrimps
CL: 1.0-1.5 cm CL: 1.6-2.0 cm
Figure 6 Distribution mean
(
x±SE)
of M. lysianassa numbers with 1.0-1.5 cm CL and1.6-2.0 cm CL in six different stations, the estuary of Sungai Kakap, 2006.
Relationship between Mangrove and Shrimp Catches
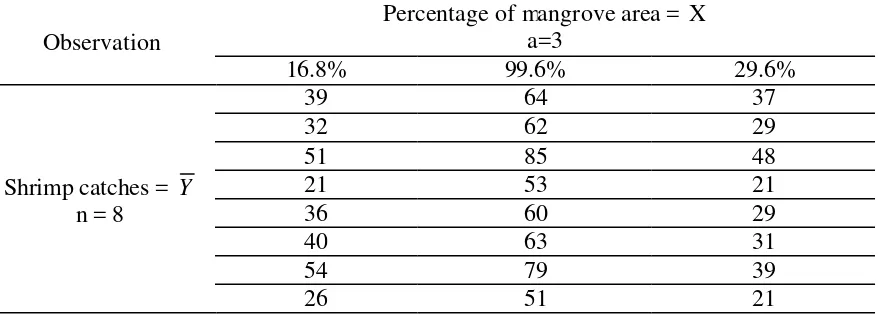
Relationship between different mangrove conditions (X variable) and shrimp catches (Y variable) was computed by regression with more than one value of Y (shrimp catch number) for each value of X (percentage of mangrove area (S. caseolaris and N. fruticans)
[image:46.596.87.522.375.601.2]22 Table 7 A design of regression with more than value of Y (shrimp catch numbers) per
value of X (different mangrove areas) with equal sample sizes
Observation
Percentage of mangrove area = X a=3
16.8% 99.6% 29.6%
Shrimp catches = Y
n = 8
39 64 37
32 62 29
51 85 48
21 53 21
36 60 29
40 63 31
54 79 39
26 51 21
Based on regression analysis results could be described regression lines and linear regression equations. Figure 7 shows that the positive correlation between percentage of mangrove area (S. caseolaris and N. fruticans) and individual number of shrimp catch had
a linear regression equation Y=26.0+0.4X (R²=0.61). It indicates statistically that each one unit adding of mangrove covering can add 0.4 units of shrimp catch numbers. Significant positive correlations also were shown by the relationship between percentage of mangrove area and individual number of M. lysianassa (1.0-1.5 cm CL) with a linear regression
equation Y=23.5+0.3X (R²=0.62) (Figure 8).
Figure 7 The regression line and equation between percentage of mangrove area (S.
caseolaris and N. fruticans) and individual number of shrimp catches.
0 30 60 90
0 20 40 60 80 100
Percentage of Mangrove Area
Individual Numbers
of Shrimps
Linear (Individual Number of Shrimps vs Percentage of Mangrove Area) 00001 . 0
61 . 0
4 . 0 0 . 26
2 ^
< =
+ =
P R
[image:47.596.92.531.125.282.2]Figure 8 The regression line and equation between percentage of mangrove area (S.
caseolaris and N. fruticans) and individual number of M. lysianassa (1.0-1.5
cm CL).
Figure 9 shows that the positive correlation between density of S. caseolaris and
individual number of shrimp catches had a linear regression equation Y=9.5+0.2X (R²=0.41). The positive correlations also were shown by the relationship between density
of S. caseolaris and individual number of M. lysianassa (1.0-1.5 cm CL) with a linear
regression equation Y=11.2+0.2X (R²=0.40) (Figure 10). Whereas the relationship between density of N.fruticans and individual number of M. lysianassa (1.0-1.5 cm CL)
showed the negative correlation with a linear regression equation Y=56.0-0.2X (R²=0.55) (Figure 11).
Figure 9 The regression line and equation between dens ity of S. caseolaris and
individual number of shrimp catches.
0 30 60 90
0 20 40 60 80 100
Percentage of Mangrove Area
Individual Number of
M.lysianassa
(1.0-1.5 cm CL).
Linear (Individual Number of M.lysianassa (1.0-1.5 cm CL) vs Percentage of Mangrove Area)
00001 . 0 62 . 0 3 . 0 5 . 23 2 ^ < = + = P R X Y 0 20 40 60 80 100
0 50 100 150 200 250 300
Density of S.caselaris (stems/ha)
Number of Shrimps.
Linear (Individual Number of Shrimps vs Density of S.caseolaris)
[image:48.596.85.522.87.297.2] [image:48.596.81.525.497.679.2]24
Figure 10 The regression line and equation between density of S. caseolaris and
individual number of M. lysianassa (1.0-1.5 cm CL).
Figure 11 The regression line and equation between density of N.fruticans and individual
number of M. lysianassa (1.0-1.5 cm CL).
Figure 12 shows that the positive correlation between coverage of S. caseolaris and
individual number of shrimp catches had a linear regression equation Y=3.8X-11.6 (R²=0.51). The positive correlations also were shown by the relationship between coverage of S. caseolaris and individual number of M. lysianassa (1.0-1.5 cm CL) with a
linear regression equation Y=3.0X-6.7 (R²=0.54) (Figure 13). While the relationship between coverage of N.fruticans and individual number of M. lysianassa