ISSN 1818-4952
© IDOSI Publications, 2014
DOI: 10.5829/idosi.wasj.2014.29.10.1581
Corresponding Author: S. Misha, Faculty of Mechanical Engineering, Universiti Teknikal Malaysia Melaka, Hang Tuah Jaya, 76100 Durian Tunggal, Melaka, Malaysia. Tel.: +60 6 2346712,
Comparison Between 2D and 3D Simulations
of a Tray Dryer System Using CFD Software
S. Misha, S. Mat, M.H. Ruslan, K. Sopian and E. Salleh
1,2 1 1 1 1
Solar Energy Research Institute, Universiti Kebangsaan Malaysia, 1
43600 Bangi Selangor, Malaysia
Faculty of Mechanical Engineering, Universiti Teknikal Malaysia Melaka, 2
Hang Tuah Jaya, 76100 Durian Tunggal, Melaka, Malaysia
Submitted: Dec 18, 2013; Accepted: Jan 25, 2014; Published:Jan 28, 2014
Abstract: The tray dryer is the most extensively used drying system because of its simple and economic design. The drawback of this dryer is the non-uniformity in the final moisture content of the product. This research aims to predict the temperature and velocity profile in the drying chamber using computational fluid dynamics simulations. Two 3D designs of drying chambers (cases 1 and 2) were studied. Both designs have the same dimensions, except for the geometry of the inlet and outlet boundary conditions. The simulation was performed in 3D, but the analysis was carried out in a 2D plane. Another 2D simulation (case 3) was carried out to compare the results with those of the 3D simulation. The design in case 2 can be represented in a 2D simulation, whereas the design in case 1 must be represented in a 3D simulation. The 3D simulation can be simplified into a 2D simulation if the geometry and boundary conditions in the 3D simulation are the same as those in the 2D simulation at any position of the plane parallel to the 2D drawing. The 2D simulation is simple and saves time in terms of design, meshing and iteration processes for achieving convergent solutions.
Key words: Drying simulation Tray dryer Uniform drying
INTRODUCTION momentum and energy can be solved using The tray dryer is widely used in a variety of and pressure profiles in the drying chamber. CFD is applications because of its simple design and considered an integral part of engineering design and capacity to dry a large number of products. However, the analysis because it can predict the performance of new biggest drawback of the tray dryer is uneven drying designs.
caused by the poor airflow distribution in the drying Mathioulakiset al. [2] designed and constructed an chamber. Several designs and methods can be industrial batch-type tray dryer for drying fruits. CFD implemented to improve the performance of tray dryers; was used to simulate the air velocity and the pressure the improvements can enhance the quality of the dried profiles in the drying chamber. The result shows that a product and ensure uniform drying, as reported by Misha variation in final moisture content occurs in several
et al. [1]. trays. A comparison between the CFD simulation
validation between the measured data and the simulation improve the uniformity of temperature in the drying results by CFD shows that the standard k–e model is the chamber. A new shape and an additional baffle were most adequate turbulence model. found to be the most effective improvements. In both Mirade [4] used a two-dimensional CFD model with cases, the simulation results show very good agreement time-dependent boundary conditions to investigate the with the experimental data.
homogeneity of the distribution of the air velocity in an The present study aims to predict the drying industrial meat dryer for several low and high levels of the uniformity of the final moisture content of the product by ventilation cycle. All airflow simulations are consistent studying the temperature and velocity profile in the with the heterogeneity of drying usually observed in drying chamber using CFD simulation. The moisture practice. The product is represented by a solid rectangular content is determined by using load cell to get the object. Chr. Lamnatou et al. [5] constructed and difference between final and initial mass of the product. investigated a numerical model of heat and mass transfer Bakhshipour et al. [9] used a machine vision system during convective drying of a porous body using the integrated with the neural networks to predict the finite volume method. The aspect ratio of the drying plate moisture content of raisin. CFD simulation in 2D and 3D and the flow separation affect the flow field and heat/mass is carried out. The comparison of the simulation result will transfer coefficients. The increase in the contact surfaces show which 3D design can be represented by 2D between the air and porous body also contributes to the simulation. CFD has been extensively used in the food improvement of drying behavior. Some products can be industry to investigate the airflow pattern in drying treated as solid (non-porous) material. However, most chambers [10], [11]. Uniform airflow distribution in a products are represented by porous media. Overall drying chamber is very important because it strongly velocities in the drying chamber are lower when porous influences dryer efficiency and the homogeneity of the products are used than when solid products are utilized products being dried [4]. The use of a desiccant material because some of the hot air stream pass through porous in drying applications has several advantages, including
products [6]. the improvement in the uniformity of dried products [12].
Amanlou and Zomorodian [7] studied a new cabinet
dryer with a side-mounted plenum chamber for fruit METHODS AND SIMULATION
drying. Experimental work and simulations by CFD were
carried out to achieve uniform drying. The developed Design of the Drying Chamber: The basic design of the dryer produces uniform airflow and temperature drying chamber is shown in Figure 1. The wall of the dryer distribution in the drying chamber. Jacek Smolka et al. [8] system was constructed using 6 cm thick hollow studied a numerical model of a drying oven using CFD polycarbonate with a hollow space in the middle simulation. Several new configurations were simulated to measuring 4 cm deep. The drying chamber dimension is
( ) ( i) t k b M k
approximately 2 m x 3 m x 1.7 m (width, length and height, respectively). The dryer system consists of seven levels of tray systems, each of which has three separate trays. The thickness of the products in each tray is 6 cm. The velocity and temperature distribution were analyzed to predict the drying uniformity in the drying chamber.
Basic Governing Equations for Designing the Tray Dryer: The mass, momentum and energy conservation result in the continuity, Navier–Stokes and energy equations, respectively [13]. The turbulent model is used in this CFD simulation. The turbulent kinetic energy, k and its rate of dissipation, , are calculated from the following transport equations [14]:
(1)
(2)
Convective heat and mass transfer modeling in the k– models is given by the following equation:
(3) Product trays are assumed to be porous media for
airflow. Porous media are modeled by adding a momentum source term to the standard fluid flow equations. The source term is composed of two parts: a viscous loss term and an inertial loss term.
(4)
Simulation Details: The numerical finite volume method, as used in Fluent 14.0, has been used to solve equations and to build a numerical model based on an unstructured 3D mesh by tetrahedral cells. The pattern of air stream in the drying chamber is important and because variable
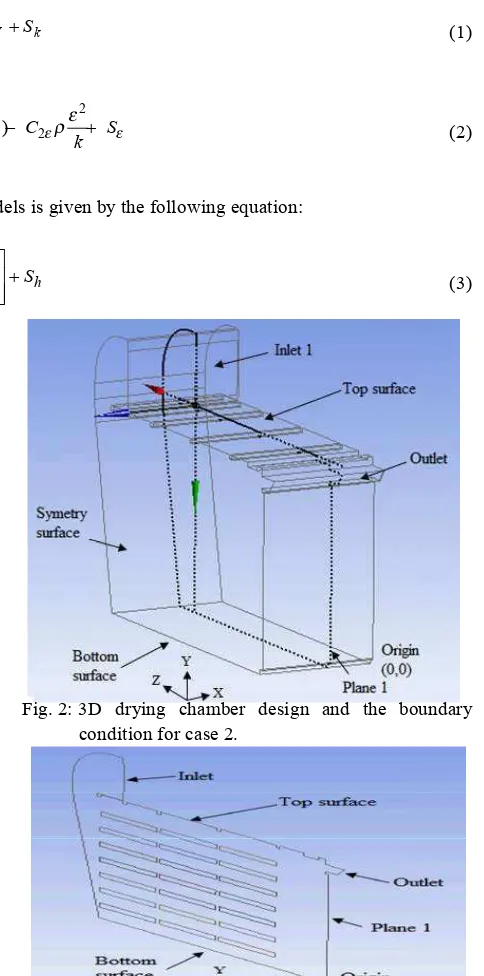
condition was absent in the current study, the simulation Fig. 2: 3D drying chamber design and the boundary was carried out in a steady state condition. In case 1, condition for case 2.
plane 1 was selected (Figure 1) to study and analyze the velocity and temperature in the drying chamber. Plane 1 is located in the center of the fans. Three simulations were carried out to predict the temperature and velocity distributions in the drying chamber using 2D and 3D CFD simulations. The simulations in cases 1 and 2 were performed in 3D but with different inlet and outlet conditions. In case 2, the inlet area is rectangular, whereas the outlet area is found along the X-axis (Figure 2). The simulation in case 3 was performed in 2D
(c) Case 3
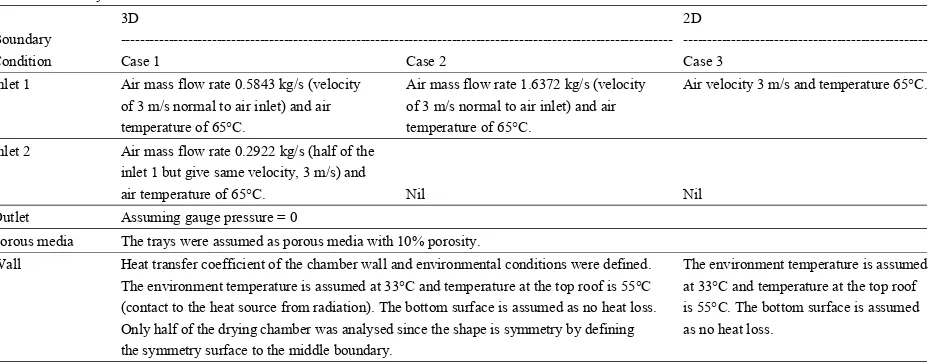
Table 1: Boundary condition for each case
3D 2D
Boundary ---
---Condition Case 1 Case 2 Case 3
Inlet 1 Air mass flow rate 0.5843 kg/s (velocity Air mass flow rate 1.6372 kg/s (velocity Air velocity 3 m/s and temperature 65°C. of 3 m/s normal to air inlet) and air of 3 m/s normal to air inlet) and air
temperature of 65°C. temperature of 65°C.
Inlet 2 Air mass flow rate 0.2922 kg/s (half of the inlet 1 but give same velocity, 3 m/s) and
air temperature of 65°C. Nil Nil
Outlet Assuming gauge pressure = 0
Porous media The trays were assumed as porous media with 10% porosity.
Wall Heat transfer coefficient of the chamber wall and environmental conditions were defined. The environment temperature is assumed The environment temperature is assumed at 33°C and temperature at the top roof is 55°C at 33°C and temperature at the top roof
(contact to the heat source from radiation). The bottom surface is assumed as no heat loss. is 55°C. The bottom surface is assumed Only half of the drying chamber was analysed since the shape is symmetry by defining as no heat loss.
the symmetry surface to the middle boundary.
conditions for each case is defined in Table 1. The dryer Therefore, all designs can be assumed to have is designed for any agricultural product; however, in this successfully achieved uniform air temperature in the simulation, the properties of chipped kenaf core are drying chamber.
applied to the product as an example. The size or In drying applications, the temperature, velocity and dimension of the chipped kenaf core was reported by humidity of the drying air significantly affect the drying Mishaet al. [15]. process. In this simulation study, only the temperature
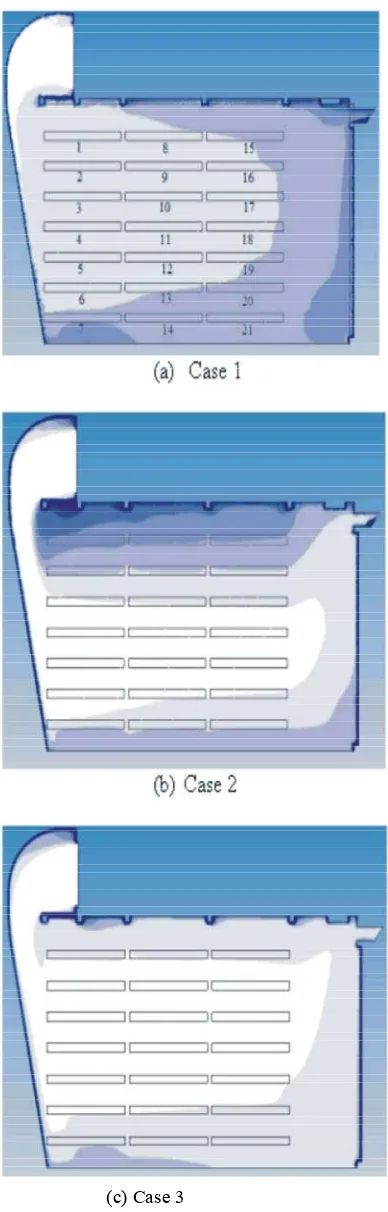
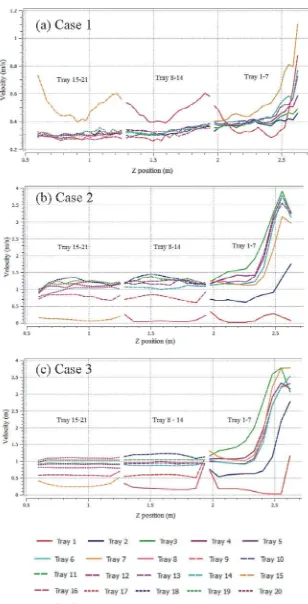
RESULT AND DISCUSSION equation utilized in the analysis does not involve humidity. Humidity analysis will be done in future In the 3D simulations (cases 1 and 2), plane 1 was experimental work. The air velocity above the trays is very selected to study the airflow distribution because its important in removing moisture from the products. The air geometry is identical to that in the 2D simulation (case 3). velocity profile at 2.5 cm above each tray of plane 1 is In case 2, cutting at any point on the YZ plane results shown in Figure 5. Generally, the average air velocities in in the same geometry as that in the 2D simulation. trays 1 to 7 are higher than those in the other trays By contrast, cutting at any other point on the YZ plane in because they are positioned very close to the inlet. case 1 results in a different geometry; that is, the inlet In case 1, the air velocities range from 0.26 m/s to 1.10 m/s, dimension is small and an inlet or outlet boundary is with an average velocity of approximately 0.35 m/s. absent in some planes. This result is attributed to the inlet In cases 2 and 3, the air velocities range from 0 m/s to 3.85 boundary being circular and to the outlet boundary being m/s, with an average velocity of approximately 1.10 m/s. absent along the X-axis. As the geometry in plane 1 The velocity values for each tray in cases 2 and 3 are not (cases 1 and 2) and that in the 2D simulation are exactly identical, but they follow the same pattern. The average the same, comparisons can easily be done for each case. velocities for each line (cases 2 and 3) are shown in The numbers of trays from 1 to 21 are indicated in Figure Table 2. The maximum difference is 0.27 m/s, the minimum
4 (case 1). difference is 0.01 m/s and the average difference is 0.18
The temperature distribution in the drying chamber is m/s.
Table 2: Average velocity above the tray at plane 1
Average velocity above the tray (m/s)
--- Difference Tray number Case 2 Case 3 (m/s)
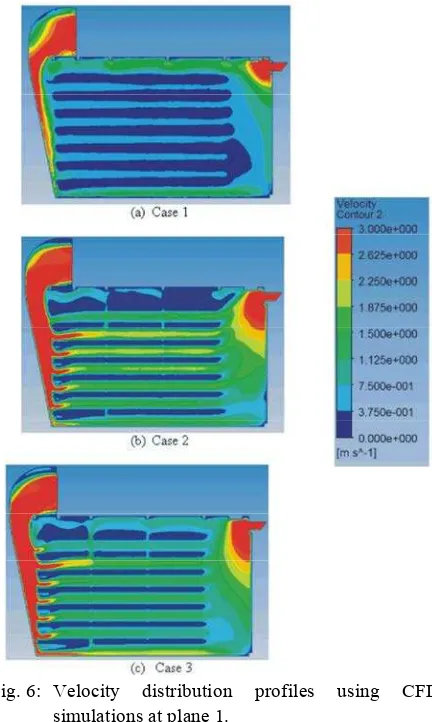
1 0.13 0.28 0.15 after collision with the curved wall; the air is distributed to all levels, including the top tray. In cases 2 and 3, the air velocity is high (greater than 2.6 m/s) after collision with the curved wall; the air is distributed mostly to the trays at the lower levels. Therefore, the trays at the first and second levels have lower velocity than the other trays in cases 2 and 3. The details of the velocity distribution profile for each case are shown in Figure 6.
The result of case 1 differs from the results of cases 2 and 3. Although the air velocity at the inlet of the selected plane is the same (3 m/s), the inlet geometry in case 1 is not the same when the YZ plane is cut at different points. In case 2, the same geometry, including that of the inlet, is achieved when the YZ plane is cut at any point. Therefore, the 3D simulation in case 2 can be represented by a 2D simulation as in case 3. Simulation in 3D is very complex and time consuming in terms of design, meshing and iteration processes for achieving convergent solutions. The time required to process the results in cases 1 and 2 is approximately two hours, whereas that in case 3, which used 2D simulation, is only three minutes. If possible, 2D simulation is thus
Fig. 6: Velocity distribution profiles using CFD simulations at plane 1.
preferable. However, not all 3D problems can be simplified into 2D simulations. In this study, presenting the design of the drying chamber in 2D, as in case 1, is impossible because the inlet geometry is not the same when the YZ plane is cut at any point.
Basically, a problem can be represented in 2D if the shape or geometry and boundary condition of the 3D problem are the same with the 2D drawing at any point of the plane parallel to the 2D drawing. Otherwise, the results of the 2D simulation may not be consistent with the results of the 3D simulation. The result of the 3D simulation in case 2 is different from the result of the 2D simulation in case 3 because on the one hand, the actual airflow streamline in 3D moves not only across plane 1 but also over other positions. On the other hand, the airflow streamline in 2D only moves across one plane; therefore, the pattern is very linear.
mesh-independent solution and to obtain accurate results. In G generation of turbulent kinetic energy due to future experimental work, several positions in the drying
chamber should be installed with temperature, velocity and humidity sensors to validate the simulation data.
CONCLUSION
Good airflow distribution in a drying chamber can improve drying uniformity. CFD simulation is very useful in predicting the air velocity and temperature profiles in a drying chamber. Simulation in 3D provides superior results because it represents the actual problem, but it is expensive and time consuming. Therefore, 2D simulation may be carried out in some cases to solve the simulation work. Simulation in 3D can be simplified into simulation in 2D if the shape or geometry and boundary condition in 3D are the same as that in 2D at any point of the plane parallel to the 2D drawing. In this study, the 3D drying chamber in case 2 could be presented in 2D. The results are not exactly the same, but the average velocity and the velocity and temperature ranges are consistent. In case 1, the simulation was carried out in 3D. Simulation in 3D is complex and time consuming in terms of design, meshing and iteration processes for achieving convergent solutions. Additional baffles may be used to distribute the airflow evenly to each tray level. Uniform drying and increase in drying rate will improve the quality of the dried product. In the future, the experimental work will be carried out for agricultural drying to validate the simulation data.
ACKNOWLEDGEMENTS
The authors would like to thank the Solar Energy Research Institute, Universiti Kebangsaan Malaysia and Universiti Teknikal Malaysia Melaka for sponsoring this work.
Nomenclature:
C, D Prescribed matrices C , C0 1 empirical coefficients Cij prescribed matrices
Gk generation of turbulent kinetic energy due to the mean velocity gradients
b
buoyancy
YM contribution of the fluctuating dilatation in compressible turbulence to the overall ( )ij eff deviatoric stress tensor
p pressure
Prt Prandtl number
T temperature
cp specific heat capacity at constant pressure u velocity magnitude in xdirection
t time
S , S ,Sk h user-defined source terms source term forith momentum dissipation rate equation
REFERENCES
1. Misha, S., S. Mat, M.H. Ruslan, K. Sopian and E. Salleh, 2013. Review on the application of a tray dryer system for agricultural products. World Applied Sciences Journal, 22(3): 424-433.
2. Mathioulakis, E., V.T. Karathanos and V.G. Belessiotis, 1998. Simulation of air movement in a dryer by computational fluid dynamics: Application for the drying of fruits.Journal of Food Engineering, 36(2): 183-200.
3. Margaris, D.P. and A.G. Ghiaus, 2006. Dried product quality improvement by air flow manipulation in tray dryers.Journal of Food Engineering, 75(4): 542-550. 4. Mirade, P.S., 2003. Prediction of the air velocity field
in modern meat dryers using unsteady computational fluid dynamics (CFD) models.Journal of Food Engineering, 60(1): 41-48.
5. Lamnatou, C., E. Papanicolaou, V. Belessiotis and N. Kyriakis, 2010. Finite-volume modelling of heat and mass transfer during convective drying of porous bodies - Non-conjugate and conjugate formulations involving the aerodynamic effects. Renewable Energy, 35(7): 1391-1402.
6. Misha, S., S. Mat, M.H. Ruslan, K. Sopian and E. Salleh, 2013. Comparison of CFD simulation on tray dryer system between porous and solid product. In the Proceedings of the 7 WSEAS Internationalth
7. Amanlou, Y. and A. Zomorodian, 2010. Applying 12. Misha, S., S. Mat, M. Ruslan and K. Sopian, 2012. CFD for designing a new fruit cabinet dryer.Journal Review of solid/liquid desiccant in the drying of Food Engineering, 101(1): 8-15. applications and its regeneration methods. 8. Smolka, J., A.J. Nowak and D. Rybarz, 2010. Improved Renewable and Sustainable Energy Reviews,
3-D temperature uniformity in a laboratory drying 16(7): 4686-4707.
oven based on experimentally validated CFD 13. Norton, T. and D.W. Sun, 2006. Computational fluid computations. Journal of Food Engineering, dynamics (CFD) - an effective and efficient design
97(3): 373-383. and analysis tool for the food industry: A
9. Bakhshipour, A., A. Jafari and A. Zomorodian, 2012. review.Trends in Food Science & Technology, Vision based features in moisture content 17(11): 600-620.
measurement during raisin production. World 14. Yongson, O., I.A. Badruddin, Z.A. Zainal and Applied Sciences Journal, 17(7): 860-869. P.A. Aswatha Narayana, 2007. Airflow analysis in 10. Verboven, P., N. Scheerlinck, J. De Baerdemaeker and an air conditioning room. Building Environment,
B.M. Nicola, 2000. Computational fuid dynamics 42(3): 1531-1537.
modelling and validation of the temperature 15. Misha, S., S. Mat, M.H. Ruslan, K. Sopian and distribution in a forced convection oven.Journal of E. Salleh, 2013. The effect of drying air temperature Food Engineering, 43: 61-73. and humidity on the drying kinetic of kenaf 11. Scott, G. and P. Richardson, 1997. The application of core.Applied Mechanics and Materials, 315: 710-714.