UNIVERSITI TEKNIKAL MALAYSIA MELAKA
USER INTERFACE ASSESSMENT OF CAR DASHBOARDS
This report submitted in accordance with requirement of the Universiti Teknikal
Malaysia Melaka (UTeM) for the Bachelor Degree of Manufacturing Engineering
(Manufacturing Management) (Hons.)
by
SHAHZIZI BIN MUSTAFA
B051010062
881219-10-5441
FACULTY OF MANUFACTURING ENGINEERING
I hereby, declared this report entitled
“User Interface Assessment of Car Dashboards”
is the results of my own research except as cited in references.
Signature : ……….
Author‟s Name : Shahzizi Bin Mustafa Date : 28/06/2013
APPROVAL
This report is submitted to the Faculty of Manufacturing Engineering of UTeM as a partial fulfillment of the requirements for the degree of Bachelor of Manufacturing Engineering (Management) (Hons.). The supervisory is as follow:
……….
ABSTRAK
Hari ini kebanyakan pengguna kereta bukan hanya menilai kereta itu pada luaran tetapi
juga dalaman kereta terutama papan pemuka pada timbunan pusat dimana fungsinya
terdiri daripada radio, penyelaras penyaman udara dan juga reka bentuk yang terdapat
pada timbunan pusat tersebut. Mengikut kajian yang terdahulu kebanyakan pengkaji
akan mengkaji pada timbunan pusat secara keseluruhan terutama pada bahagian
pemandu antaranya adalah meter kelajuan, reka bentuk pada timbunan pusat secara
keseluruhan dan juga paparan panel kereta termasuk saiz tulisan dan simbol dengan
menggunakan kejuruteraan kansei. Kebanyakan pengguna kereta akan meluahkan
perasaaan dan emosi mereka pada gerak-geri badan, wajah dan juga percakapan ketika
pengguna mencuba samada pada kereta baru atau yang lama. Maka kajian yang
dijalankan dalam projek ini adalah lebih fokus dalam menilai perasaan dan emosi
pengguna kereta dari segmen-B. Perkataan kansei di pilih menjurus kebawah dan
analisis menggunakan separa kurang kuasa. PLS adalah untuk mengenal pasti hubungan
diantara tindak balas dan ramalan. Untuk mencapai pemilihan tersebut, kriteria-kriteria
penting dan ramalan yang sesuai dengan perkataan mempunyai dua peringkat untuk
mencarinya. Keputusan ditunjjukkan dimana nilai pekali terhasil dan terdapat dua nilai
dalam bentuk positif dan negatif untuk setiap ramalan. Nilai pekali ialah dapat
ditentukan dimana ramalan akan dipilih dalam jenis perkataan kansei yang terbaik.
Pembelajaran ini juga menunjukkan data untuk setiap perkataan kansei dimana ramalan
hampir sama dan hanya dibezakan melalui nilai. Tambahan lagi ramalan jua
menunjukkan semua ramalan boleh di kenal pasti tetapi mengikut perasaan sendiri.
Kesimpulannya perkataan kansei sebenarnya boleh ditentukan diri sendiri, ini kerana
ramalan dalam pembelajaran ini tidak menunjukkan ketepatan perkataan kansei yang
sesuai dan hampir sama untuk setiap ramalan dan pengguna boleh memilih perkataan
ABSTRACT
Today most of car users not only evaluate the car on the exterior but also the interior of
the car especially on the dashboard center stack functions which consists of radio, air
conditioning coordinator and also there are designs on the center stack. According to
previous studies most researchers will study the whole center stack, especially at the
drivers of which are speed meter, the design of the center stack as a whole and also the
display panel including a car and a symbol font using Kansei engineering. Most car
users will express their passions and emotions in body language, facial and conversation
when users try either on new or old car. This study was carried out in the project is more
focused on assessing the feelings and emotions of the users of B-segment cars. A few
selected words called Kansei words were narrowed down and analyzed using Partial
Least Squares (PLS). The PLS is to identify the correlation between the response and
predictors. To achieve that is choose a few main attributes and predictors suitable with
the kansei words and the results show that have a value coeffiecient in positive and
negative values for each predictors. The values coeffiecient is for to determined which
one the best predictors to desite what kind of for kansei words. This study shows the
data for each kansei word which is the predictors almost the same and only the values
are different between each others. In additions, the predictors also show for all the
predictors can be identified the kansei word but followed own feeling. As conclusion the
kansei word actually can be determined based on feeling, this is because the predictors
in this study almost the same and the users can be choosing the kansei word followed by
TABLE OF CONTENT
Abstrak i
Abstract ii
Table of Content iii
List of Table vii
List of Figure viii
CHAPTER 1: INTRODUCTION 1
1.1Background 1
1.2Problem Statement 2
1.3Objective of the study 4
1.4Scope of the study 4
CHAPTER 2: LITERATURE REVIEW 5
2.1 User Interface Design (UI) 5
2.2 Problems Related to User Interface Design 6
2.2.1 Human Limitations 7
2.3 Usability and User Experience 9
2.3.1 Comparison Between Usability and User Experience 9
2.4 Interface Development 12
2.4.1 Usability Testing 13
2.4.2 Characteristic of Usability Testing 13
2.5 Automotive (dashboard) Interface Design 14
2.6 Affective Design / Kansei Engineering 15
2.6.1 Introduction 15
2.6.2 Kansei Engineering (KE) 17
2.6.3 The Method Used of Kansei Engineering 18
2.6.3.1 The Types are briefly described as the following 18
2.6.5 Application in Kansei Engineering (KE) 24
2.7 History of Semantic Differential 25
2.7.1 Statistical Method and Tools Used in Kansei Engineering (KE) 26
CHAPTER 3: METHODOLOGY 27
3.1 Introduction 27
3.2 Planning of The Study 27
3.2.1 Primary Data Collection 28
3.2.2 Secondary Data Collection 29
3.3 Detail of Primary Information Collection 29
3.3.2 Kansei Word 31
3.3.3 Surveys Method 32
3.3.4 User Sample Size 32
3.3.5 Semantic Differential Tools 33
3.3.6 Minitab Software 33
3.4 Detail of Secondary Information Collection 33
CHAPTER 4: RESULT & DISCUSSION 35
4.1 Demographic Background
4.1.1 Gender 35
4.1.2 The age distribution 37
4.1.3 The favorite cars 38
4.2 Narrowing down the Kansei words 40
4.3 Car Center Stack Design Elements 41
4.4.7 Simple 64
4.4.8 Formal 68
4.5 The Kansei words with predictors 71
4.6 Average Ratings for Car Center Stack Designs 72
CHAPTER 5: CONCLUSION 76
5.1 Conclusion 76
5.2 Recommendation 78
REFERENCE 79
LIST OF TABLE
3.1 List of B-segments car 30
3.2 Type of kansei word good and bad use in this study 31
4.1 The information form questionnaire 36
4.2 Age Distribution 37
4.3 The favourite cars of the respondents 38
4.4 The total kansei word use in questionnaire (before selected) 40
4.5 The variable design element with description 42
4.6 Positive values with predictors for style 44
4.7 Negative values with predictors for style 45
4.8 Positive values with predictors for exclusive 48
4.9 Negative values with predictors for exclusive 49
4.10 Positive values with predictors for elegant 51
4.11 Negative values with predictors for elegant 52
4.12 Positive values with predictors for high-technology 55
4.14 Positive values with predictors for sporty 59
4.15 Negative values with predictors for style 59
4.16 Positive values with predictors for functional 62
4.17 Negative values with predictors for functional 62
4.18 Positive values with predictors for simple 65
4.19 Negative values with predictors for simple 66
4.20 Positive values with predictors for formal 68
4.21 Negative values with predictors for formal 69
4.22 Kansei word with their attributes and predictors 71
4.23 Kansei word with their attributes and predictors 71
LIST OF FIGURE
2.1 Coffee machine interface (Darnell, 2010) 6
2.2 Usability as parts of the user experience: (Source : Neospot Website) 10
2.3 Framework of usability (ISO-9241-11,1998) 11
2.4 The process of kansei (Lokman & Nagamachi, 2009) 16
2.5 Kansei Gateways (Lokman & Nagamachi, 2009) 16
2.6 The kansei engineering system (Nagamachi, 1995) 18
2.7 The process tree of KE type 1 (Nagamachi, 2001) 19
2.8 The principal KE system of type II (adapted from Nagamachi, 1997)) 20
2.9 The principal KES Backward (adapted from Nagamachi , 1997) 21
2.10 Hybrid Kansei Engineering System ( adapt from Nagamachi, 1995) 21
2.11 A proposal how IKDS could appear (adapted of Nishino et al., 1999) 23
3.1 The flow-chart of primary information 28
3.2 The flow chart of second information 29
3.3 Several center stack a Malaysia (Source: Perodua& Nissan website) 30
4.2 Non-national compact sedan (source: www.cbt.com.my) 39
4.3 Result from Minitab software (Style) 43
4.4 Examples the color three schemes in style (Source :
www.dixietoyota.com )
45
4.5 Level predictors (style) 46
4.6 Result from Minitab software (Exclusive) 47
4.7 Level predictors (exclusive) 50
4.8 Result from Minitab software (Elegant) 51
4.9 Level predictors (elegant) 53
4.10 Value affective designs from researcher 54
4.11 Result from Minitab software (high technology) 55
4.12 Level predictors (high technology) 57
4.13 Result from Minitab software (sporty) 58
4.14 Level predictors (sporty) 61
4.15 Result from Minitab software (Functional) 61
4.16 The Level predictors (functional) 64
4.17 Result from Minitab software (simple) 65
4.18 Level predictors (simple) 67
4.19 Result from Minitab software (formal) 68
4.20 Level predictors (simple) 70
CHAPTER 1
INTRODUCTION
1.1Background
Interface is an interaction between man and machine. Hence this interaction, as
indicated by the different combinations of users. This interface also actually occurs
anywhere where there is a human machine and the machine there interfaces. Between
user interactions it is considered that the application is used as electronic devices, home
equipment, and others. In addition to the display this interface the user can find out
whether it works or easy to use. Actually interface actually has long been studied; its
purpose is to recognize how the interaction is occurring. So at these time studies will be
performed on the vehicle interface of the car, because the car is very important in human
life to move the desired place then the interaction between machines or display will be
more frequently used. Among studies that examine the car‟s interior is like the emotions and feelings while in a car, and that there is also a panel where humans regularly
Researcher which is Jindo and Kiyomi (1997) have studied in connection with the
car interior speedometer symbols where they study about whether the user comfortable.
Their study of the review is the design layout. In addition the study the researchers
found several important elements for evaluation. The scale type, lettering, shape
indicator and also starting point of evaluation test being run by Jindo and Kiyomi
(1997). Study of this interface makes car manufacturers especially from Japan like
Mazda, Nissan; Honda also has applications in the study of interface (Schutte, 2002).
Besides, researched done as well as examinations of car interior led project which
distinguish between Europe and Japan Kansei in 1998 (Schutte, 2002).
Hence this study has shown that the study of this interface has been done since time
immemorial and it is very important especially on car manufacturers to ensure that
products produced are followed according to consumer tastes and ages.
1.2Problem Statement
Now the variety of car brands in Malaysia includes the Proton, Toyota, Produa,
Nissan and not forgetting the prestigious brands such as Mercedes, Volkswagen and
also BMW. car also have a variety segment of the segment A to MPV levels, at the
present time users prefer to use a car from the segment B, as most car manufacturers
produce cars with more stylish and technology to achieve the youthful features while
users use it. At this time most of the customers is not only focus on the external
design of cars, but consumers are more focused on interior design including the
center stack. center stack has a variety of beautiful designs in order to attract further
users find the center stack provides a more comfortable feeling to the user when it is
in the car. Besides the functions contained in the center stack also need to understand
how to use them to prevent users experience difficulties when using it and cause
In a previous study shows many researchers made some researches about the
interior part of car. From their research, obviously mentioned the interior part of car
is most important in car production and also for clients need. Unfortunately, most of
clients are still not satisfied with the results of the existing designs in the market
now. Therefore a country of Japan has established rules or principles which they
respect or sense of touch is called Kansei. Kansei expression cannot be seen clearly
because the only known such as hearing, taste, feeling, and also environmental
conditions (Nagamachi, 2001).
For example, if a buyer wants to buy a car, they will feel the chemistry with the
car when are person are in the car and try to interact with the functions of the car,
especially in the center stack of the dashboard.
Hence this study was to determine the center stack which is more attractive to most
consumers, especially in Malaysia. However, the research is also the producer of the
center stack can produce more innovative and stylish according to consumer
preferences. By having this study the production of cars will also be more active and
competitive in the car market. if this study was not done in the growth in the car
market will become sluggish and can cause a downturn in the market is not buying
the car, but also the producer will suffer a loss in terms of car sales and thus produce
a car that is not liked by the users.
1.3Objective of the Study
The main objectives of this study are:
b) To relate the design preferences with affective design attributes.
1.4Scope of the Study
The study of this time will be focused on the B segment cars. B Segment cars are
popular among the young and the elderly drivers in Malaysia. This study would be
carried out using several methods such as semantic differential and Partial Least
Squares (PLS) method. Then by performing the method we can find the
characteristics found in each sample, and thus can determine the ideal characteristics
CHAPTER 2
LITERATURE REVIEW
The study of car interior design has been done by many researchers. Mostly researchers
in Japan, however the Europeans also have made plenty of research about the interior
design. Unfortunately there not make a complete research but focus on a certain
component such as a speedometer, a steering wheel, seats, switches and so on.
2.1User interface design (UI)
User interface is a communication that end-user can interact with a system. There is
a point in the system where in human being interact with the computer so that called it a
Human Computer Interaction (HCI). There are many areas covered by interface design
such a computer, hand phone, which focus on psychology, ergonomic, engineering and
graphic design. In daily life, people are in constant contact with interfaces, for example
item, the cashier will interact with cash machine. So when users interact with computer
system the can called via user interface (UI). A good user interface must be designed in
a manner that facilitates easy usage. Hence the poor user or the functionality interface
design can be invite the problem example of the computer software, which their
software cannot to proceed next step because the user do not know how to use a
properly.
2.2Problems related to user interface design
Poor labeling of menu items make the users confusing. Hence this can cause user‟s frustration during usage of the items. Mostly the user will commit mistakes during
performing task for example of the radio function in car, the user want to change the
channel FM, they need to press such as press 1,2 or 3 but if user's the press others button
Figure 2.1: Coffee machine interface (Darnell, 2010)
The coffee dispenser in Figure 2.1 does not show any sign that consumers should
provide cups. Then the user who will use it only will continue to press on the buttons
without thinking to provide cups before that. Finally the coffee would spill on the floor.
This is because the display interface is poor instruction; because of the coffee dispenser
machine interaction with humans cannot be properly interpreted by users. Furthermore
example for size cups not show more detail what kind of the cups should use suitable
with coffee machine produce follow the level.
2.2.1 Human Limitations
Several human limitations are described below:
Limited short-term Memory
The user normally can remember what they do when repeating a task. However the user
also has limited capacity to remember. Humans have a capacity to remember seven plus
or minus two items at a time (Miller, 1956). This capacity is enhanced when the items
are familiar to the person. According of Miller(1956) has many factors to influence the
human capacity such as receiving, processing, and remembering in short terms. Several
specific information related to human information processing is:
a) Absolutely judgment is to determine the ability and accuracy with difference
b) Immediate memory which the capacity memory will judgment for later use
(Miller, 1956).
c) Recoding is the ability of the mind to decrease item with complex data which
make more good arranged data. Mostly users will remember things only in the
short term even simple things.
People make mistake
That means normally the user conform do task same mistake even the mistake a little or
much. Examples the user make a mistake on the system and cause wrong function. Then
the mistake will produce inappropriate alarm and message. Actually if the user make a
mistake then produce warning or alarm, there produce stress on the user then more
influence for user make more mistake. Some the user have health problems such as
nervousness then this would be more likely to make mistakes with more. So to reduce
the people make a mistake, the designers need to define what the user‟s need.
People are different
Mostly the user has different physical capabilities. Users have a variety of the physical
abilities, therefore it is important to match the physical abilities of users. If the designers
do not meet the physical ability will cause the user is not satisfied and has a variety of
People have different interaction preference
Like picture or like text. The consumers would like to indicators that variety of shapes
and colors. Mostly the customer preferred color. This is because the color is important
and easy to remember than symbols. Color also has a variety of colors to divide each
function to.
2.3Usability And User experience
The usability was created past 10 years ago to change the term “use friendly” (Bevan et al., 1991). According definition in ISO FDIS 9241-210, usability can be defined as
effectiveness, efficiency and satisfaction related to the usage of interface or product
(Bevan, 1991). Whereas for user experience approach of ISO FDS 9241-210 which a
perception and responses of person and that result from the use and/or expected use of a
product, system or service (Bevan, 1991). However both of definition actually can be
measured during or after use of product, system or service (Bevan, 1991). Actually a
„perceptions and responses” of user experience are the same concepts of satisfaction in
usability (Bevan, 1991). However the usability and user experience have a weakness
which there are not be to clear concerned with time (Bevan, 1991).
Most people cannot tell the difference between usability and user experience (UX).
Besides that mostly think that the user experience is not enough to describe something
that can be used (weather good or bad, it still experiences), and superior usability is user
experience. However, have a new concept to refer to the user experience as the next
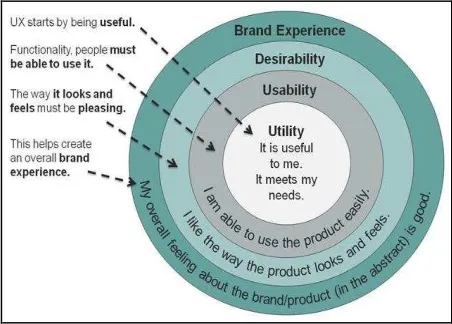
greater perspective of usability as user‟s (Nilsson, 2010). The diagram below shows the usability as parts of the user experience:
According to the diagram above shows that the outermost target based on the user
experience as it taken from the feeling during use, then it can make sense of it as an
experience. This refers to the brand experience. Then the second level is the same as the
outer targets, but it is more to having to use it, for example someone buys iphone will
increase to get the newer version. This is because the benefits and advantages of using
the product. When referring to the outermost layer, the brand experience is enhanced by
good usability and desirability. According definition of user experience in ISO FDIS
9241-210 show usability is part of user experience (UX). “User experience (UX) have
includes all the user‟s preferences, emotions, perceptions, physical and psychological responses, behaviors and accomplishment that occurs, current and after use” so it can be includes the user‟s effectiveness and efficiency (Bevan, 1991).
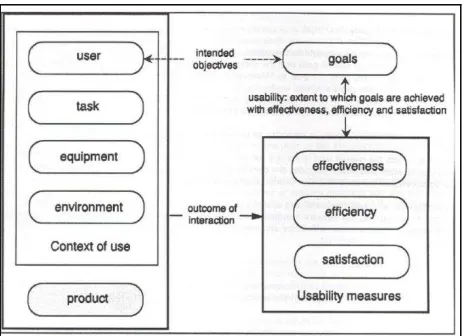
The below figure show is framework of usability:
This framework is for relation between each others. Hence the route of how usability
impacts of each item can be used. Starting from the interaction with a product and then
get out of the usability of the product and will be measured. The measurement of
usability, there has three main elements of satisfaction, effectiveness and efficiency. The
elements should be able to determine a product‟s in terms of quality or not. After
usability that measured, and the objective be achieved with certain specifications then
several user will be granted to use it.
2.3.2 ISO definitions of usability
a) Usability: The potential to be reviewed by products that can be used by specific
user‟s to achieve three main things is Effectiveness, efficiency and satisfactions
in the context specified in the user‟s (ISO 9241-11, 1998).
b) Effectiveness: The accuracy and completeness of user‟s achieve specified goals
(ISO 9241-11, 1998).