Research Article
The Effect of the Parameters of a Vibration-Based
Impact Mode Piezoelectric Power Generator
Amat A. Basari,
1S. Awaji,
1S. Sakamoto,
1S. Hashimoto,
1B. Homma,
2K. Suto,
2H. Okada,
2H. Okuno,
2K. Kobayashi,
2and S. Kumagai
21Division of Electronics and Informatics, School of Science and Technology, Faculty of Gunma University, 1-5-1 Tenjin-cho,
Kiryu, Gunma 376-8515, Japan
2Research and Development Department, Mitsuba Corporation, 1-2681 Hirosawa-cho, Kiryu, Gunma 376-8555, Japan
Correspondence should be addressed to Amat A. Basari; [email protected] and S. Hashimoto; [email protected] Received 12 February 2015; Accepted 11 May 2015
Academic Editor: Nuno M. Maia
Copyright © 2015 Amat A. Basari et al. his is an open access article distributed under the Creative Commons Attribution License, which permits unrestricted use, distribution, and reproduction in any medium, provided the original work is properly cited. his study reports the efects of the parameters of a vibration-based impact mode piezoelectric power generator. First, an evaluation of the efects of the impact parameters, the mass, and the impact velocity is presented. It is found that the output voltage of the piezoelectric device in impact mode is directly proportional to the velocity, whereas the output power is equal to a quadratic function of the same variable. For the same impact momentum, the efect of the velocity in generating a higher peak output is dominant compared with the mass. Second, the vibration-based impact mode piezoelectric power generator is discussed. he experimental results show that a wider operating frequency bandwidth of the output power can be achieved with the preloading coniguration. However, regarding magnitude, due to the high velocity of impact, the coniguration with a gap between the tip and the piezoelectric device produces a higher output.
1. Introduction
Research advancements in mechanical vibration energy har-vesting have been widely reported for decades. Energy from these harvesting systems is expected to be used to power low-power devices, such as LEDs, tire pressure monitoring systems, and many others. he objectives of the study are to propose a new design and to evaluate the factors that afect the output power generation. In general, mechanical vibration is converted to electrical energy using three types of devices: piezoelectric, electrostatic, and electromagnetic devices. Both analytical [1] and experimental analyses [2–5] have shown that there are various factors that afect the performance of such devices. he evaluation of each factor is very subjective that strongly depends on the devices, the environment, and the type of the vibration.
In the case of vibration energy harvesting using piezo-electric devices, for linear vibration motion, the basic oper-ation of power generoper-ation can be divided into two modes: bending mode and impact mode. In bending mode for power
generation using a piezoelectric cantilever beam, one end of the device is attached to the vibration sources and the other end freely vibrates with the sources of the vibration. To improve the output power of the piezoelectric power generator in bending mode, the shape of the device is critical, as it has been shown that devices of certain shapes are more efective than others [6,7].
Another important factor for the optimum output is impedance matching [8,9]. However, impedance matching is dependent to the resonant frequency of the structures, which means that for low resonant frequency structures, a large matching impedance is required. hese are among the important factors that have been considered in the design of vibration-based bending mode piezoelectric power generators.
In the case of vibration-based impact mode power generation, piezoelectric devices do not deform due the vibration. he deformation is due to the impact. As reported in [10], a structure with a freely moving steel ball repeat-edly hits the piezoelectric wall to generate electricity. At
the beginning of the design process, a weight drop experi-ment is conducted. he output power from this experiexperi-ment is found to be relatively higher compared with the output power of the designated device. One suggestion regarding optimizing the output power is that the steel ball must be large and heavy. Another design of an impact mode piezoelectric power generator is reported by [11]. An impact mode power generator consisting of a vibrating beam with a piezoelectric device on top and two additional piezoelectric cantilever beams placed at each side of the vibrating beam is proposed. he vibrating beam has an extended rectangular tip on which a mass is ixed. When the beam vibrates, it hits both piezoelectric beams and, due to the impact, electricity is generated. he implementation target of the device is to harvest low frequency vibrations, such as human motion-related movements. he optimization procedure is based on the impedance matching technique. Another analysis and discussion on the combination of a bending and impact mode power generator is reported in [12]. It is reported that, in terms of voltage, the bending mode piezoelectric specimen generates higher values than that of the impact mode piezoelectric specimen, although how the output can be optimized for the designated device is not discussed.
Other studies have reported the efect of the dimensions of piezoelectric ceramics [13] and the type of vibrations [14] on impact mode piezoelectric power generation. However, the efects of mechanical impact parameters on impact mode piezoelectric ceramic power generation are less discussed by researchers. herefore, this study presents an analytical and experimental study on how to optimize the output power of impact mode piezoelectric power generators by analyzing two parameters that closely efect the output power: the velocity of impact and mass. To identify the relationship of the output power with these two parameters, a weight drop experiment was conducted. Variations in the weight of the objects and the height at which the objects were dropped, which is related to the impact velocity, were considered. he indings were then used to analyze the performance of a forced vibration-based impact mode piezoelectric power generator in harvesting vibration energy.
2. Power Generation of the Piezoelectric
Device in Impact Mode
2.1. Piezoelectric in Impact Mode: Efects of the Impact
Variables. Piezoelectric devices generate electricity through
deformation of its structure. he cause of deformation can be vibration or direct impact on the structure. he characteris-tics of impact mode power generation of piezoelectric devices for various impact parameters can be studied by performing weight drop experiments. heoretically, when an object with a weight of�is dropped from a predetermined height, its impact force is given by the following:
� = ��
ℎ2
= �V2
2ℎ2
, (1)
where �� is the kinetic energy, ℎ2 is the penetration dis-tance, and V is the velocity upon impact. heoretically,
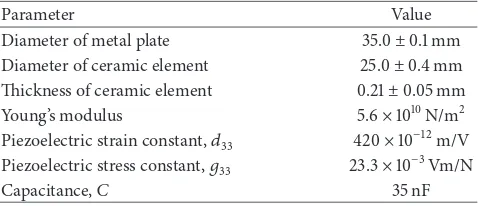
Table 1: Speciications of the round piezoelectric device.
Parameter Value
Diameter of metal plate 35.0±0.1 mm Diameter of ceramic element 25.0±0.4 mm hickness of ceramic element 0.21±0.05 mm
Young’s modulus 5.6×10¹⁰N/m2
Piezoelectric strain constant,�33 420×10−12m/V Piezoelectric stress constant,�33 23.3×10⁻³Vm/N
Capacitance,� 35 nF
the maximum output energy per cycle of piezoelectric devices that operate in 33-mode is given by(2). From the equation, the amount of electrical energy that can be generated by a piezoelectric device is directly proportional to the square of the impact force: thickness of the piezoelectric device, respectively, �33 and
�33 are the piezoelectric charge (strain) and voltage (stress) constants, respectively, and �is the force that acts on the device. Substituting (1) into (2) yields (3), which reveals that the output energy is directly proportional to �2 and
V4 and inversely proportional to the penetration distance
ℎ2. In drop-weight experiments, the two important impact variables are the weight and the velocity of the impact object. Assuming the object is dropped in a free fall and its height is
ℎ1, the velocity of impact can be calculated using the equation
V= √2�ℎ1, where�is the acceleration due to gravity.
2.2. Experiment and Discussion. he weight drop
experi-mental setup is shown in Figure1. he speciications of the piezoelectric device are listed in Table1. he steel balls used in this experiment have diameters of 9.52 mm and 12.7 mm and weights of 4 g and 8 g, respectively, and the material of the steel balls is carbon. Two types of supporting bases of the piezoelectric device are used: a lat base and a base with a hole. Two types of supporting bases are used to evaluate the output power with respect to the change in the stifness. he diameter of the hole of the base is 30 mm.
he experimental method consisted of dropping a steel ball in free fall from a predetermined height such that it hits the piezoelectric device. he output of the piezoelectric power generator was connected to load resistors of 1 kΩ, 10 kΩ, and 20 kΩ. he voltage is recorded to a data logger at a sampling time of 10�s.
Side view
Steel ball
PZT device
Setting base
Load
(a)
Side view
Steel ball
PZT device
Load
Base with hole
(b) (c)
Figure 1: Experimental coniguration: (a) lat base, (b) base with a hole, (c) a round piezoelectric device.
0 0.1 0.2 0.3 0.4
−40
−30
−20
−10 0 10 20 30 40 50
Time (s)
V
o
lt
ag
e (V)
Figure 2: Example of the pulse signal.
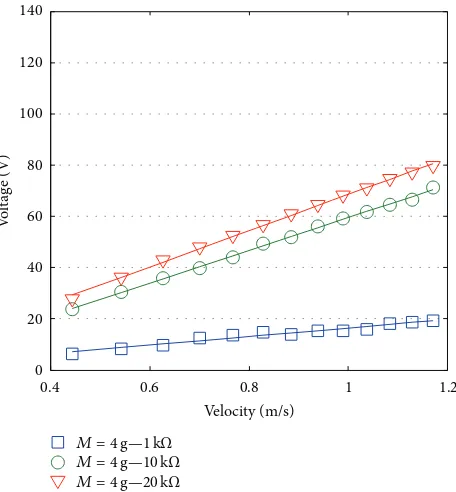
Figure3shows the plot of the instantaneous peak output voltage versus the velocity of impact when the 4 g steel ball and the lat base were used. Regardless of the load, the instantaneous peak voltage is directly proportional to the velocity.
Meanwhile, output power of the load resistor�is denoted by� = �2/�. It is clear that power is proportional to the square of voltage�. As result, as illustrated in Figure4, power is equal to the quadratic function of the velocityV. Here,
we can relate the experimental results in Figures 3 and 4
with(1) and(2). As deined by (1), the impact force is also proportional to the square of the velocityVand results in the
power� to be equal to the quadratic function of the force of impact�. his is supported by the experimental results in Figure4. Moreover, the energy in(2)is the product of power and time. herefore, the energy that can be generated by the piezoelectric device must equal to the quadratic function of the impact force�.
0.4 0.6 0.8 1 1.2
0 20 40 60 80 100 120 140
Velocity (m/s)
V
o
lt
ag
e (V)
M = 4g—1kΩ
M = 4g—10kΩ
M = 4g—20kΩ
Figure 3: Instantaneous peak output voltage versus velocity.
Next, among the three load resistors, due to impedance matching, the output power of the 10 kΩ resistor corre-sponded to the highest average output power compared with the other load resistors.
0.4 0.6 0.8 1 1.2
Figure 4: Average output power (2 ms) versus velocity.
0.4 0.6 0.8 1 1.2
Figure 5: Average output power (2 ms) versus velocity plots for 4 g and 8 g steel balls.
herefore, for equal momentum, a higher average output power is obtained when using an object with a higher impact velocity rather than a heavier object.
Next, we evaluate the relationship between the output power and the stifness of the piezoelectric device. he previous experiments were conducted using a piezoelectric device set on a lat iron base, which indirectly increased the stifness of the device structure as a whole. In turn, incremental increases in the stifness degraded the strain that developed on the piezoelectric device, resulting in lower output power. herefore, to optimize the output power of the device, a base with a round hole was used to substitute
0 2 4 6 8 10
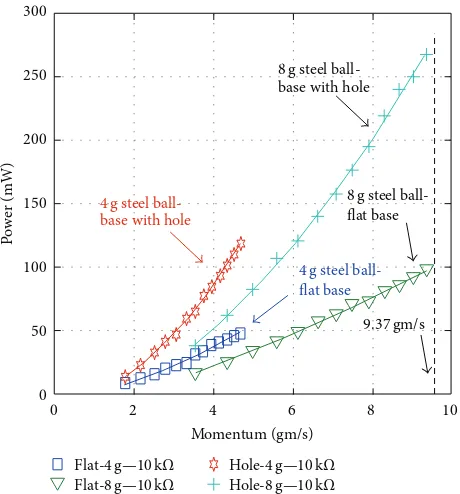
Figure 6: Average output power (2 ms) versus momentum plots for 4 g and 8 g steel balls.
Figure 7: Iron base with hole.
the lat iron base. Figure7shows the base. he diameter of the hole is 30 mm. he piezoelectric device was placed on the base with the proper adjustment such that the piezoelectric device is placed exactly on the hole.
he same weight drop experiments were conducted, varying the height and weight of the steel ball. he output power comparison is shown in Figure8. In this igure, four datasets are plotted. It is obvious that when piezoelectric device was placed on the base with hole, its average output power has increased. For the highest momentum of 9.37 gm/s, the diference in the output power was greater than 100 mW. herefore, increasing the stifness of the entire structure of the piezoelectric device reduces the device eiciency. hus, the stifness of the device structure must be considered to improve eiciency.
3. Device Configuration
P
Figure 8: Average output power (2 ms) versus momentum plots for 4 g and 8 g steel balls comparing the lat base and the base with a hole.
he coniguration of the proposed power generator consists of three main structures: the base beam, an adjustable spacer, and the vibrating beam with the proof mass attached to the free end of the beam. Another important component attached to the free end of the vibrating beam is a metal tip. A schematic of the power generator is shown in Figure9, and speciications of the structures are listed in Table2. he thickness of the base beam is set to 10 times thicker than the vibrating beam to reduce antiresonances.
he operating principle of the power generator is to generate electricity from impact on the piezoelectric device. Every impact on the piezoelectric device produces a voltage pulse across the load resistor. he piezoelectric device is bonded to the base beam with epoxy and is placed on the hole of the beam so that as discussed in the previous section, the power generation can be optimized by maintaining the original stifness of the piezoelectric device. he proof mass served as a delection booster for the vibrating beam. Adjusting the weight of the proof mass is also performed for the resonant frequency variation. In addition, at the clamped area of the coniguration, adjustable spacers were used to separate the vibrating beam and the base beam. he total thickness of the piezoelectric device is 0.41 mm, and the height of the tip is 3 mm. Based on a simple calculation, a 3 mm thickness spacer creates no gap between the tip and the piezoelectric device, thus allowing for a preloading condition on the piezoelectric device.
Increasing the thickness of the spacer to 4 mm should produce a gap between the tip and the piezoelectric device. However, the proof mass pressurizes the tip of the vibrating beam, which eventually results in the same situation as
Table 2: Speciications of the structures of the power generator.
Structure Value
Base beam (aluminum) 130×50×10 mm Vibrating beam with hole
(aluminum) 100×20×1 mm
Adjustable spacer
(aluminum) 26×20×1 mm
Proof mass (aluminum) 26 and 40 g Round shape of tip (iron) Height: 3 mm
Φ: 4.5 mm
the 3 mm coniguration. Although both conigurations lead to a preloading condition on the piezoelectric device, in terms of the strength of the loads, the 3 mm coniguration is expected to be higher. hus, in comparing these two conigurations, the 3 mm coniguration requires a relatively higher velocity and frequency of vibration before the tip can vibrate and hit the piezoelectric device. Our analyses show that evaluation of the preloading condition on power generation from vibrations of frequencies below 100 Hz can be realized using a spacer thickness of 4 mm. An additional 1 mm of spacer thickness creates a coniguration with a gap between the tip and the piezoelectric device. Actual measurements show that the gap is approximately 0.604 mm. Importantly, all of the above analyses were performed using a proof mass of 26 g.
3.1. Piecewise Linear Model of the System. he amount of
output power that can be generated is highly dependent on the number of impacts made by the tip. Generally, number of voltage pulses is directly proportional to the number of impacts. hus, increasing the frequency of the vibrator will increase the number of impacts in one second. However, the impact velocity is dominant regarding the magnitude of the pulse. As discussed in the previous section, the peak of the output power is proportional to the square of the velocity. hus, the output power generation for a period of time is expected to be dependent on the frequency of the vibrations and the velocity of the impact.
Adjustable spacer
Base beam
Vibrator
Vibrating beam Proof mass Tip
PZT
Construction of the power generator
�6(hole)
Base beam Vibrating beam
(hole)
Figure 9: Construction of the power generator and schematics of the structures.
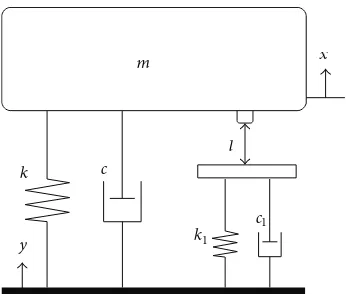
m x
Figure 10: Piecewise linear model of the forced vibration-based impact mode piezoelectric power generator.
the maximum displacement and hits the device again. he system can be represented by the diferential equation given in the following:
� ̈� + � ( ̇� − ̇�) + � (� − �) =0 � > −�,
� ̈� + (� + �1) ( ̇� − ̇�) + (� + �1) (� − �) =0 � < −�,
(4)
where � is the external excitation signal and � is the displacement of the mass. In this study,�(�) = �0sin(��), where �0 is the excitation amplitude and �is the applied vibration’s frequency. he detailed numerical solutions of these set of equations are reported in [16].
4. Experimental Results and Discussion
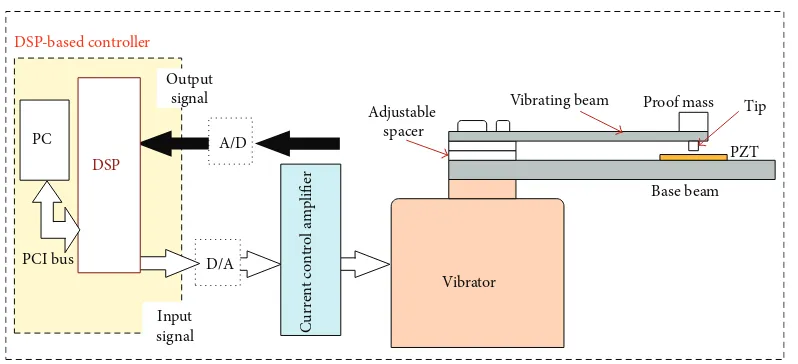
4.1. Experimental Setup and Conditions. he experimental
setup is shown in Figure11. he input signal to the vibrator and the output are monitored and recorded using a PC running the DSP-based controller sotware. he sampling time was set to 20�s. he input signal voltage was ixed,
whereas the vibration frequency was varied. Variations in the frequency cause the acceleration of the vibration signal to vary. Our analyses evaluated the power generation in the frequency range below 100 Hz.
Based on the weight drop experiment results in the previous section, the optimum output power was generated with a load resistor of 10 kΩ. herefore, in this experimental evaluation, the same resistor was used as the load. To evaluate the efect of the weight of the proof mass on the output, two proof masses were used: 26 g and 40 g. Based on the system identiication experimental results when a proof mass of 26 g was used, the resonant frequency of the power generator without the base beam was 24 Hz. When a proof mass of 40 g was used, the frequency decreased to 19 Hz. Power generators with 4 mm and 5 mm spacer thicknesses were constructed and examined. he diferences between the two conigurations are described in the previous section.
4.2. Results. As the vibrating beam vibrates and the tip hits
the piezoelectric device, a voltage pulse signal is produced across the load resistor. he number of pulses per second is dependent on the frequency of the vibration; that is, for a 35 Hz vibration, 35 voltage pulses are generated. A sample of the output voltage is shown in Figure12. Figure12(a) shows the output voltage when an input vibration of 35 Hz was used to excite the power generator.
Figure 12(b) shows a plot of the output power of one pulse. Two parts of the pulses for one impact can be observed. Deformation of the device is induced by the impact produced in the irst part of the output pulse. As the tip and the device separate, the device vibrates for some time before coming to a stop, generating another output pulse, as shown in the plot. he output pulse appears to last for approximately 5 ms for every impact.
Adjustable
Figure 11: Experimental setup.
(a) (b)
0.416 0.418 0.42 0.422
5ms
Power output
Figure 12: he output signals for a 35 Hz vibration, a spacer thickness of 4 mm and load resistor of 10 kΩ. (a) he output voltage; (b) the output power.
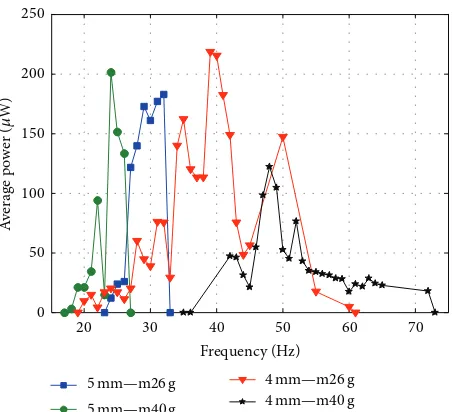
the preloading condition, for which the spacer thickness is 4 mm, the operating frequency bandwidth is wider than that of the coniguration with a 5 mm spacer thickness regardless of the weight of the proof mass. he operating frequency bandwidth of the coniguration with both proof masses is approximately 40 Hz. Comparing these two plots, the magni-tude of the coniguration with the 26 g mass exhibited a peak output when the excitation frequency is approximately 39 Hz. However, for the coniguration with the 40 g proof mass, the excitation frequency peaked at 48 Hz. he magnitude of the output power of the power generator with the lighter mass is relatively higher than that of the heavy mass. As previously discussed, the magnitude of the output power is proportional to the square of the impact velocity. hus, for a lighter proof mass, the beam is expected to have a higher velocity upon impact. he signiicant diference in the magnitude is due to this factor. For a lighter proof mass, the tip begins to hit the device and generate output at lower frequencies. Due to the weight, the power generator with the heavy proof mass only begins to hit the device when the frequency of vibration is increased to approximately 35 Hz. hus, for the preloading condition, shiting the operating frequency of the power gen-erator to a high frequency bandwidth can be simply achieved by increasing the proof mass weight. However, increasing
the weight of the proof mass subsequently decreases the output magnitude.
For a power generator with a gap between the tip and the device, the operating frequency bandwidth decreases to approximately 25% of that of the coniguration under the preloading condition. For a gap 0.604 mm between the tip and the device, the motion of the tip of the vibrating beam must be greater than that for power generation. Consider-ing the vibration of the vibrator, increasConsider-ing the vibration frequency beyond the resonant frequency of the power generator decreases the acceleration of the tip. herefore, as the frequency reaches 33 Hz or 27 Hz for the 26 g and 40 g conigurations, respectively, the motion of the tip becomes less than 0.604 mm. From the same plot, operating frequency of the coniguration with the lighter proof mass is slightly higher than the coniguration with the heavier proof mass. his characteristic difers from the coniguration in the preloading condition, as discussed earlier.
20 30 40 50 60 70
Figure 13: Plot of average output power (5 ms) versus frequency.
separated by antiresonances, especially for the conigura-tion under the preloading condiconigura-tion. To explain this phe-nomenon, we must analyze the motion of the structures of the power generator.
As discussed previously, the basic structure of the pro-posed power generator consists of a vibrating beam and a base beam, which are coupled at one end. When a vibration is applied to the structures, the base beam is ideally assumed to vibrate without delection. In addition, a vibrating beam with a thickness of 1 mm and a proof mass attached will vibrate and delect at the free end. Variations in the frequency will vary the amplitude of the free end of both beams. herefore, a small change in the frequency subsequently changes the timing of the tip hitting the piezoelectric device on the base beam. he velocity of the impact severely varies with these changes, which contributes to the unstable output power over the operation frequencies. he resonance output is expected to be generated when the vibrating beam hits the piezoelectric device at its peak velocity as it crosses the equilibrium point. In addition, for the antiresonance output, the impact occurs at a low velocity of the vibrating beam.
5. Conclusions
Analytical and experimental studies of the efects of the mechanical impact parameters on piezoelectric power gen-eration in impact mode are presented. he experimental data given in the irst part of this study show that the velocity of impact afects the forces and subsequently the output power and the energy to a greater degree than the mass. Moreover, it was experimentally demonstrated that, the optimum output power can be achieved if the stifness of the device is maintained at its original value so that the eiciency does not decrease. In the second part of this study, analyses of the output power of the vibration-based impact mode power generator were presented. Two conigurations were
analyzed. Although the operating frequency of the preload coniguration is wider than the coniguration with the gap, due to the relative motion of the two beams, the output power sufers the resonance and antiresonance phenomena. Further evaluations of the structures of power generators should be performed in the future so that a stable output power and wider operating frequency bandwidths can be achieved.
Conflict of Interests
he authors declare that there is no conlict of interests regarding the publication of this paper.
References
[1] Z. Chen, B. Guo, Y. Luo, and Y. Yang, “Numerical investigations into the efects of multiple parameters on nonlinear piezo-electric vibration energy harvesters,”Advances in Mechanical Engineering, vol. 6, Article ID 604704, 9 pages, 2014.
[2] S.-M. Chen and J.-H. Hu, “Experimental study of a hybrid vibration energy harvesting mechanism,” in Proceedings of the Symposium on Piezoelectricity, Acoustic Waves, and Device Applications (SPAWDA ’11), pp. 56–59, December 2011. [3] Z. Wang, B. Wang, M. Wang, H. Zhang, and W. Huang, “Model
and experimental study of permanent magnet vibration-to-electrical power generator,”IEEE Transactions on Applied Super-conductivity, vol. 20, no. 3, pp. 1110–1113, 2010.
[4] Y. Sang, X. Huang, H. Liu, and P. Jin, “A vibration-based hybrid energy harvester for wireless sensor systems,”IEEE Transactions on Magnetics, vol. 48, no. 11, pp. 4495–4498, 2012.
[5] L. Yan, J. Hou, Z. Yang, and X. Chu, “Design and experimental characterization of a vibration energy harvesting device for rotational systems,”Advances in Mechanical Engineering, vol. 2013, Article ID 263614, 7 pages, 2013.
[6] A. Shebeeb and H. Salleh, “Efect of cantilever shape on the power output of a piezoelectric bimorph generator,” in Pro-ceedings of the IEEE International Conference on Semiconductor Electronics, pp. 275–278, June 2010.
[7] A. A. Basari, S. Awaji, S. Wang et al., “Shape efect of piezoelec-tric energy harvester on vibration power generation,”Journal of Power and Energy Engineering, vol. 2, no. 9, pp. 117–124, 2014. [8] A. A. Basari, S. Awaji, S. Hashimoto et al., “Comparison and
evaluation of vibration-based piezoelectric power generators,” inProceedings of the International Power Electronics Conference (IPEC-Hiroshima—ECCE-ASIA ’14), pp. 3194–3199, Hiroshima, Japan, May 2014.
[9] N. Kong, D. S. Ha, A. Erturk, and D. J. Inman, “Resistive impedance matching circuit for piezoelectric energy harvest-ing,”Journal of Intelligent Material Systems and Structures, vol. 21, no. 13, pp. 1293–1302, 2010.
[10] E. Simon, Y. Hamate, S. Nagasawa, and H. Kuwano, “3D vibration harvesting using free moving ball in PZT microbox,” inProceedings of the Power MEMS, pp. 33–36, 2010.
[11] M. A. Halim, S. Khym, and J. Y. Park, “Impact based frequency increased piezoelectric vibration energy harvester for human motion related environments,” inProceedings of the 8th Annual IEEE International Conference on Nano/Micro Engineered and Molecular Systems (NEMS ’13), pp. 949–952, IEEE, Suzhou, China, April 2013.
d31 and d33 operating modes,” inProceedings of the 8th Annual IEEE International Conference on Nano/Micro Engineered and Molecular Systems (IEEE NEMS ’13), pp. 440–443, April 2013. [13] X.-R. Chen, T.-Q. Yang, W. Wang, and X. Yao, “Vibration energy
harvesting with a clamped piezoelectric circular diaphragm,” Ceramics International, vol. 38, pp. S271–S274, 2012.
[14] M. Okayasu, D. Sato, Y. Sato, M. Konno, and T. Shiraishi, “A study of the efects of vibration on the electric power generation properties of lead zirconate titanate piezoelectric ceramic,” Ceramics International, vol. 38, no. 6, pp. 4445–4451, 2012. [15] M. Renaud, P. Fiorini, R. Schaijk, and C. Hoof, “Harvesting
energy from the motion of human limbs: the design and analysis of an impact based piezoelectric generator,”Smart Materials and Structures, vol. 18, no. 3, Article ID 035001, 16 pages, 2009. [16] A. Narimani, M. F. Golnaraghi, and G. N. Jazar, “Frequency
Submit your manuscripts at
http://www.hindawi.com
VLSI Design
Hindawi Publishing Corporation
http://www.hindawi.com Volume 2014
Hindawi Publishing Corporation
http://www.hindawi.com Volume 2014
Hindawi Publishing Corporation http://www.hindawi.com
Journal of
Engineering
Volume 2014
Hindawi Publishing Corporation
http://www.hindawi.com Volume 2014 Shock and Vibration
Hindawi Publishing Corporation
http://www.hindawi.com Volume 2014
Mechanical Engineering
Advances in
Hindawi Publishing Corporation
http://www.hindawi.com Volume 2014
Civil Engineering
Advances inAcoustics and Vibration
Advances in
Hindawi Publishing Corporation
http://www.hindawi.com Volume 2014
Hindawi Publishing Corporation
http://www.hindawi.com Volume 2014
Electrical and Computer Engineering
Journal of Hindawi Publishing Corporation
http://www.hindawi.com Volume 2014
Distributed Sensor Networks
International Journal of
The Scientiic
World Journal
Hindawi Publishing Corporation
http://www.hindawi.com Volume 2014
Sensors
Journal ofHindawi Publishing Corporation
http://www.hindawi.com Volume 2014
Modelling & Simulation in Engineering
Hindawi Publishing Corporation
http://www.hindawi.com Volume 2014
Hindawi Publishing Corporation
http://www.hindawi.com Volume 2014 Active and Passive Electronic Components
Hindawi Publishing Corporation
http://www.hindawi.com Volume 2014 Chemical Engineering
International Journal of
Control Science and Engineering Journal of
Hindawi Publishing Corporation
http://www.hindawi.com Volume 2014 Antennas and
Propagation International Journal of
Hindawi Publishing Corporation
http://www.hindawi.com Volume 2014
Hindawi Publishing Corporation
http://www.hindawi.com Volume 2014
Navigation and Observation International Journal of
Advances in OptoElectronics
Hindawi Publishing Corporation
http://www.hindawi.com Volume 2014
Robotics
Journal ofHindawi Publishing Corporation