Abstract— Inclusion of disturbances in the control system structure of XY table during simulation process is crucial in order to closely replicate the real system in the simulation structure. An example of the distinguished disturbances during cutting operation is cutting forces. It can affect the accuracy of actual position of x and y-axis movement during the cutting operation. Thus, it is important for control designer to include the cutting force disturbance before designing the controller for the XY table system. This paper is focused on the fundamental aspect on how to extract the useful cutting forces data from the raw cutting force data by showing the step by step procedure on how to implement the process. In addition, method on how to convert from the selected cutting forces disturbance data into the form of voltage so that the disturbances is possible to be injected into the system is also being touched and finally, the discussion on the relationship between machine spindle speed and the cutting force generated is also being addressed required forces to perform the cutting operation. Cutting forces acts in the direction of cutting speed and supplies the energy required to cut the workpiece [1]. The dimension of cutting forces is in Newton. Cutting forces presence naturally during the process of cutting operation. In order to compensate the cutting force occurred in the milling operation, the data of cutting force need to collected firs t. By collecting the required data, the characteristic and behaviour of the cutting force with
T his work was supported by the short term grant scheme (PJP) Universiti T eknikal Malaysia Melaka with reference number
PJP/2011/FKP(2A)/S00869.
L. Abdullah is with the Universiti T eknikal Malaysia Melaka, Hang T uah Jaya, 76100, Durian T unggal, Melaka, Malaysia (phone:606
-331-6973;fax:606-331-6411;e-mail: [email protected]). Z. Jamaludin is with the Universiti T eknikal Malaysia Melaka, Hang
T uah Jaya, 76100, Durian T unggal, Melaka, Malaysia (e-mail: [email protected]).
T . H. Chiew and N.A. Rafan are with the Universiti T eknikal Malaysia Melaka, Hang T uah Jaya, 76100, Durian T unggal, Melaka, Malaysia (e-mail: [email protected],[email protected]).
different cutting conditions or parameters can be identified and analyzed. Then, the compensation can only be applied based on the cutting force data obtained [2]. Various measuring methods of cutting force were explained in literature. In general, the most common method to measure cutting force in the machining operation such as milling process is through table dynamometers [3],[4]. Table dynamometer consists of piezoelectric sensors that are clamped between two plates [5]. Park [6] claimed that the table dynamometer is more suitable for experiment and laboratory work. A good example of table dynamometer that is available in the market is like the Kistler dynamometer.
Other than dynamometer, another measuring method of cutting force is applied by Park [6] and Albrecht [5] using capacitive displacement sensor. The capacitive displacement sensor is attached externally on the spindle system via a bracket which mounted at spindle housing. The displacement of the spindle flange can be measured during milling operation. The cutting force can be measured or estimated by obtaining the displacement as the displacement is directly proportional to the cutting force which proven by Park [6] and Albrecht et a l. [6] experimentally. Kim et a l. [7],[8] validated the cutting force measurement via another type of sensor which known as cylindrical capacitive displacement sensor.
This paper is organized as follows. Section II describes the experimental setup. Section III discusses the method on how to perform cutting force characterization. Section IV explains about the findings and results. Finally, section V summarizes the main conclusions of this paper.
II. EXPERIMENT AL SET UP
The experimental setup consists of three main parts namely; (A) Preparation of equipment and material (B) System setup (C) Cutting Force Identification
A. Prepa ra tion of equipment a nd ma teria l
The equipment used to collect the milling cutting forces data are as in Table I. Basically, it consists of milling machine to perform the cutting operation, the dynamometer to collect the cutting force data and the work material used is Aluminium. The work piece used is aluminium with the dimension of the block of 100mm X 100mm X 25mm. The aluminium blocks have four through holes drilled in which the diameter of each hole is 8mm. The purpose of drilling through holes is to allow mounting of workpiece on the Kistler dynamometer. The
Systematic Method for Cutting Forces
Characterization for XY Milling Table Ballscrew
Drive System
reason why the aluminium block needs to be mounted at the four points through hole is to ensure a steady and strong mounting to avoid any weakness point occurred on the structure of the block during cutting operation that may affect the accuracy of the collected cutting forces data. Besides that, if the workpiece is not mounted properly, the reliability of the cutting forces data are compromised due to the uneven distribution of forces along the block. The prepared aluminium block is as shown in fig. 3.
B. System Setup
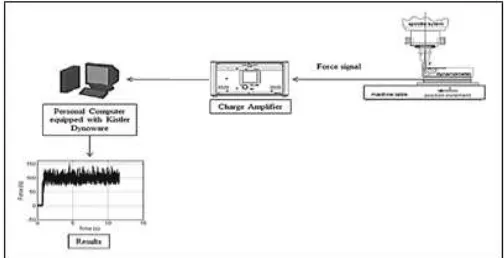
The end milling process is conducted using milling machine of model Gate PBM VS400. The Kistler dynamometer type 9257B as shown in fig. 1 is located on the table of milling machine and being locked through four Allen cap screws in diameter of 8 mm and length of 50mm. The aluminium block is mounted on the dynamometer via four hex cap mounting screws with diameter of 8 mm and length of 35 mm on each edge of the block. The Kistler dynamometer is connected to the charge amplifier and from the amplifier, it is connected to the Digital Acquisition Board (DAQ) and finally, it is connected to personal computer. The personal computer is equipped with software of Kistler Dynoware for data acquisition using cable that is provided in the Kistler dynamometer. The mounting points of the Kistler Dynamometer is shown in fig. 1.
Referring to fig. 1, point 1 until point 4 is used to mount the dynamometer on milling table by using hex cap screws whereas the workpiece aluminium block is mounted on the dynamometer at point 5 to point 8. Fig. 2 portrays the schematic diagram of the system setup for the purpose of cutting force identification.
Fig. 1. Kistler Dynamometer with mounting point.
Fig. 2. Diagram of Cutting Force Identification
Fig. 3. Aluminium block during cutting
C. Cutting Force Identifica tion
There are two main tasks in the area of cutting force identification. First is to design the cutting parameters and second is to design the cutting path planning. The range of cutting parameters used is basically based on the general recommendation of Kalpakjian and Schmid [1] as shown in Table II. On the other hand, in Table III, it shows the details of the design of experiments for the purpose of cutting force identification.
T ABLEII LIST OF EQUIP MENT
Equipment and
Material Description
Milling Machine Gate PBM VS 400
Cutter Material High Speed Steel (HSS)
Cutter Diameter 10mm
Cutter Edge 4
Workpiece Material Aluminium
Dynamometer TABLEI LIST OF EQUIP MENT
Equipment and
Material Description
Milling Machine Gate PBM VS 400
Cutter Material High Speed Steel (HSS)
Cutter Diameter 10mm
Cutter Edge 4
Workpiece Material Aluminium
TABLE III
DETAILS OF THE EXP ERIMENT DESIGN FOR CUTTING FORCE IDENTIFICATION
Cutting Parameters Description
Spindle Speed (rpm) 1000, 1500, 2000, 2500, 3000
Cutter Material High Speed Steel (HSS)
Depth of cut 1mm
Sampling Rate 2000 Hz
Sampling T ime 0.0005 seconds per sample
T otal Sample
Number 40 000 samples
III. CUT T INGFORCECHARACT ERIZAT ION
In the field of control systems engineering, cutting force characterization can be defined as a process of extracting the relevant cutting force data from the raw cutting force data that will be used to represent the real cutting force dynamic behavior during simulation process. Basically, there are four basic steps in cutting force identification procedure[10],[11]. The steps are as follows :-
(A) Step 1 : Collection of raw cutting force data (Cutting forces with respect to time)
(B) Step 2 : Extracting the relevant cutting force data .
(C) Step 3 : Conversion from cutting force data in Newton to cutting force data in the form of voltage and it is injected into the Simulink diagram as disturbances.
(D) Step 4 : Transformation of cutting force data in time domain into cutting force data in
frequency domain using Fast Fourier Transform (FFT) method.
A. Step 1 : Collection of Ra w Cutting Force Da ta
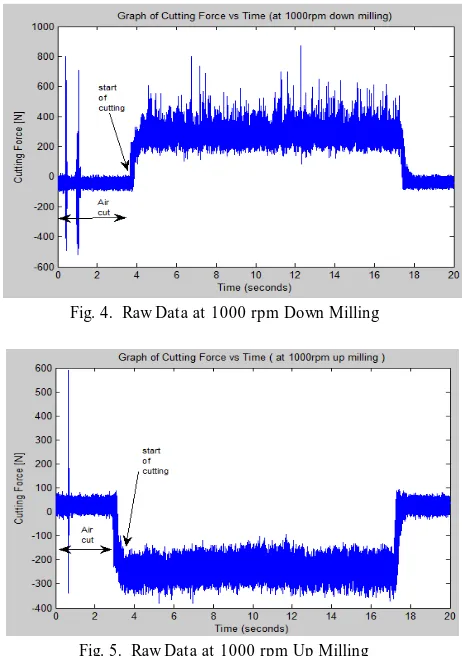
During the milling operation, the cutting force produced will be detected by the sensors of the Kistler dynamometer. This cutting force signals will transmit to the amplifier. The amplifier will enlarge the signals and then transmitted to the DAQ board and then personal computer. With the assistance of the software of Kistler Dynoware, the sample graph of cutting force against time at the spindle speed of 1000 rpm for down milling and up milling are shown in fig. 4 and 5 respectively. Based on the observation from fig. 4 and 5, it is found that the magnitude of cutting force for up milling and down milling are almost identical, the only difference is in term of the positive or negative sign. This is due to the preset direction from the Kistler dynamometer which means positive x-axis is towards up direction and negative x-axis is towards down direction [9].
Fig. 4. Raw Data at 1000 rpm Down Milling
Fig. 5. Raw Data at 1000 rpm Up Milling
B. Step 2 : Extra cting the Releva nt Cutting Force Da ta The next step in cutting force characterization process is to extract or to select the useful cutting force data from the raw cutting force data. This step is exceptionally vital to ensure that the data is reliable enough to represent to real cutting force condition during the simulation in Simulink. Based on fig. 4 and 5, it is clearly shown that from time 0 seconds to time 4 seconds, there is no cutting activity and it is just an air cut. It is the same case at time 17 seconds until time 20 seconds. Hence, those data need to be eliminated and the time need to be reset accordingly. Below are the matlab m-file command to TABLEII
RECOMMENDED CUTTING PARAMETERS OF MILLING OP ERATION FOR ALUMINIUM
Cutting Parameters Description
Workpiece Material Aluminium
Feed (mm/tooth) 0.08 - 0.46
Spindle Speed (rpm) 300 - 3000
conduct the process of extracting the relevant cutting force data.
plot (da ta 1000 (:,1),da ta 1000(:,2)); cut1000 = da ta 1000(5*2000:10*2000, :
cuttime1000 = cut1000(: , 1); m1 = 1, n1 = 10001; inittime1= cuttime1000(1,1); for i1 = m1 : n1;
retime1(i1-m1+ 1,1) = cuttime1000(i1,1) -inittime1
reset1000 = [retime1 cut1000(: , 2) ] ; plot(reset1000(:,1), reset1000(:,2))
Fig. 6 and 7 shows the new plot of graph of desired cutting force data for down and up milling respectively.
Fig. 6. Cutting Force Reset Data at 1000 rpm Down Milling
Fig. 7. Cutting Force Reset Data at 1000 rpm Up Milling
C. Step 3 : Conversion from cutting force da ta in Newton to cutting force da ta in the form of volta ge
After finish extracting the desired cutting force data, the subsequent step is to convert the data into the form of voltage. It is because later on the cutting force data is needed to be injected into the simulink diagram as disturbance and the dimension involved in the simulink is in the unit of volt. Since it is known that the original dimension of the cutting force is in Newton, in order to convert it to voltage in volt, the cutting force needs to be multiplied with a constant gain in the dimension of volt/newton so that in the end the value will be in volt. Given that from the Kistler dynamometer manual, the
capacitance value of it is 220 pF (picoFarad) and the Kistler constant is 7.9 pC/N (picoCoulomb/newton). By dividing the value of capacitance with the Kistler constant, the value of the result is equivalent to 27.848 (newton/volt). Finally, as mentioned earlier in the text, in order to obtain constant gain in volt/newton, the value of the previous result need to be inversed to become a constant gain of 1/27.848 (volt/newton). This constant gain is clearly s how in fig. 8 with the name of force to voltage converter. Fig. 8 also shows the simulink diagram and the method on how the cutting force disturbance is injected into the system.
Fig. 8. Simulink Diagram of the Overall System
D. Step 4 : Tra nsforma tion of cutting force da ta in time doma in into cutting force da ta in frequency doma in using Fa st Fourier Tra nsform (FFT) In the later stage of this research, it is recommended to convert the cutting force data into the form of Fast Fourier Transform (FFT) so that spectral analysis could be executed afterwards. One of the advantage of performing Spectral Analysis is the ability to clearly observe and identify the cutting force disturbance that exist during the cutting operation at each particular frequency of the system. Furthermore, the objective to carry out spectral analysis is to determine the effect of the spindle speed towards the cutting speed. It is important to know whether the higher the simple speed will result to the higher the value of the cutting speed in unit Newton or vice versa.
Below are the matlab m-file command to carry out the process of converting the cutting force data into the form of FFT. fft1000= reset1000(0*2000+ 1:5*2000+ 1,2); m1= 0*150+ 1;n1= 5*150;
inittime1= retime1(m1); for i1= m1:n1+ 1,
ffttime1(i1-m1+ 1,1)= retime1(i1) -inittime1; index1= 10001;
fre1= 0:1/ffttime1(index1):150; x1= a bs(fft(fft1000)); plot(fre1,x1*2/index1)
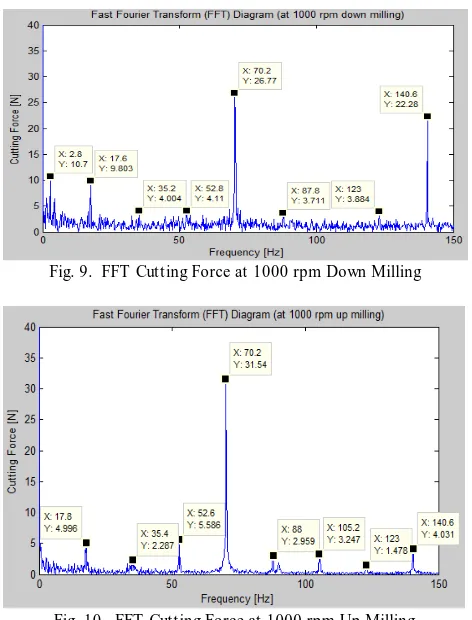
Fig. 9. FFT Cutting Force at 1000 rpm Down Milling
Fig. 10. FFT Cutting Force at 1000 rpm Up Milling
Fig. 11 and fig. 12 shows the diagram of FFT cutting force at 2000 rpm and 3000 rpm respectively.
Fig. 11. FFT Cutting Force at 2000 rpm
Fig. 12. FFT Cutting Force at 3000 rpm
IV. RESULT AND DISCUSSION
Referring to fig. 9 and 10, it clearly indicates that the cutting forces are the combination of forces at different value of frequency. In fig. 9, the maximum cutting force occurred at the fundamental frequency of 70.2 Hz and 140.6 Hz which is 26.77 Newton and 22.28 Newton respectively, whereas in fig. 10, result shows that the maximum peak value of cutting force take place at the fundamental frequency of 70.2 Hz which correspond to 31.54 Newton. Furthermore, based on fig. 11, the maximum cutting force take place at the fundamental frequency of 35.17 Hz and 140.8 Hz which match up with cutting force value of 15.74 Newton and 18.45 Newton respectively. Finally, in fig. 12, the maximum cutting force arise at the primary frequency of 50.17 Hz and 100.2 Hz and that lead to cutting force value of 6.547 Newton and 4.455 Newton respectiv ely. The results indicate that it is necessary for the control designer to design a controller to compensate those cutting forces especially at those particular frequency where the cutting forces exerted to the system is maximum.
In addition, through observation, it is found that there is an existence of harmonic frequencies for the cutting forces application. The term "ha rmonic" simply means that the width of the fundamental frequency is equally or almost the same to one another. First and foremost, for the case of cutting force at 1000 rpm, the fundamental frequency is approximately at 70 Hz, thus, the frequencies of the harmonics are at 70 Hz, 140 Hz, 210 Hz and so on. Next, for the case of cutting force at 2000 rpm, the primary frequency occurred at 35 Hz, therefore, the frequencies of the harmonics are at 35 Hz, 70 Hz, 105 Hz, 140 Hz and so on. Last but not least, for the case of cutting force at 3000 rpm, the fundamental frequency take place at 50 Hz, hence, the frequencies of the harmonics are at 50 Hz, 100 Hz, 150 Hz and so on. This phenomenon will be able to help the control system engineer and researcher to predict the fundamental frequency that actively involved so that later on they can design a controller to cater this issue.
becoming lower due to amount of the material need to be cut is smaller.
V. CONCLUSION
In conclusion, in order to perform cutting force characterization of milling operation there are few steps need to be done. Those steps have been discussed in great details in section III. Basically, in general there are four steps of processes namely process of collecting the raw cutting force data, secondly, process of extracting the relevant cutting force data, thirdly, process of conversion of cutting force data from Newton into the form of voltage and finally, the process of transforming the cutting force data in time domain into cutting force data in frequency domain by using Fast Fourier Transform technique. Later on, those data can be analyzed further using spectral analysis method to identify the specific cutting force value that actively involved at each respective frequency. On the other hand, as a precaution, there are few areas that need to be highlighted in order to preserve good practice of data collection of cutting force during the experimental process and to avoid any deficiencies that may affect the result. First, the usage of jig and fixtures is a must to ensure that the workpiece material is steadily located on the milling machine. Secondly, the experiment need to be done at least three times for each respective spindle speed to guarantee the consistency of the result and last but not least, it is advisable to use new tool material for each respective spindle speed so that the cutting force data collected is consistent and reliable.
ACKNOWLEDGMENT
This research is financially supported by the Fundamental Research Grant Scheme, Ministry of Higher Education Malaysia, Universiti Teknikal Malaysia Melaka (UTeM) with reference no. FRGS/2010/FKP/TK02/5/F00103.
REFERENCES
[1] S. Kalpakjian and S. Schmid. Ma nufa cturing Engineering a nd Technology. Singapore :Pearson Prentice Hall, 2006, ch.24. [2] L. Abdullah, Z. Jamaludin, N.A. Rafan, T .S. Chiew and M.S. Syed
Mohamad "System identification of XY table ballscrew drive using parametric and nonparametric estimation via deterministic approach," P rocedia Engineering , vol.41, pp.567-574, Jul .2012. [3] Z. Jamaludin, H.V. Brussel and J. Swevers "Accurate motion control
of XY High speed linear drive using friction model feedforward and cutting force estimation," CIRP Anna ls- Ma nufa cturing Technology , vol.57, pp.403-406, Jul .2008.
[4] Z. Jamaludin, “Disturbance compensation for a machine tool with
linear motors,” Ph.D. Thesis, Dept. Wertuigkunde., Katholieke Univ., Leuven, Belgium, 2008.
[5] A. Albrecht, S.S Park, Y. Altintas and G. Pritschow "High frequency bandwidth cutting force measurement in milling using capacitance displacement sensors ," Interna tiona l Journa l of Ma chine Tools a nd Ma nufa cture, vol.45, pp.993-1008, 2005.
[6] S.S Park, “High frequency bandwidth cutting force measurements in
milling using spindle integrated force sensor system,” Ph.D. Thesis, Univ. of British Columbia, 2003.
[7] G.D. Kim, W.T . Kwon, and C.N. Chu "Indirect cutting force measurement and cutting force regulation using spindle speed motor current ," Interna tiona l Journa l for Ma nufa cturing Science a nd Technology, vol.1, pp.50-64, 2005.
[8] J.H. Kim, H.K. Cheng, D.C. Han and D.Y. Jang "Cutting force estimation by measuring spindle displacement in milling process," CIRP Anna ls- Ma nufa cturing Technology, vol.54, pp.67-70, 2005. [9] Kistler Group.: Force Measurement Dynamometer 9257B Manual,
Switzerland, 2009.
[10]L. Abdullah, Z. Jamaludin, N.A. Rafan, T.S. Chiew, “System
identification and performance analysis of XY t able ballscrew drive system,” in P roc. Interna tiona l Conference on design a nd concurrent engineering (iDECON2012) , Melaka, Malaysia, 2012, pp. 179–187.
[11]L. Abdullah, Z. Jamaludin, N.A. Rafan, T.S. Chiew, “Spectral analysis of cutting forces data for XY table ballscrew drive system
,” in P roc. Interna tiona l Conference on Noise Vibra tion a nd
Control (NVC2012) , Shah Alam, Malaysia, 2012, pp. 78–83. [12]L. Abdullah, Z. Jamaludin, N.A. Rafan, T .S. Chiew and M.Y.