COST ANALYSIS FOR REDUCING TRAFFIC JAM IN CAMPUS (Study Case: UIN Syarif Hidayatullah Jakarta)
Submitted by: Kurniaddin Mahmud
108081100002
DEPARTMENT OF MANAGEMENT INTERNATIONAL-CLASS PROGRAM FACULTY OF ECONOMICS AND BUSINESS
i
Bachelor thesis under the title
COST ANALYSIS FOR REDUCING TRAFFIC JAM IN CAMPUS (Study Case: UIN Syarif Hidayatullah Jakarta)
arranged as one of requirements to attain bachelor degree in Faculty of Economics and Business, State Islamic University Syarif Hidayatullah Jakarta.
Submitted by Kurniaddin Mahmud NIM: 108081100002
is approved by Department of Management, International Class Program, Faculty of Economics and Business, UIN Syarif Hidayatullah Jakarta under the
supervisory of:
Supervisor I
Prof. Dr. Margareth Gfrerer
Supervisor II
Amalia, SE, MSM ID. 197408212009012005
DEPARTMENT OF MANAGEMENT INTERNATIONAL CLASS PROGRAM FACULTY OF ECONOMICS AND BUSINESS
ii
CERTIFICATION OF COMPREHENSIVE EXAM SHEET
On this day, Friday, March 23, 2012, a Comprehensive Examination has been conducted to student:
1. Name : Kurniaddin Mahmud
2. Student Number : 108081100002
3. Department : Management (International Program) 4. Thesis Title : ―COST ANALYSIS FOR REDUCING
TRAFFIC JAM IN CAMPUS (Case Study: UIN Syarif Hidayatullah
Jakarta)‖
By considering the evaluation result of the student during examination, it is decided that the student has passed the Comprehensive Examination and is given opportunity to work for thesis as one of requirements for acquiring the Bachelor of Economics title from the Department of Management, Faculty of Economics and Business, Syarif Hidayatullah State Islamic University Jakarta.
Jakarta, March 23, 2012
Prof. Dr. Abdul Hamid, MS ID. 19570617198503.1.002
(_________________________) Examiner I
Arief Mufraini, Lc., M.Si. ID. 19770122200312.1.000
(__________________________) Examiner II
Dr. Yahya Hamja, MM ID. 194906021978031001
iii
CERTIFICATION OF THESIS DEFENCE EXAM SHEET
On this day, Thursday, June 27, 2013, a Thesis Defense Examination has been conducted to student:
1. Name : Kurniaddin Mahmud
2. Student Number : 108081100002
3. Department : Management (International Program) 4. Thesis Title : ―COST ANALYSIS FOR REDUCING
TRAFFIC JAM IN CAMPUS (Case Study: UIN Syarif Hidayatullah
Jakarta)‖
By considering the evaluation result of the student during examination, it is decided that the student has passed the Thesis Defence Examination and the thesis is accepted as one of requirements for acquiring the Bachelor of Economics title from the Department of Management, Faculty of Economics and Business, Syarif Hidayatullah State Islamic University Jakarta.
Jakarta, June 27, 2013
Leis Suzanawaty, SE, M.Si. ID. 197208092005012004
(_________________________) Chairman
Dr. Ahmad Dumyathi Bashori, MA ID. 19700106200312001
(__________________________) Secretary
Cut Erika A.F., SE, MBA (___________________________) Expert Examiner
Prof. Dr. Margareth Gfrerer (_________________________) Supervisor I
A m a l i a, S E, MSM ID. 197408212009012005
iv
STATEMENT OF THESIS ORIGINALITY
This is to state that, on behalf of myself:
NAME : KURNIADDIN MAHMUD
ID NUMBER : 108081100002
FACULTY : Economics and Business (FEB)
MAJOR : Management (International Program)
I hereby declare that, in writing this thesis, I:
1. Did not use other people’s ideas, unless by such a development and am responsible for it.
2. Did not infringe upon anyone’s copyright.
3. Did not derive other people’s work, unless by attaching the original resource or under the permission of the author.
4. Did not manipulate and fake the data.
5. Am the sole author of this thesis and that no part of this thesis has been published or submitted for publication.
I certify that if at a later date there is any claim from other party on my work, and it has been proven by accountable evidence, found that i have infringed the statement above, I would not mind of being sanctioned under the rules running in the Faculty of Economics and Business UIN Syarif Hidayatullah Jakarta.
Accordingly, this statement was sincerely made.
Jakarta, February 12, 2013
Author
v
CURRICULUM VITAE
Name : Kurniaddin Mahmud
Place, date of birth : Purworejo, 2nd January 1990
Address : Jalan Gunung Rinjani Raya Blok GA 9 No. 5 Villa Tangerang Indah, Gebang Raya, Periuk, Kota Tangerang 15132 – Banten
E-mail : [email protected],
[email protected], Facebook & Twitter : Caesar Asadullah
Cell phone : 0813 9901 3625
Educational Background:
1. TK Islam Baidaul Ahkam, year 1995-1996, Kel. Gebang Raya, Kec. Jatiuwung, Kodya Tangerang
2. SDN Gebang Raya I, year 1996-2002, Kel. Gebang Raya, Kec. Periuk, Kota Tangerang
3. Ma‘had (MTs & MA) Darul Arqam Muhammadiyah Daerah Garut, year 2002-2008, Desa Cimaragas, Kec. Cilawu, Kab. Garut
4. UIN Syarif Hidayatullah Jakarta, International Class Program, Faculty of Economics and Business, year 2008-now
Informal Courses:
1. Practical English Centre (PEC), year 2001-2002
2. Arabic Course, Language Center Ma‘had Darul Arqam Muhammadiyah Daerah Garut, year 2002-2003
3. English Course, Language Center Ma‘had Darul Arqam Muhammadiyah Daerah Garut, year 2003-2004
4. Computer Course (Microsoft Office), Laboratorium Komputer Ma‘had Darul Arqam Muhammadiyah Daerah Garut, year 2003-2004
5. In-Service Training by PUSKADIABUMA in cooperation with Denmark Embassy, Ponpes Cipasung, Tasikmalaya, year 2007
vi
Organizational Experiences:
1. Staff of LPKWU (Lembaga Peningkatan Kewirausahaan) Pimpinan Ranting Ikatan Remaja Muhammadiyah Darul Arqam Garut, year 2002-2003
2. Staff of KPSDM (Kaderisasi Pengembangan Sumber Daya Manusia) Pimpinan Ranting Ikatan Remaja Muhammadiyah Darul Arqam Garut, year 2003-2004
3. Staff of KPSDM (Kaderisasi Pengembangan Sumber Daya Manusia) Pimpinan Ranting Ikatan Remaja Muhammadiyah Darul Arqam Garut, year 2004-2005
4. Staff of KPSDM (Kaderisasi Pengembangan Sumber Daya Manusia) Pimpinan Ranting Ikatan Remaja Muhammadiyah Darul Arqam Putra Garut, year 2005-2006
5. Chief of Korps Muballigh Remaja Pimpinan Ranting Ikatan Remaja Muhammadiyah Darul Arqam Putra Garut, year 2005-2006
6. Chairman of Pimpinan Ranting Ikatan Remaja Muhammadiyah Darul Arqam Putra Garut, year 2006-2007
7. General Treasurer of Asrama Mahasiswa UIN Syarif Hidayatullah Jakarta, year 2008-2009
8. Chief of Bidang Pengkaderan dan Organisasi Pimpinan Komisariat Ekonomi dan Ilmu Sosial IMM (Ikatan Mahasiswa Muhammadiyah) Cabang Ciputat, year 2009-2010
9. Chief of Bidang Organisasi Pimpinan Komisariat Ekonomi dan Ilmu Sosial IMM (Ikatan Mahasiswa Muhammadiyah) Cabang Ciputat, year 2010-2011
10.Staff of LSO Bahasa BEM Jurusan Manajemen FEB (Faculty of Economics and Business) UIN Syarif Hidayatullah Jakarta, year 2010-2011
11.Presidium III Himpunan Mahasiswa Program Kelas Internasional FEB UIN Syarif Hidayatullah Jakarta, year 2008
12.PISCOM (Piety Student Community), year 2011-2012.
Other experiences:
1. Teaching-team of TPA Al-Istiqomah, Villa Tangerang Indah, Kota Tangerang
vii
3. Ambassador of GRLI (Globally Responsible Leadership Initiative), PA-CSR, year 2011
4. Speaker in Seminar Kewirausahaan organized by KKN (Kuliah Kerja Nyata) group of students of UIN Syarif Hidayatullah Jakarta, Kec. Cibadak, Sukabumi, year 2011
5. Pencak Silat Athlete Delegation from Perguruan Sinar Pusaka Putra Garut, Kejuaran PPSI Kabupaten Garut, year 2008
6. Athlete Delegation from Tapak Suci Putera Muhammadiyah Daerah Garut for Kejuaraan Wilayah Tapak Suci Putera Muhammadiyah year 2008 in Bekasi, Jawa Barat.
7. Committee chief of Green Campus UIN Jakarta 2012 event, March-May 2012.
8. Teacher and headmaster of PKBM Lestari, Kampung Utan, Ciputat, Tangerang Selatan, January-July 2012.
viii ABSTRACT
The campus of UIN Syarif Hidayatullah Jakarta is frequented by thousands of people comprising students, lecturers, and others every day. Many of them arrive at the campus by motorcycle. Paths at the campus are jammed by motorcycles. Emergency cars could hardly pass. The space for pedestrian is limited. The air and noise impact the people in campus.
This study has been initiated to find out the needs that the campus could become more environmental friendly. The objective of this research is to contribute to the
Green Campus program by considering the possibility of initiating ‗Bike
-in-University‘ and vegetation program.
This research analyzes the preconditions of the implementation of the Green Campus program by targeting the students and their mobility behaviors to and from the campus, from economics perspective.
This research was firstly presuming that the reasons why students prefer to choose motorcycle or cars instead of bicycle or walking on foot are relating to economic aspects, the distance, the duration of the travel, and the status or lifestyle.
Finally, as the expected result, this projected program may effectively reduces the traffic jam, as well as reduces pollution, inside the university area by moving the parking area into special parking building outside the campus, or/and building dormitories for the students currently using motorcycle to Campus, and may implies to long term benefit for the university and also the academic community in the campus.
ix
ABSTRAK
Kampus UIN Syarif Hidayatullah Jakarta sering dikunjungi oleh ribuan orang yang terdiri dari mahasiswa, dosen, dan lain-lain setiap hari. Banyak dari mereka datang ke kampus dengan sepeda motor. Ruas jalan yang ada di dalam kampus penuh sesak oleh sepeda motor. Mobil yang sedang terburu-buru hampir tidak bisa melintas. Ruang untuk pejalan kaki terbatas. Kondisi udara dan kebisingan mempengaruhi orang-orang di kampus.
Studi ini dilakukan untuk mengetahui pentingnya kampus menjadi lebih ramah lingkungan. Tujuan dari penelitian ini adalah untuk memberikan kontribusi bagi program Green Campus dengan mempertimbangkan kemungkinan untuk mengadakan sepeda kampus dan program penghijauan.
Penelitian ini menganalisis prakondisi pelaksanaan program Green Campus dengan menargetkan mahasiswa dan perilaku mobilitas mereka ke dan dari kampus, dari perspektif ekonomi.
Penelitian ini pertama sekali menganggap bahwa alasan mengapa mahasissiswa lebih suka memilih sepeda motor atau mobil, ketimbang sepeda atau berjalan kaki, adalah berkaitan dengan aspek ekonomi, jarak, lama perjalanan, dan status atau gaya hidup.
Akhirnya, sebagai hasil yang diharapkan, program ini diproyeksikan secara efektif dapat mengurangi kemacetan, juga polusi, di dalam area universitas dengan memindahkan tempat parkir ke gedung parkir khusus di luar kampus, atau/dan membangun asrama bagi para mahasiswa yang menggunakan sepeda motor ke kampus, dan diharapkan pula dapat berimplikasi pada manfaat jangka panjang bagi universitas dan juga komunitas akademis di kampus.
x
FOREWORDS
All praise be to Allah, The Most Glorious and The Most Mercifull, after passing long time period by hard work and support of almost all people around the author, this thesis is finally finished.
This research try to identify the mapping of transportation modality of UIN
Jakarta‘s students and its economics impacts. Hopefully, it could contribute to the development of the Campus in the future.
The author is very gratefull to parties as the following, including those who are not mentioned person per person. The author thanks to:
1. Allah SWT, who always makes the author enjoys the activities, meet the author with kind people, and make all the ways easy to pass. Alhamdu lillaahi Rabbi Al-‗Aalamiin. All praise be to Him, The Essence.
2. Rasulullah SAW who always inspires the author with his entire example. 3. Lovely parents who never stop to pray for the author‘s success; ustadzs and
ustadzahs, teachers, and lecturers who had supplied the author by all beneficial knowledge for worldly life and hereafter.
4. The supervisors: Prof. Dr. Margareth Maria Anna Gfrerer (Mom Margareth), Ibu Amalia, SE, MSM (Bu Amel), who have been patient in guiding the author in the work for this thesis.
5. Technical Coordinator of International Class Program, Pak Arief Mufraini; also his secretary, Ustadz Ahmad Dumyati Bashori; the very kind staff, Bang Sugih Waluya R.
6. Stijn Van Mol, Fauziyah Hasanah, Rabiatul Aulia, Asrina, and all the Green Campus Team who have made a lot of impressive things along this research. 7. Rindana Intan Emelia, who had helped a lot in disseminating the
xi
8. LDK Syahid who had provided support and link to disseminate the questionnaire.
9. Abiler in EDUCARE, Dhersane Pepaya and PISCOM, dhersane‘s imam,
Uray Noviandy Taslim, and other jama‘ats of dhersane Pepaya: Al Akhzar,
Faza, Aa Sulaiman, and especially M. Irhamni Abdul Latief who had delivered help in disseminating the questionnaires.
10. Classmates (batchmates: Fitoy, Gugun, Afiew, Rian, Eko, Mia, Sita, Vivin, Berly, Angga, Royan, Abhi, Rizky, Shinta, Farah, Lucky, Novita), seniors, juniors and all the students of International Program who have prayed for the finishing of this thesis.
11. All people who supported the author by all facilities, who cannot be mentioned one by one, by the author.
The author realized that there must be any imperfection within this research, due to the limitation of the author, eihter in the term of knowledge or ability. Therefore, it is an honor for the author to have any suggestion from anyone to do such improvement and development. Expectedly, there would be any further research in the same field to develop related theme.
Jakarta, February 11, 2013
xii
TABLE OF CONTENT
Cover
Thesis Approval Sheet ... i
Certification of Comprehensive Exam Sheet ... ii
Certification of Thesis Defence Exam Sheet ... iii
Statement of Thesis Originality ... iv
Curriculum Vitae ... v
Abstract .. ... viii
Abstrak ... ix
Forewords ... x
Table of Content ... xii
List of Table ... xv
List of Figure ... xx
List of Appendix ... xxii
CHAPTER I INTRODUCTION ... 1
A.Background ... 1
B. Research Question ... 7
C.Research Objective and Research Benefit ... 7
1. Research Objective ... 7
2. Research Benefit ... 8
CHAPTER II LITERATURE REVIEW ... 9
A.Theories Related ... 9
1. Costs ... 9
2. Benefit ... 11
3. Cost-Benefit Analysis ... 13
4. Green Campus ... 15
B. Previous Research ... 18
C.Logical Framework ... 19
xiii
A.Scope of Research ... 21
B. Sampling Method ... 22
1. Population ... 22
2. Sample ... 23
3. Sample Size ... 24
C.Data Collection Technique ... 25
D. Data Analysis Technique ... 28
1. Data Reduction ... 28
2. Data Display ... 29
3. Conclusion Drawing ... 29
E. Research Instrument ... 31
F. Operational Variable ... 33
CHAPTER IV FINDING AND ANALYSIS ... 37
A.Finding ... 37
B. Analysis ... 46
1. Motorcycle ... 51
2. Public Transportation ... 52
3. Bicycle ... 53
4. On Foot ... 58
5. Car ... 59
6. Other ... 61
7. Maintenance ... 65
C.Evaluation and Interpretation ... 79
1. Recapitulation of Time Consumed and Cost Spent by Respondents ... 79
2. Total Cost and Total Time Spent during the 4 Years of Study 80 3. Opportunity Lost of Respondents ... 81
D. Suggested Alternative Solution ... 82
CHAPTER V CONCLUSION AND IMPLICATION ... 100
xiv
B. Implication ... 102
C.Recommendation ... 104
REFERENCES ... 106
xv
LIST OF TABLE
Number Description Page
Table 2.1 Previous Research Conducted in UIN Syarif
Hidayatullah Jakarta‘s Campus 18
Table 3.1 Comparison of Probability Sampling and
Non-probability Sampling 23
Table 3.2 Determination of Sample Size from a Certain
Population with Standard Error of 1%, 5%, and 10% 24
Table 3.3 Measurement Levels 27
Table 3.4 The variables, subvariables, and indicators of green
campus according to Dr. Arif Zulkifli Nasution 33
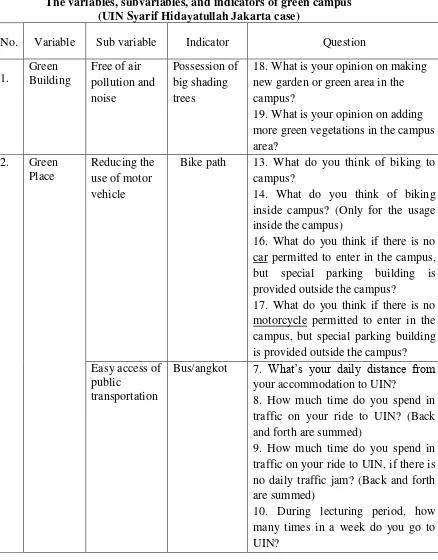
Table 3.5 The variables, subvariables, and indicators of green
campus (UIN Syarif Hidayatullah Jakarta case) 35
Table 4.1 Transportation Choice of Respondents 37
Table 4.2 Reason of Respondents in Choosing Their Means of
Transport 37
Table 4.3 Willingness of Respondents to Take Public
Transportation if Public Transportation is Cheaper 38
Table 4.4 Willingness of Respondents to Take Public
Transportation if Public Transportation is Faster 38
Table 4.5 Respondents Maintenance on Their Means of Transport 39 Table 4.5a1 Vehicle Component Maintained by Respondents 39 Table 4.5b1 Respondents Reason of Maintaining Their Vehicles 39 Table 4.5c1 Respondents‘ Transportation Cost per Year 40
Table 4.5a2 Reason for Not Maintaining 40
Table 4.6 Refueling Habit of Respondents 40
xvi
Table 4.8 Respondents‘ Travel Time to Campus, Including
Traffic Jam 41
Table 4.9 Respondents‘ Travel Time to Campus, Ignoring
Traffic Jam 42
Table 4.10 Respondents‘ Attendance Frequency to Campus 42
Table 4.11 Motorcycle Ownership of Respondents‘ Family 42
Table 4.12 Car Ownership of Respondents‘ Family 43
Table 4.13 Respondents Opinion on Biking (Transporting by Bike)
to Campus 43
Table 4.14 Respondents Opinion on Biking at (inside) Campus 43 Table 4.15 Respondents‘ Transportation Cost per Week 44
Table 4.16 Respondents Opinion on Car-Free Campus 44
Table 4.17 Respondents Opinion on Motorcycle-Free Campus 45 Table 4.18 Respondents Opinion on New Garden Provision in
Campus 45
Table 4.19 Respondents Opinion on Provision of More Vegetation
in Campus 45
Table 4.20 Transportation-Modality Mapping 46
Table 4.21 The Dominant Reason of Respondents in Choosing
Means of Transport 47
Table 4.22 Reasons Mapping on Transportation Choice 47
Table 4.23 Reason of Motorcycle Users 51
Table 4.24 Respondents Reason of Using Public Transportation 52
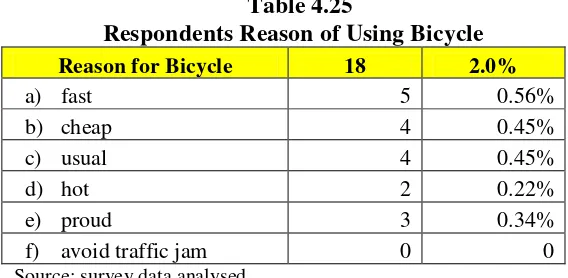
Table 4.25 Respondents Reason of Using Bicycle 53
Table 4.26 Comparison between Motorcycle Speed and Bicycle
Speed 54
Table 4.27 The Speed of Car and Public Transportation 55 Table 4.28 Speed of Walking ―on Foot‖ and ―Other‖ Transportation
xvii
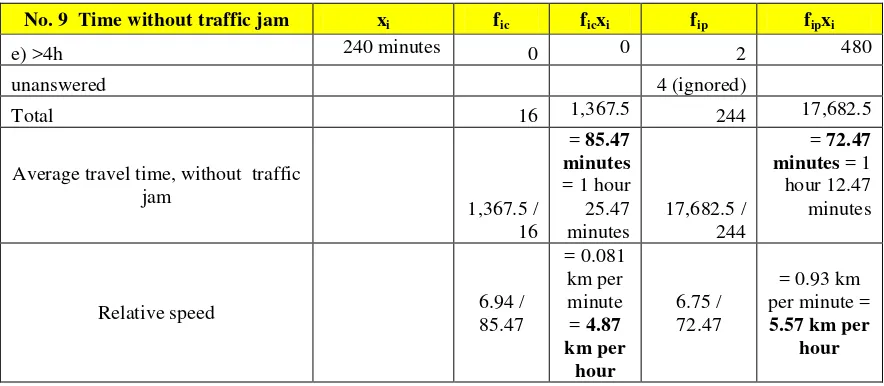
Table 4.29 Recapitulation of Relative Speed 57
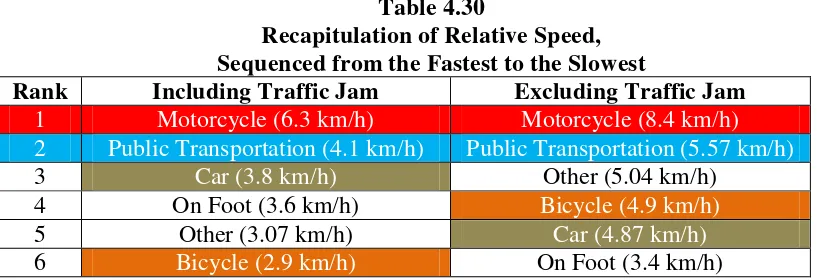
Table 4.30 Recapitulation of Relative Speed, Sequenced from the
Fastest to the Slowest 57
Table 4.31 Respondents Reason of Walking on Foot 58
Table 4.32 Average Distance Taken by Each Transportation Means 59
Table 4.33 Respondents Reason of Using Their Car 59
Table 4.34 Recapitulation of Relative Speed, Sequenced from
the Fastest to the Slowest 60
Table 4.35 Reason of Those Taking Other Transportation Means 61 Table 4.36 Description of Those Taking Other Transportation 61 Table 4.37 Transportation Cost per Week of Those Taking
Other Transportation 63
Table 4.38 Willingness to Take Public Transportation 63 Table 4.39 Comparison between Tendency Take Public
Transportation if It is Cheaper and if It is Faster 64
Table 4.40 Specific Overview of Respondents Who Maintains
and Don‘t Maintain Their Vehicles 65
Table 4.41 Average Annual Maintenance Cost 66
Table 4.42 Average Distance Taken by Respondents 66
Table 4.43 Respondents‘ Average Travel Time if Traffic-Jam
Time is Included 66
Table 4.44 Respondents‘ Average Travel Time, Including & Ignoring Traffic-Jam Time, and Average Time Spent Amid Traffic
Jam 67
Table 4.45 Average of Respondents‘ Attendance Frequency to
Campus 67
Table 4.46 Time-Consumed Comparison between Motorcycle
and Car in Reaching The Campus 69
xviii
Table 4.48 Comparison of Respondents Opinion on Bike to and on
Bike at Campus 71
Table 4.49 Respondents‘ Weighted Average Transportation Cost
per Week 72
Table 4.50 Detail Elaboration of Each Level of Weekly
Transportation Cost 73
Table 4.51 Detail Elaboration of Each Level of Weekly
Transportation Cost, by Ignoring Those Walking 74 Table 4.52 Weighted Average Transportation Cost, Ignoring
Those Walking 75
Table 4.53 Weighted Average Transportation Cost, Ignoring Those
Walking and Those Using Bicycle 75
Table 4.54 Summary of Average Costs and Average Time
Spent by Respondents 79
Table 4.55 Estimated Maintenance, Transportation, Parking Costs
Spent by Motorcycle Users 81
Table 4.56 Estimated Maintenance, Transportation, Parking Costs
Spent by Car Users 81
Table 4.57 Growth of UIN Jakarta‘s Graduates 84
Table 4.58 UIN Jakarta‘s Graduates Growth 85
Table 4.59 UIN Jakarta‘s Graduates Descriptive Statistic Summary,
by MS Excel 85
Table 4.60 Forecasted Growth of Graduates from 2013 to 2017 86 Table 4.61 Forecasted Transportation Modality of UIN Jakarta‘s
Students in the Highest, Base, and Lowest Possible Case 88
Table 4.62 Type of Vehicle and Parking Space Unit 90
xix
2005 to 7th March 2013 92
Table 4.65 Payback Period and Discounted Payback Period
of Parking Building 94
Table 4.66 Forecasted Operational Cost of Dormitories 96
Table 4.67 Payback Period and Discounted Payback Period
xx
LIST OF FIGURE
Number Description Page
Figure 1.1 Banner of Bike@Campus ITB 3
Figure 1.2 Announcement Displayed in Bike Shelter of IPB 5
Figure 1.3 Procedures of Bike Borrowing in IPB 5
Figure 1.4 Borrowing Form of IPB‘s Bikes 6
Figure 1.5 Returning Form of IPB‘s Bikes 6
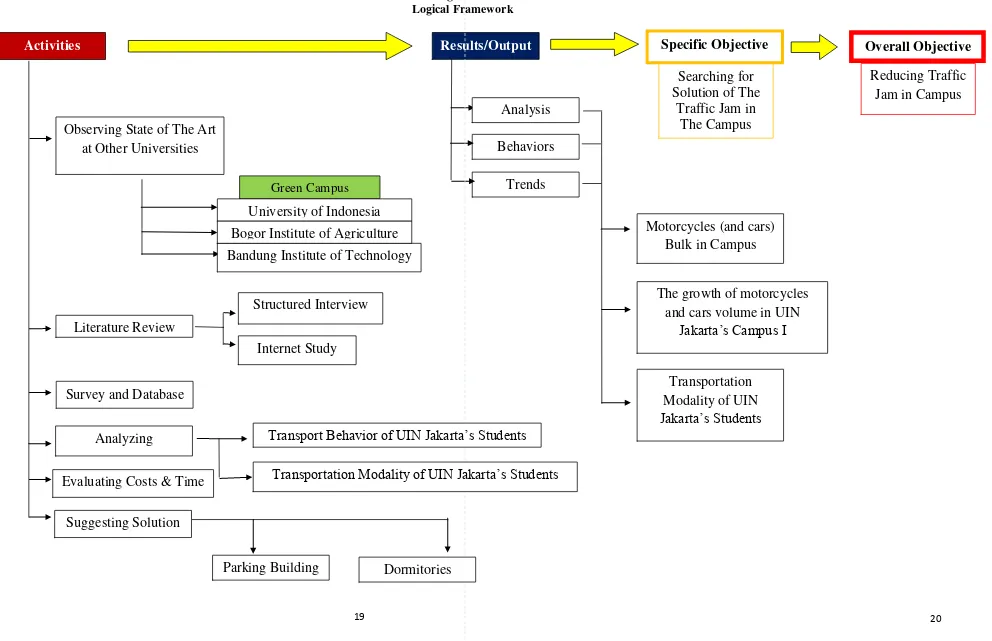
Figure 2.1 Logical Framework 19
Figure 3.1 Illustration of Data Analysis Comprising Data
Reduction, Data Display, and Conclusion Drawing 30
Figure 4.1 Trend of Transportation Choice 46
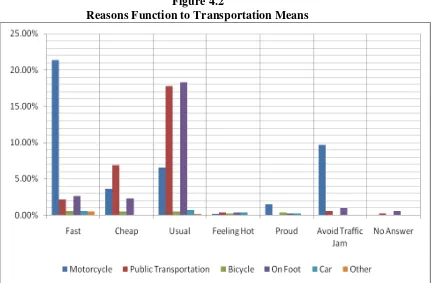
Figure 4.2 Reasons Function to Transportation Means 49
Figure 4.3 Transportation Means Function to Reasons 50
Figure 4.4 Respondents Reasons of Choosing Motorcycle 51
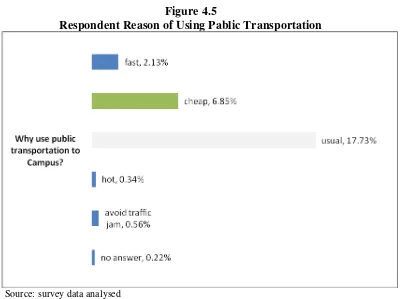
Figure 4.5 Respondent Reason of Using Pablic Transportation 52 Figure 4.6 Respondents Reason of Using Bicycle to Campus 53 Figure 4.7 Respondents Reason of Walking on Foot to Campus 58
Figure 4.8 Respondents Reason of Using Car to Campus 59
Figure 4.9 Comparison between Tendency to Take Public
Transportation if It is Cheaper and if It is Faster 64
Figure 4.10 Motorcycle Ownership of Respondents Family 68
Figure 4.11 Car Ownership of Respondents Family 69
Figure 4.12 Respondents Family Ownership of Motorcycle and
Car, In Comparison 71
Figure 4.13 Comparison of Respondents Opinion on Bike to and on
Bike at Campus 72
Figure 4.14 Comparison of Respondents Opinion on
xxi
Figure 4.15 Respondents‘ Opinion on New Gardens Provision in
UIN Syarif Hidayatullah Jakarta‘s Campus 77
Figure 4.16 Respondents‘ Opinion on More Vegetations Provision in
UIN Syarif Hidayatullah Jakarta‘s Campus 78
Figure 4.17 Parking Cost in UIN Jakarta 80
Figure 4.18 Growth of UIN Jakarta‘s Graduates 85
Figure 4.19 The Rough Forecast on the Growth of Total Students in
Few Years Later 87
xxii
LIST OF APPENDIX
Number Description Page
Appendix 1: Questionnaire Structure 113
Appendix 2: Result of Questionnaire Dissemination
(Absolute and Relative Number), TOTAL 116
Appendix 3: Result of Questionnaire Dissemination
(Absolute and Relative Number), Motorcycle 120
Appendix 4: Result of Questionnaire Dissemination
(Absolute and Relative Number), Public Transportation 124
Appendix 5: Result of Questionnaire Dissemination
(Absolute and Relative Number), Bicycle 128
Appendix 6: Result of Questionnaire Dissemination
(Absolute and Relative Number), On Foot 132
Appendix 7: Result of Questionnaire Dissemination
(Absolute and Relative Number), Car 136
Appendix 8: Result of Questionnaire Dissemination
(Absolute and Relative Number), Other 140
Appendix 9: Grand Mapping 144
Appendix 10: Observation Photos 152
1 CHAPTER I
INTRODUCTION
A. Background
Year by year, the number of students of State Islamic University (UIN) Syarif Hidayatullah Jakarta increases. Based on UIN Syarif Hidayatullah
Jakarta‘s website, www.uinjkt.ac.id, accessed on 26th March, 2012, nowadays, the number of students of UIN Syarif Hidayatullah Jakarta has reached 23,000 and in average, there is an annual increase of around 4,000
students.
This increase factually implies to the increase of the number of motorized
vehicles coming in to and out from the campus of UIN Syarif Hidayatullah Jakarta. While, the volume of vehicles brought by the students to the campus gets denser every year, and impacts the paths inside the campus I. Parking
areas are extended to the paths, dominantly by motorcycle. Dr. Lily Surayya Eka Putri, M.Env.Stud., et. al. (2011: 32) within Strategi Pengembangan UIN
Syarif Hidayatullah Jakarta Menuju Eco-Campus revealed, in 2007, total amount of motorcycles (plus cars) coming into campus I UIN Syarif Hidayatullah Jakarta is only 1152. Meanwhile, a very surprising number is
there in 2011, when the total amount of motorcycles (plus cars) entering the campus I is 3552, which means an increase of 220%.
2
In preparing the needs-analysis and the following research for the UIN
Jakarta‘s Campus, the campuses of University of Indonesia, Agricultural
Institute of Bogor, and Technology Institute of Bandung were visited.
The field observation at the Campus of University of Indonesia (UI) was
scheduled for Friday, 10th February 2012.
The implementation of bike-in-campus in UI is well managed. Students are using the bicycle to reach the different faculties and other buildings in the
Campus area. It seems the success of the implementation of bike-in-campus is because of the infrastructure:
1) The spacious area and a bit turned from the main street impacts the roadway inside the university is much more quite of cars, motorcycle, and other vehicles.
2) Special lane for bike is available in some areas inside the Campus, and even for some places without any bike lane, because the street is quiet and
very few cars and motorcycles passing, the bikers can pass the street easily to reach the destination place.
3) Because the area of the university is very much huge, and taking much
more minutes to walk, so then the huge number of students who‘s not
having their own vehicles are very much supported with the existence of
bikes in campus.
3
This university started Bike@Campus program on July 10, 2010 with 20 bikes. An upgrading to 90 bikes followed during July to August 2010. In the
period of September to December 2010 the program was in the phase of stabilization and consolidation.
Figure 1.1
Banner of Bike@Campus ITB
Source: researcher‘s photo collection, captured from the banner displayed in ITB (Bandung Institute of Technology)
At the campus, interviews with some students were conducted. The following points were highlighted:
1) The number of bikes supplied is less than the amount needed, so it doesn‘t fit with the demand at the Campus. As a result, most students choose
walking to reach their faculties or other buildings.
2) Some bikes are locked and not useful for students. Walking, as students are saying, is no matter for them because the area of the university is not
4
5 to 10 minutes from the gate. Besides, walking is much simpler than using a bike for such short distances because there are only two bike
shelters inside the university. The time students could save when taking a bicycle is minimal.
3) Due to the fact that most students prefer walking, only a small number of bikes is used. However, the usage is usually only for carrying heavier stuffs, not for daily transport inside the Campus. Some students have
admitted to use the bike only for having fun in the break time.
The field observation at the Bogor Institute of Agriculture (IPB) was
scheduled on Monday, 20th February 2012.
In IPB, the officers/keepers of the bike shelter were interviewed. The shelter keepers explained that bikes at the premises of the Campus were
launched four years ago, in cooperation with BNI (Bank Nasional Indonesia). BNI supplied 300 bikes and the university itself supplied another 200 bikes
and later another 500 bikes, which means there are 1,000 bikes available in total, distributed into nine shelters that are also built by the sponsor of BNI. Each shelter is managed by two officers/keepers.
The procedures of borrowing and returning back the bikes are well administered. By filling ID number and other identity on the blank form, the
5 Figure 1.2
Announcement Displayed in Bike Shelter of IPB
Source: researcher‘s photo collection, captured from the announcement displayed in a bike shelter, in IPB (Bogor Institute of Agriculture)
Figure 1.3
Procedures of Bike Borrowing in IPB
6 Figure 1.4
Borrowing Form of IPB’s Bikes
Source: researcher‘s photo collection, captured from the announcement displayed in a bike shelter, in IPB (Bogor Institute of Agriculture)
Figure 1.5
Returning Form of IPB’s Bikes
Source: researcher‘s photo collection, captured from the announcement displayed in a bike shelter, in IPB (Bogor Institute of Agriculture)
The insight to the UI, ITB, and IPB campus biking allows comparing with
the situation at UIN and leads to the following prerequisites: Spacious area
Appropriate ratio of bike-to-student (enough supply of bike, that meet the
7
Due to that, now then researcher tries to identify the possibility to reduce traffic jam in UIN and identify the costs students of UIN should pay with the
current condition (time costs and monetary costs).
B. Research Question
This research follows the concept of a descriptive study that is question related to independent variable, either only one single variable or more, in which the researcher is neither comparing the variable to other samples, nor
researching for the correlation of the variable with another variable (Sugiyono, 2012: 35).
The question is:
What are the economic implications (transportation costs) for individual student while reducing the traffic jam at Campus, and what is a possible
solution?
C. Research Objectives and Research Benefits
1. Research Objectives
a. To examine the possibilities at the UIN premises to become a Green Campus, at least reducing the traffic jam in the Campus.
b. To know the trend of transportation modality of UIN Jakarta‘s students
8
d. To propose the Campus management a benefitting solution for students and campus, in terms of transportation, and, especially,
economic condition.
2. Research Benefits
a. Benefits for the researcher
1)This research could become a scientific writing work in economic field, related to the one of issues in UIN Syarif Hidayatullah
Jakarta.
2)This research could become the learning process in term of theories
application in the field.
b. Benefit for the campus
1)This research could become a recommendation for the university
management to develop a modern and cost efficient Campus mobility system.
2)To enrich the literature collection with a case study on a Campus breakthrough.
c. Benefits for students
1) To elaborate the baseline for the continuous research on the economic-of-traffic issues at the Campus.
9 CHAPTER II
LITERATURE REVIEW
A. Theories Related
1. Costs
Referring to Lewin (1982: 218-219), the term ―cost‖ applied by most economists refers to what is often loosely called ―opportunity cost‖.
Peter Lewin, as as an Assistant Professor of Economics and Political
Economy at The University of Texas at Dallas, within Journal ―Pollution
Externalities: Social Cost and Strict Liability‖, Cato Journal, Vol. 2, No. 1
(Spring 1982), also explained, that:
―Opportunity cost correctly understood refers to the individual
decision-making process. In making a rational choice at a point of
time, the individual must weigh the perceived alternatives. The cost of choosing any alternative is related to the opportunities
sacrificed by forgoing all the others and may be expressed as the utility forgone on the next best alternative. From this point of view, three propositions about cost follow. 1] Cost is borne exclusively
by the decision-maker. Obviously, one person‘s decision may influence the costs borne by another but, if understood correctly,
10
utility concept is to be maintained. Second, cost implies subjective expectations. It refers to the perceived alternatives; it relates to an
imagined future. The alternatives at any point of time exist only in the mind of the decision maker, and although there may be some
degree of consensus concerning hypothetical imagined future prospects, there almost certainly will remain a divergence of expectations. Thus, costs cannot be measured by an outside
observer. 3] Cost is unrealizable. Once a choice is taken, the hypothetical imagined future evolves with time into the actual
future and the displaced alternatives cease to exist.‖
Victoria Transport Policy Institute (2011), throughout its release within Transportation Cost and Benefit Analysis II – Air Pollution Costs
in www.vtpi.org/tca/tca0510.pdf, explained that,
―Air pollution cost refers to motor vehicle air pollutant
damages, including human health, ecological, and aesthetic degradation.
Vehicle air pollution costs vary depending on vehicle, fuel, and travel condition. Larger, older and diesel vehicles, and those with ineffective emission controls have higher emission costs.
Air pollution emissions are an external cost, and therefore inequitable and inefficient. Lower-income people tend to have relatively high emission vehicles, so emission fees or restrictions tend to be regressive, but many lower-income people experience heavy exposure to air pollutants, and so benefit from emission
11
Thus, according to such statements revealed above, the cost, especially within this research, is subjective, depends to the interest of the decision-maker,
and in this research it tends to be much perceived as ―opportunity cost‖.
2. Benefit
According to http://www.thefreedictionary.com/benefit, benefit could means: good, use, help, profit, gain, advantage, favour, reward, utility, merit, boon, mileage, advantage, interest, aid, gain, favour, assistance, betterment.
Besides, benefit also defined as: a. welfare
b. goodness, good - that which is pleasing or valuable or useful c. advantage, reward - benefit resulting from some event or action Khusnul Khotimah, et. al., (2002:24, 26) stated that the objective of
conducting a project is to gain benefit by spend the budget as efficient and effective as possible. Benefit of a project comprises direct benefit, indirect
benefit, and intangible benefit.
Furthermore, the benefit of project can be classified as follow (Khusnul Khotimah, et. al.,2002: 35-37)
Benefit of a project comprises: a. Direct benefit,
12
(1) Direct benefit could be in the form of:
a. Output-value improvement, that could because of
1) Physical-product improvement 2) Product quality improvement
3) Change in time and location
4) Change in the shape (grading and processing) b. Cost decrease, that could be:
1) Benefit of mechanism, that could cause a decrease of product unit cost.
2) Decrease in transportation cost
3) Decrease or avoidance of disadvantages
(2) Indirect benefit or secondary benefit of a project is benefit/advantage
exists or gained outside the project due to the implementation of a project. There are three kinds of indirect/secondary benefit, that are:
a. Benefit induced by the existence of project that is usually known as ―multiplier effect‖ of a project.
b. Benefit caused by economic of scale.
c. Benefit induced by dynamic secondary effects, such as a change in productivity of manpower, caused by improvement
of health and education.
13
b. Improvement of view by the existence of beautiful gardens; c. Improvement of income distribution;
d. National integration;
e. National defense improvement, and so forth.
3. Cost Benefit Analysis
According to Aula Ahmad Hafidh (2010), cost-benefit analysis ―is applied for environmental issues, such as pollution, related to both
monetary and nonmonetary, cost and benefit. It is then linked to externality. The monetary value within cost-benefit analysis reflects
individual‘s or public‘s preference, which is expressed in ―willingness to
pay‖.‖
Ahmad Hafidh (2010) also elaborated that,
―cost-benefit analysis is used to evaluate the consumption of
economic resource to be efficient, without considering the
distribution, economic stability, etc.‖
Textually, based on Ahmad Hafidh (2010), cost-benefit analysis evaluates loss or gain of a program, plan, or project, by considering the
costs to expend and the benefit to yield.
- Feasibility Study
Khusnul Khotimah et al. (2002) elaborated that,
―Project is a series of planned-activities with such inputs, to
14
project, doing an evaluation or analysis is an obligation. Analysis or evaluation is an assessment to consider and to
compare the benefit(s) and the cost(s) of the project. This evaluation or analysis can be used as a planning tool within
decision-making process, whether the project is applicable or not, beneficial or not, either for the project-owner‘s interest or the parties getting involved within the project. The evalution of
project is identical to the feasibility study.‖
Under Jordan (2002),
―A feasibility study is an abbreviated form of systems analysis
that is intended to determine whether a system project should be pursued, which be accomplished with personal interviews
and record search. The type of feasibility that has always been
of most importance to management has been ―economic
feasibility‖—the ability of a system to pay for itself in
monetary terms.‖
Rajan, et al. (2006: 6) elaborated that, cost-benefit analysis is process
of comparing benefits (often measured in savings or increased profits) with costs associated with a proposed change within an organization.
15
primarily motivated by self-interest, making decisions that maximize their welfare. Benefit-cost analysis often involves valuing nonmarket outcomes
such as reductions in health and environmental risks. Benefit-cost analysis traditionally uses exponential discounting to reflect time preferences.
Benefit-cost analysis can be best viewed as a pragmatic framework for collecting, organizing, and evaluating relevant information.
Van Derbeck (2010: 532) explained that, cost-benefit decision is a
decision as to whether the benefit received from pursuing a certain course of action exceeds the costs of action.
Under Richard N. Langlois (1982), cost-benefit techniques operate by
disassembling the effects of a ‗‗social decision‘‘ into its component parts,
ascertaining the benefit or cost of each part, and then totaling up the
results. This procedure obscures and does violence to the very complex and not fully measurable web of social valuation that actually underlies the
problem. In particular, the cost-benefit technique is ad hoc and ahistorical; it is concerned only with the goal of maximization, relegating all else — including human rights — to the derivative status of means toward that
end.
4. Green Campus
16
of planning, as explained by Toor and Havlick (2004) within Panitat (2012), campus has a mixed use of educational area, recreational area,
residential area, and commercial area which facilitate short distance walking in particularly the movement from routine area to gathering places
such as library, canteen, sport complex, and lecture hall.
Concerning the Green Campus, as accessed at
http://www.neiwpcc.org/neiwpcc_docs/greenbk.pdf, a collaborative effort
by US Environmental Protection Agency (EPA) Region 1, the New England Interstate Water Pollution Control Commission and
Environmental Training Center (NEIWPCC/NEIETC), and the Northeast Partnership for Environmental Technology Education (NEPETE) within
―Greening the Campus: Where Practice and Education Go Hand in
Hand”, elaborated as follow.
―In addition to being learning centers, college and university
campuses are self-contained communities that are supported by vast systems of institutional and operational functions.
A Green Campus is one that carries out these functions according to a system-wide culture of environmental sustainability, balancing function and design with existing and foreseen resources.
17
environmental community where operational functions, business practices, academic programs, and people are
interlinked, providing educational and practical value to the institution, the region, and the world.‖
According to Dr. Arif Zulkifli Nasution, an environmentalist, in his writing, http://bangazul.blogspot.com/2012/09/green-campus.html, Green Campus is system of educational approaches, community-service research,
and environment-friendly location, involving campus civitas in environment activity, which has to imply positively to the environment,
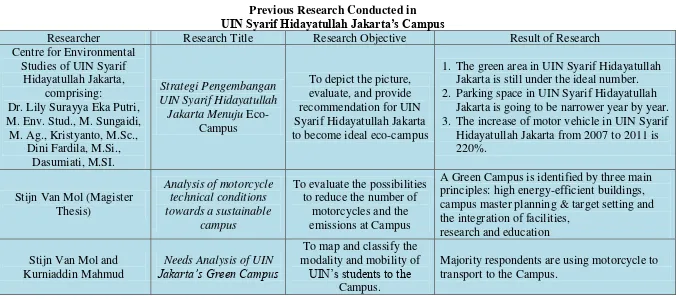
18 B. Previous Research
Table 2.1
Previous Research Conducted in UIN Syarif Hidayatullah Jakarta’s Campus
Researcher Research Title Research Objective Result of Research
Centre for Environmental Studies of UIN Syarif
Hidayatullah Jakarta, comprising:
Dr. Lily Surayya Eka Putri, M. Env. Stud., M. Sungaidi,
M. Ag., Kristyanto, M.Sc., Dini Fardila, M.Si.,
To depict the picture, evaluate, and provide recommendation for UIN Syarif Hidayatullah Jakarta to become ideal eco-campus
1. The green area in UIN Syarif Hidayatullah Jakarta is still under the ideal number. 2. Parking space in UIN Syarif Hidayatullah
Jakarta is going to be narrower year by year. 3. The increase of motor vehicle in UIN Syarif
Hidayatullah Jakarta from 2007 to 2011 is 220%.
Stijn Van Mol (Magister Thesis)
Analysis of motorcycle technical conditions towards a sustainable
campus
To evaluate the possibilities to reduce the number of
motorcycles and the emissions at Campus
A Green Campus is identified by three main principles: high energy-efficient buildings, campus master planning & target setting and the integration of facilities,
research and education
Stijn Van Mol and Kurniaddin Mahmud
Needs Analysis of UIN Jakarta‟s Green Campus
To map and classify the modality and mobility of
UIN‘s students to the
Campus.
18
The growth of motorcycles
and cars volume in UIN
Jakarta‘s Campus I
Green Campus
Activities
Observing State of The Art
at Other Universities
Survey and Database
Analyzing
Evaluating Costs & Time
Suggesting Solution
Transportation Modality of UIN Jakarta‘s Students
Transport Behavior of UIN Jakarta‘s Students
Literature Review
Structured Interview
Internet Study
University of Indonesia
Bandung Institute of Technology
Bogor Institute of Agriculture
21 CHAPTER III
RESEARCH METHODOLOGY
A. Scope of Research
1. Research Location
Location of research is in campus I UIN Syarif Hidayatullah Jakarta.
2. Time of Research
Time of research is during February, March, and April 2012.
3. Field Research
Field research is conducted in order to obtain primary data directly from
students at UIN Jakarta. a. Observations
Observations have been conducted to see the implementation of the
different Bike in Campus programs, at UI, IPB, and ITB, as benchmarks to analyze the supporting factors and threatening factors
toward the Bike in Campus program at those universities. But, this observation is not the core research, unless merely an unspecified descriptive observation (see Sugiyono, 2012: 230), as a complement
toward the core research. b. Interviews
22
Campus programs at their campus and to learn about supporting and threatening factors.
c. Questionnaire
In this research, around 1,000 questionnaires are disseminated
randomly among students of UIN Syarif Hidayatullah Jakarta, to see the trends and tendency of the students at the Campus, in the term of the choice of transportation means, reasons, where they refuel and
maintain their vehicles, their transportation and maintenance cost, and their opinion on green campus. Some sheets of the questionnaires are
disseminated online via internet, but mostly are disseminated offline toward the students.
B. Sampling Method
1. Population
Population is the location of generalization comprising object and
subject with certain quality and characteristics determined by the researcher to be learnt and then concluded (Sugiyono, 2012: 80). The population of this research are all the students of UIN Jakarta, campus I
23 2. Sample
Sample is part of the amount and characteristics owned by the
population (Sugiyono, 2012: 81).
The withdrawal of sample within this research is done with
nonprobability sampling. Nonprobability sampling is a sampling technique that does not give equal opportunity for each element or members of the population to be selected as sample. (Sugiyono, 2012: 301).
Table 3.1
Comparison of Probability Sampling and Non-probability Sampling
Consideration Sampling Design
Probability Non-probability Jakarta: Erlangga, 2003, p. 111.
Specifically, the nonprobability sampling used within this research is convenience sampling which refers to the collection of information from members of the population who are conveniently available to provide it
(Uma Sekaran, 2009: 276).
Convenience sampling is the procedure to obtain sample unit
24
Convenience sampling is most often used during the exploratory phase of a research project and is perhaps the best way of getting some
basic information quickly and efficiently (Uma Sekaran, 2009: 276).
3. Sample Size
The sample size of this research is determined in accordance with the table of sample size determination revealed by Sugiyono (2012: 87). Within this research, standard error of 1% is used, meaning that the
confidence level is 99%. This satandard error is chosen as an effort to minimize a nonrepresentativeness within the sample witdrawn. The
following table is the developed from Isaac and Michael formula is below:
S =
Table 3.2
Determination of Sample Size from a Certain Population with Standard Error of 1%, 5%, and 10%
P = probability of accuracy (0.5) Q = probability of error (0.5)
25
Source: Sugiyono, 2012: 87, tabel 5.1 penentuan jumlah sampel dari populasi tertentu dengan taraf kesalahan 1%, 5%, dan 10%.
The table above requires 642 samples for 20,000 population and 649 samples for 30,000 population. Even, for unlimited population, there are only
664 samples required. In this research, due to the population of 23,000, so then the sample size required is between 642 and 649, to stay in standard error
of 1%. Therefore, the questionnaires are disseminated to 1,000 respondents, while the returned questionnaires are only 891.
C. Data Collection Technique
Due to the fact that this research is a descriptive research, therefore the data is typically collected through a questionnaire survey, interviews,
26
Survey is general category which comprises questionnaires and interviews as specific methodologies used to conduct survey research. Surveys may be, and
usually, are sample surveys. In a sample survey, the researcher infers information about a population of interest based on the responses of a sample
27
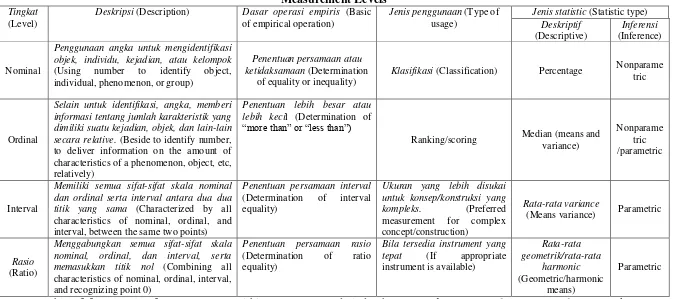
Below are levels of measurement
Table 3.3 Measurement Levels
Tingkat (Level)
Deskripsi (Description) Dasar operasi empiris (Basic of empirical operation)
Jenis penggunaan (Type of usage)
Jenis statistic (Statistic type) Deskriptif
(Descriptive)
Inferensi (Inference)
Nominal
Penggunaan angka untuk mengidentifikasi objek, individu, kejadian, atau kelompok (Using number to identify object, individual, phenomenon, or group)
Penentuan persamaan atau ketidaksamaan (Determination
of equality or inequality)
Klasifikasi (Classification) Percentage Nonparame tric
Ordinal
Selain untuk identifikasi, angka, memberi informasi tentang jumlah karakteristik yang dimiliki suatu kejadian, objek, dan lain-lain secara relative. (Beside to identify number, to deliver information on the amount of characteristics of a phenomenon, object, etc, relatively)
Penentuan lebih besar atau lebih kecil (Determination of
―more than‖ or ―less than‖)
Ranking/scoring Median (means and
variance)
Nonparame tric /parametric
Interval
Memiliki semua sifat-sifat skala nominal dan ordinal serta interval antara dua dua titik yang sama (Characterized by all characteristics of nominal, ordinal, and interval, between the same two points)
Penentuan persamaan interval (Determination of interval equality)
Ukuran yang lebih disukai untuk konsep/konstruksi yang kompleks. (Preferred measurement for complex concept/construction)
Rata-rata variance
(Means variance) Parametric
Rasio (Ratio)
Menggabungkan semua sifat-sifat skala nominal, ordinal, dan interval, serta memasukkan titik nol (Combining all characteristics of nominal, ordinal, interval, and recognizing point 0)
Penentuan persamaan rasio (Determination of ratio equality)
28 D. Data Analysis Technique
Susan Stainback in Sugiyono (2012: 243), explained that, ―There are no
guidelines in qualitative research for determining how much data and data
analysis are necessary to support an assertion, conclusion, and theory‖.
Regarding the analysis of qualitative data, Bogdan in Sugiyono (2012:
244) revealed that, ―Data analysis is the process of systematically searching
and arranging the interview transcripts, field notes, and other materials that
you accumulate to increase your own understanding of them and to enable you
to present what you have discovered to others‖.
Spradley in Sugiyono (2012: 244) elaborated that, ―Analysis of any kind involves a way of thinking. It refers to the systematic examination of something to determine its parts, the relation among parts, and the relationship
to the whole. Analysis is a search for patterns‖.
Data analysis within this research is inductive, that is an analysis based on
data obtained.
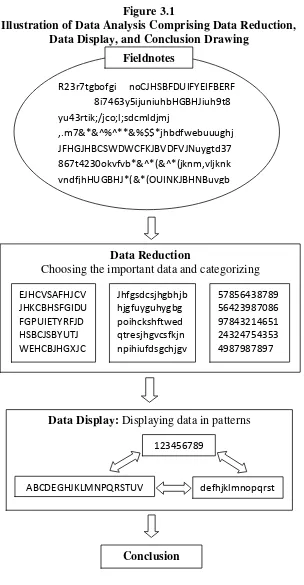
According to Miles and Huberman, in Sugiyono (2012: 246), activities within data analysis comprise data reduction, data display, and conclusion
drawing.
1. Data Reduction
29 2. Data Display
The display of data shows the previous development of data and allows
an analysis of the data, which subsequently leads to a forecast of the future development.
Miles and Huberman in Sugiyono (2012: 249) suggested using graphic, matrix, network, and chart, beside narrative text, in order to
display data.
3. Conclusion Drawing
Qualitative research describes new findings, which have not been
analyzed before. The finding could be a description of an object that was unclear before then become clear after investigation and analysis, and could also be a causal relationship, interactive, hypothesis, or theory.
Below is the illustration of data reduction, data display, and conclusion
30 Figure 3.1
Illustration of Data Analysis Comprising Data Reduction, Data Display, and Conclusion Drawing
Source: Illustration of data reduction, data display, and verification (Sugiyono, 2012: 248)
Choosing the important data and categorizing
EJHCVSAFHJCV
Data Display: Displaying data in patterns
123456789
ABCDEGHJKLMNPQRSTUV defhjklmnopqrst
31 E. Research Instrument
There are two factors determining the quality of research results, those are,
quality of research instrument and quality of data collection.
Sugiyono (2012: 222) revealed that, within qualitative research, the
instrument is the researcher himself. Thus, the researcher as the research instrument also must be validated how far he or she is ready to conduct the research, academically and logistically. Validation is done by the researcher
himself, by evaluating the preparation of qualitative method, theory comprehension, knowledge about research object, and the logistics.
Qualitative researcher as the human instrument, as insisted by Sugiyono (2012), functions to determine research focus, to select the informants as data resources, to collect data, to assess the data quality, to analyze the data, to
interpret the data, and to draw the conclusion of the findings.
In viewing the reality, according to Sugiyono (2012), qualitative research
assumes that reality is holistic, dynamic, and inseparable into variables. Hence, within qualitative research, the researcher is the key instrument.
Lincoln and Guba in Sugiyono (2012) wrote,
―The instrument of choice in naturalistic inquiry is the human. We
shall see that other forms of instrumentation may be used in later phases of the inquiry, but the human is the initial and continuing mainstay. But if the human instrument has been used extensively in earlier stages of inquiry, so that an instrument can be constructed that
32
Under Nasution (1988) in Sugiyono (2012: 224), there are seven characteristics of the researcher as research instrument, as the following:
1. Researcher as an instrument is sensitive and can react to any stimulus
from the environment that must be assessed meaningful or not for the research.
2. Researcher as an instrument can adapt to all aspects of the
circumstances and may collect a variety of data at once.
3. Each situation is a whole. There is no instrument in the form of tests or
questionnaires that can capture the whole situation, except human.
4. A situation involving human interaction cannot be understood by mere
knowledge. To understand, we have to frequently feel it, into it, based on our knowledge.
5. Researcher as instrument can quickly analyze the data obtained.
Researcher can interpret and make a hypothesis immediately to
determine the direction of observation, to test the hypotheses that arise immediately.
6. Only human beings as instruments that can draw conclusions based on
data collected at one time and used immediately as a reversal to obtain
confirmation, alteration, or repair.
7. In the study using a test or quantitative questionnaire the preferred is
response that can be quantified in order to be processed statistically, while deviating from it was ignored. With the human as instrument, in
33
attention. Another response than others, even to the contrary is used to enhance the level of trust and the level of understanding of the aspects
studied.
As an auxiliary instrument, a structured interview consisting of
questions arrangement is set, as the following.
F. Operational Variables
The variables, subvariables, and indicators of green campus according to
the writing of Dr. Arif Zulkifli Nasution, an environmentalist, in his writing, http://bangazul.blogspot.com/2012/09/green-campus.html, are as the following.
Table 3.4
The variables, subvariables, and indicators of green campus according to Dr. Arif Zulkifli Nasution
No. Variable Sub variable Indicator Researchable Criteria
1. Green Building
Building materials
Not containing B3 Containing
Recyclable building materials
Supply chain system of building management
Reusable material Promotion tools, such as leaflet, brochure,
34
No. Variable Sub variable Indicator Researchable Criteria
learning and Optimal biopori hole to
absorp rainwater street in the campus Sidewalks along the
street in the campus Easy access of
Optimal time to reach any public transportation
Usage of local material Optimum exposure and
power-efficient electronic equipment Reducing abstraction of
groundwater.
Environment education to the society
―Save Our Planet‖ exhibition
35
However, within this research, we limit as the following Table 3.5
The variables, subvariables, and indicators of green campus (UIN Syarif Hidayatullah Jakarta case)
No. Variable Sub variable Indicator Question
1.
18. What is your opinion on making new garden or green area in the campus?
19. What is your opinion on adding more green vegetations in the campus area? provided outside the campus?
17. What do you think if there is no motorcycle permitted to enter in the campus, but special parking building is provided outside the campus? Easy access of your accommodation to UIN?
8. How much time do you spend in traffic on your ride to UIN? (Back and forth are summed)
9. How much time do you spend in traffic on your ride to UIN, if there is no daily traffic jam? (Back and forth are summed)
36
No. Variable Sub variable Indicator Question
3. Green transportation, if it is cheaper than private vehicle?
4) Would you prefer the public transportation, if it is faster than private vehicle?
5) Do you often maintain your vehicle, especially motorcycle? 5a1) What is maintained?
5b1) If yes, why?
5c1) How much is spent for maintenance work a year? 5a2) If no, why not?
37 CHAPTER IV
FINDING AND ANALYSIS
A. Findings
In the following are the findings from the questionnaires disseminated
in campus I UIN Syarif Hidayatullah Jakarta (UIN). Around 3.87% of
UIN‘s students participated in fulfilling the structured interview.
Question 1: Apakah alat transportasi yang paling sering Anda
gunakan untuk datang ke kampus?(What do you usually chose as your means of transportation to UIN, mostly?)
Table 4.1
Transportation Choice of Respondents
No. 1 Transportation choice From 891 respondents 100.0%
a) motorcycle 380 42.6%
b) public transportation 248 27.8%
c) bicycle 18 2.0%
d) on foot 224 25.1%
e) car 16 1.8%
f) other 5 0.6%
Source: survey data processed
Question 2: Apa alasan Anda memilih alat transportasi tersebut?
(What is the reason for your transportation choice?)
Table 4.2
Reason of Respondents in Choosing Their Means of Transport No. 2 Reason From 891 respondents 100.0%
a) fast 246 27.6%
b) cheap 117 13.1%
c) usual 390 43.8%
d) hot 12 1.3%
e) proud 20 2.2%
38 No. 2 Reason From 891 respondents 100.0%
Unanswered 7 0.8%
Source: survey data processed
Question 3: Apakah Anda akan lebih memilih transportasi umum, jika itu akan lebih murah dari kendaraan pribadi? (Would you prefer the
public transportation, if it is cheaper than private vehicle?)
Table 4.3
Willingness of Respondents to Take Public Transportation if Public Transportation is Cheaper
No. 3 Cheaper public transport From 891 respondents 100.0%
a) yes 331 37.1%
b) no, motorcycle 260 29.2%
c) no, car 32 3.6%
d) maybe 247 27.7%
unanswered 21 2.4%
Source: survey data processed
Question 4: Apakah Anda akan lebih memilih transportasi umum, jika
itu akan lebih cepat dari kendaraan pribadi? (Would you be prefer to choose public transportation, if it is faster than private vehicle?)
Table 4.4
Willingness of Respondents to Take Public Transportation if Public Transportation is Faster
No. 4 Faster public transport From 891 respondents 100.0%
39 Table 4.5
Respondents Maintenance on Their Means of Transport No. 5 Maintenance From 891 respondents 100.0%
a) Maintaining the vehicle 444 49.8%
b) not maintaining the vehicle 396 44.4%
unanswered 51 5.7%
Source: survey data processed
Question 5a1: Jika ya, apa yang Anda perbaiki? (If yes, which part do you maintain?)
Table 4.5a1
Vehicle Component Maintained by Respondents a1 What is maintained? From 891 respondents 100.0%
a) lights 22 2.5%
Respondents Reason of Maintaining Their Vehicles b1 Why do students
maintain their
motorcycles? From 891 respondents 100.0%
40 Table 4.5c1
Respondents’ Transportation Cost per Year c1 How much is spent for
maintenance work a year? From 891 respondents 100.0%
a) Rp 20.000 - Rp 50.000 34 3.8%
Question 5a2: Jika tidak, kenapa? (If no, why not?)
Table 4.5a2
Reason for Not Maintaining a2 Why students do not
maintain their
motorbikes? From 891 respondents 100.0%
a) not necessary 113 12.7%
Refueling Habit of Respondents No. 6 Where do students
refuel their vehicles? From 891 respondents 100.0%
a) always at official 486 54.5%
b) mostly at official 152 17.1%
c) sometimes(off., street) 90 10.1%
d) mostly streetsellers 15 1.7%
unanswered 148 16.6%
Source: survey data processed