ENHANCING ETHANOL TOLERANCE OF
Escherichia coli
RECOMBINANT BY GLUTAMATE ADDITION
UNDER AN AEROBIC CONDITION
INDRA KURNIAWAN SAPUTRA
GRADUATE SCHOOL
BOGOR AGRICULTURAL UNIVERSITY BOGOR
STATEMENT OF THESIS, SOURCE OF INFORMATION AND
COPYRIGHT*
I hereby declare that thesis with titled “Enhancing Ethanol Tolerance of
Escherichia coli Recombinant by Glutamate Addition under an Aerobic Condition” was my own work under the supervision of an advisory committee and has not been submitted before to any institution of higher studies. Secondary source of information published or unpublished have been mentioned clearly in the text and listed in references at the end of this thesis.
I herewith bestow the copyright of my thesis to Bogor Agricultural University.
Bogor, May 2016
Indra Kurniawan Saputra
SUMMARY
INDRA KURNIAWAN SAPUTRA.Enhancing Ethanol Tolerance of Escherichia coli Recombinant by Glutamate Addition under an Aerobic Condition. Supervised by DJUMALI MANGUNWIDJAJA and PRAYOGA SURYADARMA.
The exploitation of fossil fuel has negative impacts on the availability of energy and the environment. Therefore, the use of alternative energy, including ethanol plays an important role in overcoming the problems. Recently, ethanol is produced through bioconversion of lignocellulose materials, and E. coli is the potential bacteria for ethanol production by utilizing biomass as substrate. It is due to its ability to consume pentose and hexose sugars from biomass for ethanol production. Meanwhile, metabolic engineering of E. coli by insertion of ethanologenic genes, namely genes encode pyruvate decarboxylase (PDC) and alcohol dehydrogenaseII (ADH) enhanced ethanol production. In addition, phosphotransacetylase (PTA) mutation carry on lowering by-product (acetate) accumulation and introduction of formate dehydrogenase (FDH) to E. coli
improve NADH availability together with piruvate accumulation for ethanol production under an aerobic condition. This high ethanol accumulation leads the cell into ethanol stress condition. It can be suppressed by glutamate addition. Glutamate is supposed to tighten peptidoglycan as crucial component in holding stress effect. Hence, the objectives of this study are to investigate the effect of glutamate addition on ethanol tolerance enhancement of ethanologenic E. coli, and to look into effectiveness of glutamate addition in increasing tolerance of ethanol under an aerobic cultures condition.
The name of strain E. coli was BW25113∆pta/pHfdh/pTadhB-pdc. First step in this study was making growth medium, precultivation and cultivation. The cultivation medium was arranged in glucose-enriched LB medium. Afterwards, samples were cultivated with agitation 250 rpm for 24 h at 37 0C, subsequently was added ethanol and glutamate at 6 h. Further step was determination of ethanol concentration for stress condition. Choosing ethanol concentration that indicated ethanol stress was based on the lowest significant cell growth which analyzed on spechtrophotometry at 660 nm and membrane visualization by scanning electron microscope (SEM). Next step was exploration of glutamate influence in ethanol stress which looked into selecting an appropriate glutamate concentration, leaking membrane analysis, glucose consumption, flux carbon, and glutamate consumption. Leaking membrane analysis was accorded to the release of metabolites by spectrophotometry at 260 nm (material genetic) and at 280 nm (protein). Then, glucose consumption was conducted in enzymatic method by using glucose kit 716251 (Roche). Meanwhile, flux carbon and glutamate consumption were investigated on organic acids profile by using high performance liquid chromatography (HPLC). Last step was examination the effectiveness of glutamate addition. The cultivation was done by increasing ethanol concentrations progressively from concentrations showed a significant lower cell growth to the 50 gL-1 ethanol.
applied for next cultivation. Whereas, glutamate influence in ethanol stress resulted that the 2 gL-1 glutamate was known that had improved cell growth significantly, reduced the release of metabolites (material genetic and protein). Next the glutamate’s effect on glucose consumption succeeded to improve glucose uptake in cells ethanol stress, and also efficiency of glucose consumed achieved revival as same as cell control, it was 0.07 g.g-1. Then flux carbons in glutamate addition reduce acetate formation as represented of overflow metabolism. Meanwhile, glutamate was consumed 65% from glutamate addition total in cultivation media. Hence, it could be reported that glutamate was required in ethanol stress response. The last result of examination the effectiveness of glutamate addition indicated that the 2 gL-1 glutamate helped cell E. coli to increase its tolerance until 40 gL-1 ethanol. For this reason, glutamate addition was effective to face ethanol stress.
Accordingly, glutamate addition was able to decrease negative impacts of ethanol stress to the cell. It got better for tolerance on membrane physically, glucose consumed, and metabolism stability. It also could be recommended as reference in increasing ethanol production in cell ethanologenic E. coli harboring
pdc-adhB under an aerobic condition.
RINGKASAN
INDRA KURNIAWAN SAPUTRA. Peningkatan Toleransi Etanol pada
Escherichia coli Rekombinan melalui Penambahan Glutamat dalam Kondisi Aerobik. Dibimbing oleh DJUMALI MANGUNWIDJAJA dan PRAYOGA SURYADARMA.
Eksploitasi bahan bakar fosil dapat menyebabkan pengaruh negatif terhadap ketersedian energi dan lingkungan. Maka, penggunaan energi alternatif termasuk etanol memiliki peranan penting dalam menanggulangi hal tersebut. Pada masa sekarang, etanol diproduksi melalui biokonversi material lignoselulosa, dan E. coli merupakan bakteri potensial untuk produksi etanol dengan memanfaatkan biomassa sebagai substrat. Hal ini disebabkan karena kemampuannya dalam mengkonsumsi gula pentosa dan heksosa dari biomassa untuk produksi etanol. Sementara itu, rekayasa metabolisme E. coli melalui penginsersian gen etanologenik yakni gen yang menyandikan piruvat dekarboksilase (PDC) dan alkohol dehidrogenaseII (ADH) mampu meningkatkan produksi etanol. Selain itu, mutasi pada bagian fosfotransasetilase (PTA) menyebabkan penurunan akumulasi produk samping (asetat) dan penyisipan format dehidrogenase (FDH) di E. coli meningkatkan ketersedian NADH seiring dengan akumulasi piruvat untuk produksi etanol dalam kondisi aerobik. Produksi etanol yang terakumulasi menyebabkan sel mengalami kondisi stres etanol. Kondisi stres dapat ditekan dengan penambahan glutamat. Glutamat diharapkan dapat menguatkan peptidoglikan yang merupakan komponen penting dalam mempertahankan sel dari pengaruh stres. Oleh karena itu, tujuan dari penelitian ini adalah menerangkan pengaruh penambahan glutamat dalam meningkatkan toleransi etanol pada E. coli etanologenik dan menguji keefektifan penambahan glutamat dalam meningkatkan toleransi terhadap etanol kondisi kultur aerobik.
konsentrasi yang menunjukkan pertumbuhan terendah secara signifikan hingga konsentrasi etanol 50 gL-1.
Hasil menunjukkan bahwa konsentrasi etanol 20 gL-1 memberikan pengaruh signifikan dalam menghambat pertumbuhan sel dan menyebabkan kebocoran membran sel yang terlihat pada hasil SEM. Konsentrasi etanol 20 gL-1 dijadikan sebagai indikator stres dalam penelitian ini dan digunakan dalam kultivasi berikutnya. Sedangkan pengaruh glutamat dalam stres etanol menghasilkan bahwa konsentrasi glutamat 2 gL-1 diketahui dapat meningkatkan pertumbuhan sel secara signifikan, menurunkan metabolit yang keluar (material genetik dan protein). Selanjutnya, pengaruh glutamat terhadap konsumsi glukosa sukses dalam meningkatkan konsumsi glukosa kondisi stres etanol, dan juga efisiensi konsumsi glukosa dapat dikembalikan seperti kontrol yakni 0.07 g.g-1. Kemudian fluks karbon dalam penambahan glutamat menurunkan pembentukan asetat yang merupakan representasi dari overflow metabolism. Sementara itu, glutamat dikonsumsi sebanyak 65% dari total penambahan glutamat di dalam media kultivasi. Maka, hal ini dapat dilaporkan bahwa glutamat diperlukan dalam respon terhadap stres etanol. Hasil akhir adalah pengujian keefektifan penambahan glutamat yang mengindikasikan bahwa konsentrasi glutamat 2 gL-1 dapat membantu sel E. coli dalam meningkatkan toleransinya hingga konsentrasi etanol 40 gL-1. Oleh karena itu, penambahan glutamat efektif dalam menghadapi stres etanol.
Dengan demikian, penambahan glutamat mampu menurunkan pengaruh negatif dari stress etanol. Ketahanan terhadap membran secara fisik dan konsumsi glukosa serta kestabilan metabolisme juga membaik. Sehingga penambahan glutamat dapat dijadikan sebagai acuan rekomendasi dalam meningkatkan produksi etanol pada sel E. coli etanologenik pembawa gen pdc-adhB pada kondisi aerobik.
© Copyright 2016 by Bogor Agricultural University
All Rights Reserved
No part or all of this thesis may be excerpted without including or mentioning the sources. Excerption should only use for education, research, scientific writing, reporting, critical writing or review an issue; and those are not detrimental to the interest of Bogor Agricultural University.
Thesis
as partial fulfillment of the requirement to obtain Master Science degree
in
Biotechnology Study Program
ENHANCING ETHANOL TOLERANCE OF
Escherichia coli
RECOMBINANT BY GLUTAMATE ADDITION
UNDER AN AEROBIC CONDITION
GRADUATE SCHOOL
BOGOR AGRICULTURAL UNIVERSITY BOGOR
2016
PREFACE
All praise and gratitude to Allah subhanahu wa ta’ala for over all The gifts and The blessing so that this study is successfully completed. Prayers and peace are always given to Rasulullah SAW. The theme chosen in the study which carried out during one year (December 2014 – December 2015) is ethanol tolerant with the title of Enhancing Ethanol Tolerance of Escherichia coli Recombinant by Glutamate Addition under an Aerobic Condition.
I would like to express my sincere gratitude to my supervisors, Prof. Dr. Ir. Djumali Mangunwidjaja, DEA and Dr. Prayoga Suryadarma, S.TP, MT who had patiently directed, motivated, advised, and spent more times during research and thesis writing. I also would like to acknowledge with much appreciation the non-comittee examiner Dr. drh. Hasim, DEA and the biotechnology program representative Prof. Dr. Suharsono, DEA, who had provide suggestions and recommendations for perfection writing. I very appreciate Bakrie Center Foundation (BCF) which gave scholarship for study and research. Moreover, I would like to offer special thanks to my family H. Syafruddin, S.Pd (father), Hj. Hayati (mother), Irwan Wahyudi Saputra (brother), and Iin Nurintan Safitri (sister) for loves, attentions, prayers, and supports. I also would like to say many thanks to all my friends in Bioindustrial Laboratory for technical assistance. It has been a pleaseure to work with you. Besides I gives special thank to Fitri Khasanah Srihadining Putri, S.Pd for her attention and editing this thesis text.
Hopefully this thesis is useful.
Bogor, May 2016
CONTENTS
LIST OF TABLES vi
LIST OF FIGURES vi
LIST OF APPENDIXES vi
1 INTRODUCTION 1
Background 1
Problem Statement 2
Research Objectives 2
Benefits of the Study 3
Scope of the Study 3
2 LITERATURE REVIEW 4
E. coli Recombinant (BW25113∆pta/pHfdh/pTadhB-pdc) in Metabolic
Engineering Scheme 4
Cell Membrane Sensitivity to Great Amount of Ethanol 6 Glutamate Forming Peptidoglycan and Uptake in E. coli 6
3 METHODOLOGY 9
Research Framework 9
Place and Time 10
Bacterial Strain and Plasmids 10
Growth Medium, Pre-cultivation, Cultivation 10
Determination of Ethanol Concentration for Stress Condition 11 Investigation of Glutamate Influence on Ethanol Stress Condition 12 Finding out the Effectiveness of Glutamate Addition 13
4 RESULT AND DISCUSSION 14
Implication of Ethanol Concentration on the Cell Growth and Membrane 14 The Glutamate Effect on Lowering Ethanol Stress Condition 15 The Effectiveness of Glutamate Addition in Decreasing Ethanol Stress 19
5 CONCLUSIONS AND RECOMMENDATIONS 22
Conclusions 22
Recommendations 22
LITERATURES 23
APPENDIXES 27
LIST OF TABLES
1 The E. coli recombinant used in this study 10
2 The release of metabolites (material genetic A260 and protein A280) as
result of leaking membrane in ethanologenic E. coli recombinant 17 3 Cell growth and glucose consumption after 24 h cultivation in E. coli
recombinant under an aerobic condition with ethanol and glutamate test. 17 4 Calculation of product during exposed to ethanol and glutamate addition in
E. coli recombinant under aerobic condition 18
LIST OF FIGURES
1 The gene distruption strategy of E. coli BW25113 5 2 Basic aerobic and anaerobic metabolic pathways of E. coli 5 3 The cell without wall cell fares best in an isotonic environment unless it
has special adaptations that offset the osmotic uptake or loss of water 6
4 Peptidoglycan biosynthesis 7
5 Mechanism of an ABC transporter 8
6 Research framework 9
7 Map of plasmids 11
8 Dry cell weight of E. coli recombinant at 24 h toward different
concentration of ethanol addition at 6 h 14
9 Micrograph of scanning electron microscope E. coli recombinant after 24 h cultivation in LB media and an hour in PBS media 15 10 Dry cell weight of E. coli recombinant at 24 h toward different
concentration of glutamate supplementation in the cultures of 20 gL-1
ethanol addition 16
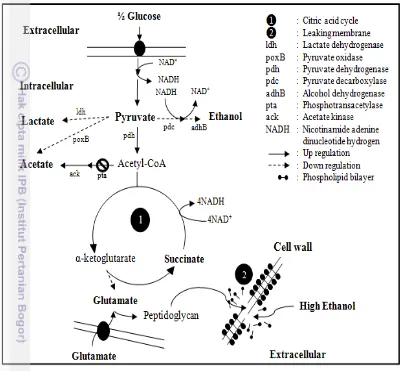
11 Schematic ilustration showing central carbon metabolism and membrane
of ethanol stress cell with glutamate addition 20
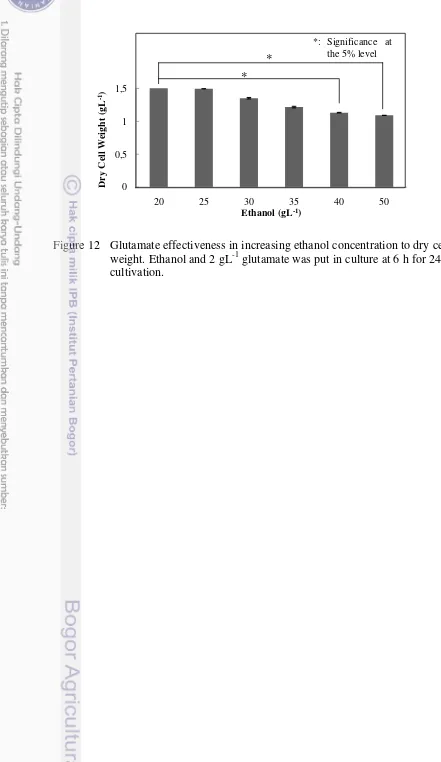
12 Glutamate effectiveness in increasing ethanol concentration to dry cell
weight 21
LIST OF APPENDIXES
1 Procedure of glucose kit (Roche) 27
2 Research database in glucose kit analysis 28
1
1
INTRODUCTION
Background
Excessive use of fossil fuel cause negative impact on the availability of energy and the environment. Therefore, increasing enthusiasm is focused toward energy alternative, including ethanol. Ethanol production continues evolve resulting in a change of its production, from First-generation produced primarily food crop substrates such as grains, sugar beet, and oil seeds to Second-generation produced from non-food biomass. Feedstock from non-food biomass includes cereal straw, bagasse, forest residues, and purpose-grown energy crops such as vegetative grasses and short rotation forests (IEA 2008). Non-food biomass containing lignocelluloses typically compose 35 – 50 % cellulose, 20 – 35 % hemicellulose, and 10 – 15 % lignin on dry weight basis (Wyman 1994).
However, one of the major technical obstacles to commercialization of process for converting lignocelluloses to ethanol is strain development. Generally, microorganisms used for fermentation (e.g. Saccharomyces cerevisiae and
Zymomonas mobilis) cannot catabolism pentose sugars derived from hemicellulose and growth rate of S. cerevisiae is lower than other ethanol condition via acetyl-coA catalyzed by pyruvate formate lyase (PFL) (Peterson and Ingram 2008). Nevertheless, in the pathway not only produce ethanol but also acetate as byproducts. Flux carbon tends to increase acetogenesis (Chang et al.
1999), forms anaplerotic pathway that result succinate (Wolfe 2005), decrease growth of cell (Peng and Shimizu 2003), those all phenomenon metabolism is due to citric acid cycle (TCA) do not induction properly. Besides, anaerobic condition generates high lactate acid which converts pyruvate as substrate intermediate (Chang et al. 1999). Many byproducts and low level of cell growth show that production ethanol in anaerobic condition is still not effective.
Meanwhile, metabolic engineering is able to improve ethanol production through insertion ethanologenic genes, namely genes encode pyruvate decarboxylase (PDC) and alcohol dehydrogenaseII (ADH) (Ingram et al. 1987). The reason for selection those enzymes are Michaelis-Menten constants (Km) of PDC that quite low compared with other pyruvate-consuming reactions and effectively shifting metabolic products to much higher ethanol production. Thus, inside E. coli harboring pdc-adhB genes forms new pathway that convert pyruvate to ethanol directly (Peterson and Ingram 2008) and deletion on phosphotransacetylase (PTA) reduce acetate formation in cultures (Hahm et al.
1994). Furthermore, growth yields depend on oxygen availability because of energy improvement in E. coli as facultative anaerobic bacterium (Kayser et al.
2
via other pathways (Ojima et al. 2012). Oxygen as end electron acceptor consume NADH in respiration system (Causey et al. 2004) involve imbalance NADH/NAD+ for ethanol production, but to keep stability of NADH/NAD+ integrate formate dehydrogenase (FDH). Besides, introduction of FDH enhance the accumulation of pyruvate (Ojima et al. 2012). As consequence, aerobic condition with accumulation of pyruvate will trigger high ethanol production.
Nonetheless, the increasing ethanol production is still limited, since ethanol stress affects to the cell. As well as S. cerevisiae, ethanol which has molecule sized 46 dalton diffuses freely across membrane E. coli to equalization of ethanol concentration between extracellular and intracellular of cell (Alberts et al. 2010). Ethanol impacts to the cell membrane integrity by changing fatty acid composition (Dombek and Ingram 1983), decreasing flux proton in membrane (Cartwright et al. 1986), inactivating cytosolic enzymes and leaking membrane, then ultimately cell growth retardation (Huffer et al. 2011).
Cell membrane is first barrier to hold ethanol stress. In gram negative membrane, peptidoglycan is an essential component of the bacterial cell wall that protects the bacteria from osmotic rupture (Van Heijenoort 2001). So, the destruction of ethanol stress should be prevented by glutamate addition. Based on Underwood et al. (2004) that glutamate as osmolyte protective accumulate in stress cell in aerobic condition, moreover glutamate is also an important part in synthesis of peptidoglycan (Madigan et al. 2012). Glutamate is non-essential protein in cell E. coli, produce from α-ketoglutarate which part of TCA cycle product, key metabolite for urea cycle and co-substrate others amino acid (glutamine, proline, and arginine) (Nelson and Cox 2004). Thus, in this research was conducted by glutamate addition in helping cell toward high ethanol stress under an aerobic condition that cell had been engineered in its metabolic. This research gives a new way and potency to increase ethanol production in ethanologenic E. coli harboring pdc-adhB genes.
Problem Statement
Accumulation of ethanol is such toxic for cell that impacts on lowering growth and membrane integrity until destruction in cell E. coli producing ethanol. In this study, to help cells face the stress of ethanol by glutamate addition. Glutamate addition is expected to increase the rate of cell growth and also maintains membrane stability. It cause that glutamate as osmolyte protective and as main building block of peptidoglycan.
Research Objectives
3
Benefits of the Study
The benefits of this study are enhancing ethanol production in cell ethanologenic E. coli harboring pdc-adhB genes, encouraging on using strain E. coli in utilization non-food biomass, and providing recommendation in bioprocess engineering to overcoming low cell growth because of high ethanol that useful in industrialization.
Scope of the Study
4
2
LITERATURE REVIEW
E. coli Recombinant (BW25113∆pta/pHfdh/pTadhB-pdc) in Metabolic Engineering Scheme
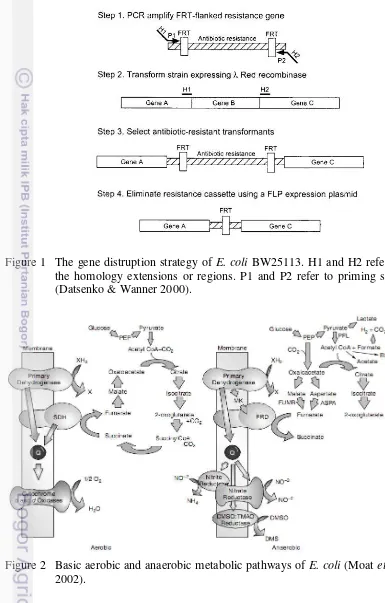
Metabolic engineering is a field that includes the construction, redirection, and manipulation of cellular metabolism through alteration of endogenous and/or heterologous enzyme activities and levels to achieve the biosynthesis or biocatalysis of desired compounds. The basic tenet of metabolic engineering, the use of biology as a technology for the conversion of energy, chemicals, and materials to value-added products, has a long history. Early applications can be cited, even prior to development of DNA recombinant technology (Smolke 2010). The most widely bacterium used in DNA recombinant technology is E. coli, a rod-shaped bacterium about 1 by 2.5 microns in size. This organism is simple in structure, grows easily in laboratory, and contains very few genes. Another useful trait of E. coli is the presence of extrachromosomal elements called plasmids. These small rings of DNA are easily removed from bacteria, modified by adding or modifying genes, and reinserted into a new bacterial cell where new genes can be evaluated (Clark & Pazdernik 2010). Furthermore the increased availability of genome sequences of E. coli provided comprehensive molecular understanding. As result create a new strain BW25113 from E. coli K-12 which its genome is available in highly accurate (Hayashi et al. 2006). The strain BW25113 had been removed lacI, lacZ, araBAD, and rhaBAD for analysis method purpose by red recombinase system. The red recombinase system came from bacteriophages that encode their own homologous recombination system. The basic principle is to replace a chromosomal sequence (Figure 1) with integrated low-copy-number red recombinase expression plasmid pKD46 that was reported by Datsenko and Wanner (2000).
According to Baba et al. (2006) the mutation at pta site also used red recombinase system. It has been known for a long time that the pta gene encode phosphotransacetylase (PTA) in which produce acetate together with acetate kinase (ACKA) pathway, generates two ATP molecules per glucose but consumes no reducing equivalents (NADH). The PTA-deficient mutant did not accumulate extracellular acetate (Hahm et al. 1994). It gave advantages for ethanol production during aerobic growth on glucose (Diaz-ricci et al. 1991). To rise ethanol production had been introduced the ethanologenic genes (pdc-adhB) from Z. mobilis that encode pyruvate decarboxylase (PDC) and alcohol dehydrogenase (ADHB) (Ingram et al. 1997). The reason led to Z. mobilis Km PDC is quite low compared with other pyruvate-consuming reactions and effectively shifting metabolic products to much higher concentrations of ethanol (Peterson & Ingram 2008). The PDC-ADHB will convert pyruvate to ethanol. It is contrary to wild type which produces ethanol anaerobic condition via acetyl-coA (Figure 2).
5
2002). However, respiration chain consumed NADH that also used as coenzyme for alcohol dehydrogenase to produce ethanol. To recover the stability of NADH, based on Ojima et al. (2012) was introduced formate dehydrogenase (FDH) from
M. vaccae that also enhanced accumulation of pyruvate. Then pyruvate might be converted by PDC-ADHB to ethanol.
Figure 1 The gene distruption strategy of E. coli BW25113. H1 and H2 refer to the homology extensions or regions. P1 and P2 refer to priming sites (Datsenko & Wanner 2000).
Figure 2 Basic aerobic and anaerobic metabolic pathways of E. coli (Moat et al.
6
Cell Membrane Sensitivity to Great Amount of Ethanol
Ethanol in cell diffuses freely across membrane allowing equalization of ethanol concentrations between intracellular and extracellular, normally. It is isosmotic that same to water. However, the high ethanol concentration showed growth retardation and finally death. In molecular cell, ethanol disrupt membrane by dissipating proton motive force (Cartwright et al. 1986).The proton motive force is movement of H+ ions across the membrane through the H+ channel provided by ATP synthase. In general terms also called chemiosmosis (Reece et al. 2011). The stability of chemiosmosis are crucial for cell in which effect to water or ethanol movement where look into both solute concentration and membrane permeability. The different of them are divided into three type environment; isotonic, hypotonic, hypertonic. Those environments will bring cell membrane into normal, lysed, and shriveled respectively (Figure 3). Moreover, based on Underwood et al. (2004) that ethanol affect on lost of osmolytes that can change cell environment.
Figure 3 The cell without wall cell fares best in an isotonic environment unless it has special adaptations that offset the osmotic uptake or loss of water (Reece et al. 2011).
Glutamate Forming Peptidoglycan and Uptake in E. coli
7
8
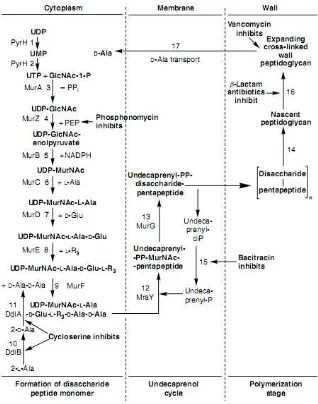
Peptidoglycan synthesis involves a number of cytoplasmic, membrane, and periplasmic steps. N-acetylglucosamine (GlcNAc) is first coupled with UDP. A portion of the UDP-GlcNAc is converted into UDP-MurNAc (N-acetylmuramic acid), and the peptide chain is developed by sequential addition of amino acids. The growing chain is then coupled with undecaprenyl-phosphate, enabling its transfer across the cytoplasmic membrane where it is incorporated into the growing peptidoglycan. At the interface between the growing cell wall and the cell membrane, transglycosidation reactions polymerize the growing chain and transpeptidases introduce cross-linking (Moat et al. 2002).
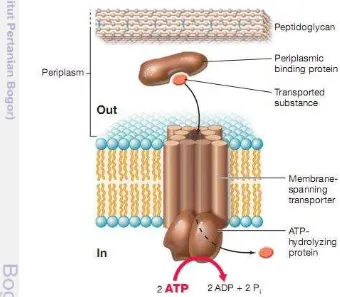
Furthermore E. coli can uptake glutamate from environment via glutamate ABC transporter that consist of four subunit transporter; GltI (periplasmic binding protein), GltK (membrane subunit), GltJ (membrane subunit), GltL (ATP binding subunit) (Schellenberg & Furlong 1977). According to Madigan et al. (2012) ABC transports system is transport that employ periplasmic binding proteins along with membrane transporter and ATP-hydrolyzing proteins. A characteristic property of periplasmic binding proteins is their high substrate affinity. These proteins can bind their substrate even when they are at extremely low concentrations; for example, less than 1 micromolar (10-6 M). Once its substrate is bounce, the periplasmic binding protein interacts with its respective membrane transporter to transport the substrate into the cell driven by ATP hydrolisis (Figure 5).
9
3
METHODOLOGY
Research Framework
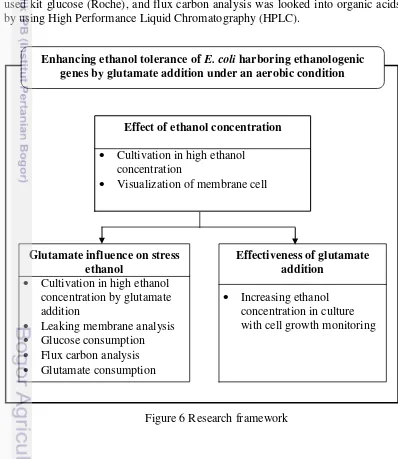
The research framework depict in Figure 6. To enhance ethanol tolerance in
E. coli, firstly it was determined of ethanol stress concentration in an aerobic culture condition. The stress resulted reducing cell growth and breaking of cell membrane that visualized in scanning microscope electron (SEM) for understanding the implication high ethanol in E. coli membrane. Ethanol stress concentration used for next cultivation for explanation glutamate influence in ethanol stress and glutamate’s effectiveness. Indicator for impact of glutamate was investigated by looking cell growth, leaking membrane analysis, glucose consumption, and flux carbon analysis. Meanwhile, to test effectiveness of glutamate was carried out by increasing ethanol stress concentration until decreasing cell growth significantly. All of pre-cultivation, cultivation, and cell growth analysis was conducted according Ojima et al (2012), leaking membrane analysis based on procedure modified of Lin et al. (2000), glucose consumption used kit glucose (Roche), and flux carbon analysis was looked into organic acids by using High Performance Liquid Chromatography (HPLC).
Figure 6 Research framework Enhancing ethanol tolerance of E. coli harboring ethanologenic
10
Place and Time
This research was carried out during December 2014 – December 2015 in Bioprocess Engineering Laboratory, Research Center of Bioresources and Biotechnology, Bogor Agricultural University and Bioindustry Laboratory, Department of Agroindustrial Technology, Faculty of Agricultural Technology, Bogor Agricultural University.
Bacterial Strain and Plasmids
The bacterial strain employed in this study was E. coli BW25113 which mutated on phosphotransacetylase (pta) genes originated from National BioResources Project, National Institute of Genetic (NIG), Mishima, Japan (Baba
et al. 2006). This strain was inserted plasmid pHfdh bearing formate dehydrogenase genes (fdh) (Ojima et al. 2012) and plasmid pTadhB-pdc harboring ethanologenic genes namely pyruvate decarboxylase (pdc) together with alcohol dehydrogenase (adhB) genes. The genes were obtained from Department Chemical Science and Engineering, Osaka University, Japan. Strain and plasmids are listed in Table 1.
Table 1 The E. coli recombinant used in this study
Name Description Reference or Source
E. coli strain
BW25113∆pta pta-deficient mutant from parent strain BW25113, Kanr
Ojima et al. 2012
Plasmids*
pHfdh fdh gene from Mycobacterium vaccae, ligated into pHSG399 vector which contains a pMB1
replicon, Camr
Ojima et al. 2012
pTadhB-pdc Ethanologenic genes (adhB and pdc) from Z. Mobilis inserted into
pTrc99A, Ampr
Department Chemical Science and Engineering,
Osaka University
*Map of vector plasmids depict in Figure 7
Growth medium, Pre-cultivation, Cultivation
Growth medium used was Lauria Bertani (LB) medium containing 10 g peptone, 10 g NaCl, and 5 g yeast extract per litre of deionized water. Pre-cultivation was conducted for refresh of cell E. coli from glycerol stock to reach optimum growth in cultivation. In pre-cultivation LB medium were added appropriate antibiotics (50 mgL-1 ampicillin, 34 mgL-1 chloramphenicol, 15 mgL-1 kanamycin) along with 1 % (v/v) strain BW25113∆pta/pHfdh/pTadhB-pdc. Samples were incubated in incubator shaker (Optic Ivymen System) agitation 120 rpm for 12 h at 37 0C. After OD660 reach 1.0 – 1.5, then moved into cultivation
11
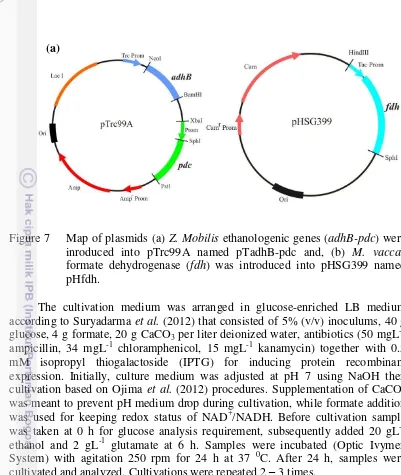
Figure 7 Map of plasmids (a) Z. Mobilis ethanologenic genes (adhB-pdc) were inroduced into pTrc99A named pTadhB-pdc and, (b) M. vaccae
formate dehydrogenase (fdh) was introduced into pHSG399 named pHfdh.
The cultivation medium was arranged in glucose-enriched LB medium according to Suryadarma et al. (2012) that consisted of 5% (v/v) inoculums, 40 g glucose, 4 g formate, 20 g CaCO3 per liter deionized water, antibiotics (50 mgL-1
ampicillin, 34 mgL-1 chloramphenicol, 15 mgL-1 kanamycin) together with 0.5 mM isopropyl thiogalactoside (IPTG) for inducing protein recombinant expression. Initially, culture medium was adjusted at pH 7 using NaOH then cultivation based on Ojima et al. (2012) procedures. Supplementation of CaCO3
was meant to prevent pH medium drop during cultivation, while formate addition was used for keeping redox status of NAD+/NADH. Before cultivation sample was taken at 0 h for glucose analysis requirement, subsequently added 20 gL-1 ethanol and 2 gL-1 glutamate at 6 h. Samples were incubated (Optic Ivymen System) with agitation 250 rpm for 24 h at 37 0C. After 24 h, samples were cultivated and analyzed. Cultivations were repeated 2 – 3 times.
Determination of Ethanol Concentration for Stress Condition
Ethanol concentration indicating ethanol stress was carried out by cultivation in high ethanol concentration. Concentrations range was 0 – 25 gL-1 ethanol and that significantly reduced cell growth became stress indicator. In culture condition, ethanol was added at 6 h, cultivated until 24 h under aerobic condition, and repeated for 3 times. Cell growth were measured by looking into dry cell weight which analyzed on spectrophotometry wavelength 660 nm. OD660
was multiply with 0.36 as equivalent for 1 OD660 (Ojima et al. 2012). The data
gained were average and standard deviation values from 3 repetitions with the significance measurement by t-test.
The purpose of ethanol supply in cultures at 6 h was based on growth profile of E. coli. At 6 h culturing was exponential phase that monitored effect of ethanol on growth rate easily and assumed that E. coli strain did not produce ethanol
12
anymore at 6 h culturing because of inhibitor regulations. Inhibitor that inhibited alcohol dehydrogenase (adhB) in ethanologenic E. coli was end product of enzyme reactions, namely ethanol and NAD+. Ethanol acts as competitive inhibitor, whereas NAD+ acts as uncompetitive inhibitor (Hoppner and Doelle 1983).
Afterwards, to proved the effect of ethanol toward cell membranes was conducted through visualization by Scanning Electron Microscope (SEM). SEM was prepared in 4 steps (fixation, dehydration, ionic spark, visualization) that procedures described previously (Bennis et al. 2004). Samples had been contacted with ethanol, subsequently were fixed in 2 % glutaraldehyde for an hour at 4 oC and in 1 % osmium tetraoxyde for 30 minutes at 4 oC, dehydrated using critical cell point in liquid CO2 under 95 bar pressure (Quorum K850) then air dried.
Ionic spark employing Cathodic Sprayer Gold (Quorum Q150 R ES) was sputtered a small amount of gold ion on the samples to avoid charging in the microscope. Samples were visualized in scanning electron microscope (Zeizz EVO MA10).
Investigation of Glutamate Influence on Ethanol Stress Condition
Glutamate addition was intended for helping cells steady in ethanol stress condition. Glutamate concentrations (0 – 6 gL-1) which had an increasing significant cell growth were used and analyzed further. The sample cultures were supplemented glutamate and ethanol at 6 h for 24 h cultivation under an aerobic condition. Furthermore, understanding roles of glutamate in cells were explored on cell growth, leaking membrane cells, glucose consumption, flux carbon, and (control, 20 gL-1 ethanol, 20 gL-1 ethanol and 2 gL-1 glutamate). After incubation, samples were separated from pellet and supernatant by centrifugation 4800 g for 15 minutes (Hettich zentrifugen, micro 22R). Finally, the supernatant was measured at wavelength 260 nm for genetic material and 280 nm for protein in spectrophotometer (Hewlett Packard 8453). The data obtained were average and standard deviation values from 3 repetitions with the significance measurement by t-test.
13
remaining (Appendix 2). The data gained were average and standard deviation value from 2 – 3 repetitions with the significance measurement by t-test
To explain regulation of glutamate in metabolism cell was analized flux carbon with organic acid by using high performance liquid chromatography (HPLC) (HPLC Hp Hewlett Packard, 1100 series). Materials preparation were samples diluting in double-distilled water, standards (succinate, lactate, pyruvate, glutamate, acetate), and mobile phase mixing of 99 % 20 mM NaH2PO4 pH 2 and
1 % acetonitrile. Samples were injected into columned Zorbax Sb-Aq 883975-914 (Agilent), flow rate 1.0 mLmin-1 at 35 oC and detected on 210 nm. Glutamate consumption was known from glutamate remaining in cultures media that detected in HPLC by reducing concentration of glutamate addition. The organic acid standard curve was depicted in Appendix 3. The data gained were average and standard deviation values from 2 – 3 repetitions with the significance measurement by t-test. Carbon recovery (Rc) values were calculated according to following formula:
� = mol of Carbon in metabolite produced
mol of Carbon in glucose consumed × 100%
Finding out the Effectiveness of Glutamate Addition
14
4
RESULT AND DISCUSSION
Implication of Ethanol Concentration on the Cell Growth and Membrane
At first, the effect of ethanol concentration on the E. coli cell growth was investigated (Figure 8). The increasing concentration of ethanol addition lowered cell growth of ethanologenic E. coli. The 20 gL-1 ethanol concentration gave significant effect on inhibiting cell growth. It was greater than concentration ethanol of which produced by E. coli strain AH003 with genotype KO11 mutated at lactate dehydrogenase (ldhA) and pyruvate formate lyase (pflA) as a towering ethanol producer strain (Forster and Gescher 2014).
This result was also documented by Huffer et al. (2011) which showed that excessive ethanol reduced cell growth rate in strain E. coli K12 under aerobic condition. In addition, high ethanol concentration also disrupted membrane integrity which was due to ethanol toxicity (Dombek and Ingram 1983). Therefore the membrane cell leaked. The result was confirmed further by SEM micrograph.
E. coli cells being not in stress condition had membrane flat, soft, and normal (Figure 9a). Otherwise, E. coli which was exposed 20 gL-1 ethanol was visibly leaking on membrane cells (Figure 9b). It has been reported previously that leaking cells is due to the alteration of environment osmolarity (Reece et al. 2011). This condition was also broken off peptidoglycan as layer within periplasm for giving bacteria shapes and protection from stress (Schwechheimer and Kuehn 2015). Meanwhile leaking membranes as consequence of ethanol diffuse easily trough membrane which disrupts cross-linking of peptidoglycan (Ingram & Vreeland 1980; Alberts et al. 2010) increased plasmolysis, accumulated of material genetic and protein in culture. Hence, in this research the 20 gL-1 ethanol became ethanol stress indicator for next cultivation.
Figure 8 Dry cell weight of E. coli recombinant at 24 h toward different concentration of ethanol addition at 6 h.
15
Figure 9 Micrograph of scanning electron microscope E. coli recombinant after 24 h cultivation in LB media and an hour in PBS media of cells (a) without ethanol addition as control, then (b) with 20 gL-1 ethanol addition at 6 h and (c) with 20 gL-1 ethanol addition and 2 gL-1 glutamate at 6 h. Arrow represents leaking cells.
The Glutamate Effect on Lowering Ethanol Stress Condition
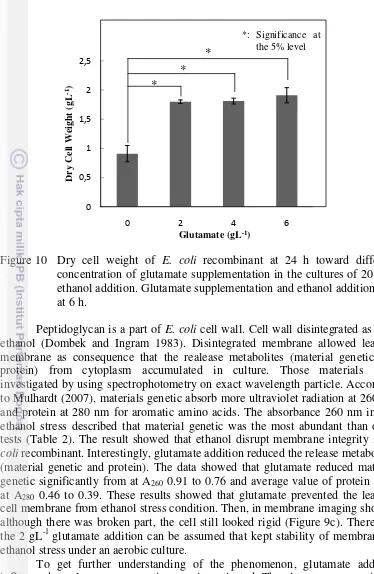
To avoid the disrupting cell membrane as an effect of ethanol stress, the different of glutamate concentration was supplemented at 6 h (Figure 10). Glutamate is abundant amino acid in cytoplasm of E. coli and related organism under aerobic condition. It also involve in stress response (Feehily and Karatzas 2012) and a crucial molecule in building block of peptidoglycan. The 2 gL-1 glutamate had brought cells in growth comfortably that gave a significance increasing dry cell weight. The 2 gL-1 glutamate was as an appropriate concentration on increasing cell growth in the cultures of 20 gL-1 ethanol addition. To confirm the glutamate influence in leaking cell membranes was investigated. Naturally, S. cerevisiae as traditional microbial factory produce ethanol higher than wild type of E. coli. It can be explained from structure of membrane that afford struggle in high ethanol concentration. S. cerevisiae
16
Figure 10 Dry cell weight of E. coli recombinant at 24 h toward different concentration of glutamate supplementation in the cultures of 20 gL-1 ethanol addition. Glutamate supplementation and ethanol addition was at 6 h.
Peptidoglycan is a part of E. coli cell wall. Cell wall disintegrated as high ethanol (Dombek and Ingram 1983). Disintegrated membrane allowed leaking membrane as consequence that the realease metabolites (material genetic and protein) from cytoplasm accumulated in culture. Those materials were investigated by using spectrophotometry on exact wavelength particle. According to Mulhardt (2007), materials genetic absorb more ultraviolet radiation at 260 nm and protein at 280 nm for aromatic amino acids. The absorbance 260 nm in cell ethanol stress described that material genetic was the most abundant than other tests (Table 2). The result showed that ethanol disrupt membrane integrity in E. coli recombinant. Interestingly, glutamate addition reduced the release metabolites (material genetic and protein). The data showed that glutamate reduced material genetic significantly from at A260 0.91 to 0.76 and average value of protein from
at A280 0.46 to 0.39. These results showed that glutamate prevented the leaking
cell membrane from ethanol stress condition. Then, in membrane imaging showed although there was broken part, the cell still looked rigid (Figure 9c). Therefore, the 2 gL-1 glutamate addition can be assumed that kept stability of membrane in ethanol stress under an aerobic culture.
To get further understanding of the phenomenon, glutamate addition influenced on glucose consumption was investigated. The glucose consumption is fundamental thing to know initially on molecular mechanism in ethanol tolerance (Ma and Liu 2012). Cells in ethanol stress condition consumed glucose lower than control and glutamate replenishment (Table 3). It described that high ethanol led to glucose uptake alleviation in cultures under an aerobic condition. Otherwise, glutamate supplementation succeeded to improve glucose uptake in cells ethanol
17
stress condition. According to Roth et al. (1985), when cells in culture raised glucose uptake meant that cells had alleviated the effect of stress.
In addition, in ethanol stress resulted biomass (g) per glucose consumed carbon recovery (Rc) value. These phenomenons were due to glucose transport via phosphotransferase system (PTS) which utilize phosphoenolpyruvate as phosphate donor to glucose so forming glucose-6-phospate. This phosphorylate result pyruvate, so that pyruvate ratio could be indicator in glucose consumed (Deutscher et al. 2006). Nonetheless, glutamate addition had biomass (g) per glucose consumed (g) same as control. It meant that cells did not respond to the stress in intracellular which used energy as activated regulation. It could be stated that glutamate recovered and brought back the efficiency of glucose uptake like control in cells ethanol stress.
Table 2 The release of metabolites (material genetic A260 and protein A280) as
result of leaking membrane in ethanologenic E. coli recombinant.
Test A260 A280
(a)statistically significant at the 5 % level from the 20 gL-1 ethanol, (b) statistically significant at the 5 % level from the control value.
Table 3 Cell growth and glucose consumption after 24 h cultivation in E. coli
recombinant under an aerobic condition with ethanol and glutamate test.
18
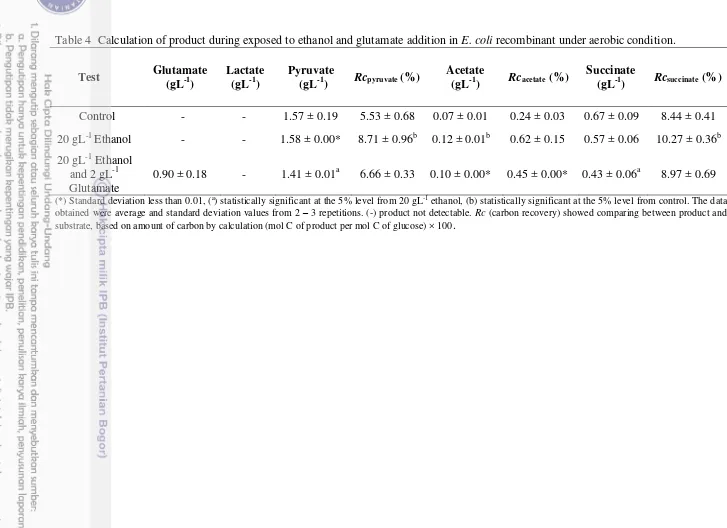
Table 4 Calculation of product during exposed to ethanol and glutamate addition in E. coli recombinant under aerobic condition.
Test Glutamate
(gL-1)
Lactate (gL-1)
Pyruvate
(gL-1) Rcpyruvate (%)
Acetate
(gL-1) Rcacetate (%)
Succinate
(gL-1) Rcsuccinate (%)
Control - - 1.57 ± 0.19 5.53 ± 0.68 0.07 ± 0.01 0.24 ± 0.03 0.67 ± 0.09 8.44 ± 0.41 20 gL-1 Ethanol - - 1.58 ± 0.00* 8.71 ± 0.96b 0.12 ± 0.01b 0.62 ± 0.15 0.57 ± 0.06 10.27 ± 0.36b 20 gL-1 Ethanol
and 2 gL-1 Glutamate
0.90 ± 0.18 - 1.41 ± 0.01a 6.66 ± 0.33 0.10 ± 0.00* 0.45 ± 0.00* 0.43 ± 0.06a 8.97 ± 0.69
19
Under an aerobic condition, cell control generated pyruvate (Rc = 5.53%), acetate (Rc = 0.24%), succinate (Rc = 8.44%) but lactate was not identified (Table 3). Suryadarma et al. (2012) had reported previously that pyruvate produced (Rc = 9%) on the oxygen mass transfer coefficient (Kla = 1.5 min-1) in strain E. coli
Bw25113/pMadh. The different result of pyruvate showed that insertion plasmid pHfdh and pTadhB-pdc contributed in changing flux carbon. But, lactate was not identified in this study that as result presenting of oxygen in culture. Oxygen down regulates lactate dehydrogenase (LDH) that converts pyruvate into lactate (Suryadarma et al. 2012). Furthermore succinate usually accumulates under anaerobic condition which making anaplerotic pathway (Wolfe 2005). However in this study succinate presented in culture was led to respiration system that required succinate (Madigan et al. 2012). Meanwhile, formate was reduced because of down regulation on pyruvate formate lyase (PFL) under aerobic condition. Thus, formate was elevated in culture as substrate for formate dehydrogenase (FDH) that maintained ratio of NADH/NAD+ (Galkin et al. 1997). In cells exposed to ethanol stress that consumed a lot of glucose per cell, flux carbon tended to form acetate and pyruvate. These products were higher than control and glutamate addition. Raising glucose requirement together with acetate and pyruvate indicated overflow metabolism (Vemuri et al. 2006). The overflow metabolism brings negative effect in metabolism, particularly in cells which produce recombinant protein. This induces stress response that reduces growth and recombinant protein (Luli and Strohl 1990; Swartz 2001). Acetate forms from acetyl-coA and pyruvate, but the E. coli strain that utilized had been mutated at phosphotransacetylase (pta), so acetate was produced via pyruvate oxidase (poxB). The summary of metabolism can be seen on Figure 11.
Interestingly, glutamate addition was such able to generate a low concentrated of acetate and pyruvate (Table 4) that it eliminated the negative effect on overflow metabolism. Then glutamate had been consumed 65% in culture, it indicated glutamate used for stress response in facing high ethanol. Glutamate in cytoplasm reacts to UDP-N-acetylmuramil-L-alanine on peptide bond. Then, it combines to mes-diaminopimelic acid, D-alanyl, and D-alanine until form peptidoglycan monomer (Ho et al. 1994). Peptidoglycan are essential component that keep cell tenacity (Vollmer et al. 2008). Therefore, glutamate addition got metabolism stable as well as control and was needed in stress response.
The Effectiveness of Glutamate Addition in Decreasing Ethanol Stress
20
specific growth rate with described in S. cerevisiase. It could be state that glutamate was effective in increasing cell tenacity toward high ethanol stress and had potency to make ethanologenic E. coli harboring pdc-adhB produced ethanol higher than before.
21
Figure 12 Glutamate effectiveness in increasing ethanol concentration to dry cell weight. Ethanol and 2 gL-1 glutamate was put in culture at 6 h for 24 h cultivation.
0 0,5 1 1,5
20 25 30 35 40 50
Dry
Cell
Weig
ht
(g
L
-1)
Ethanol (gL-1)
*: Significance at the 5% level *
22
5
CONCLUSIONS AND RECOMMENDATIONS
Conclusions
Enhancing ethanol tolerant in E. coli harboring ethanologenic genes was conducted by glutamate addition. Ethanol stress in this strain was observed at a concentration 20 gL-1 ethanol where strain showed declining of cell growth and leakage of cell membrane. By glutamate addition, the ethanol stress was reduced. Glutamate influence in ethanol stress was an increased cell growth, reduced leakage by causing the release metabolites (material genetic and protein) in extracellular. Furthermore, glutamate addition recovered efficiency of glucose consumed as well as control and also undirected flow carbon into acetate forming as representative of overflow metabolism. Besides, glutamate addition was required in stress response that proved from glutamate consumed. Glutamate addition had increasing ability of cell too in higher concentrated ethanol. Thus glutamate addition in ethanol stress culture under aerobic condition was effective to facing ethanol stress.
Recommendations
23
LITERATURES
Alberts B, Bray D, Hopkin K, Johnson A, Lewis J, Raff M, Roberts K, Walter P. 2010. Essential Cell Biology 3rd ed. New York (US): Garland science. Baba T, Ara T, Hasegawa M, Takai Y, Okumura Y, Baba M, Datsenko KA,
Tomita M, Wanner BL, Mori H. 2006. Construction of Escherichia coli K-12 in-frame, single-gene knockout mutants: the keio collection. Mol Syst Biol. doi:10.1038/msb4100050.
Bennis S, chami F, Chami N, Rhayour K, Elaraki AT, Remmal A. 2004. Eugenol induces damage of bacterial and fungal envelope. Moroccan J Biol. 1: 33 – 39.
Berg JM, Tymoczko JL, Stryer L. 2007. Biochemistry 6th. New York (US): Friedman & Co.
Blank LM, Sauer U. 2004. TCA cycle activity in Saccharomyces cerevisiae is a function of the environmentally determined specific growth and glucose uptake rates. Microbiol. 150: 1085 – 1093.doi:10.1099/mic.0.26845-0. Cabib E, Roh DH, Schmidt M, Crotti LB, Varma A. 2001. The yeast cell wall and
septum as paradigms of cell growth and morphogenesis [minireview]. J Biol Chem. 276: 19679 – 19682.
Cartwright CP, Juroszek JR, Beavan MJ, Ruby FMS, De Morais SMF, Rose AH. 1986. Ethanol dissipates the proton-motive force across the plasma membrane of Saccharomyces cervisiae. J Gen Microbiol. 132: 369 – 377. Causey TB, Shanmugam KT, Yomano LP, Ingram LO. 2004. Engineering
Escherichia coli for efficient conversion glucose to pyruvate. PNAS. 101: 2235 – 2240.
Chang DE, Shin S, Rhee JS, Pan JG. 1999. Acetate metabolism in a pta mutant of
Escherichia coli W3110: importance of maintaining acetyl-CoA flux for the growth and survival. J Bacteriol. 181: 6656 – 6663.
Clark DP, Pazdernik NJ. 2010. Biotechnology Applying The Genetic Revolution. Burlington (US): Elsevier Acad Pr.
Datsenko KA, Wanner BL. (2000). One-step inactivation of chromosomal genes in Escherichia coli K-12 using PCR products. Proc Natl Acad Sci USA. 97: 6640 – 6645.
Deutscher J, Francke C, Postma WP. 2006. How phosphotransferase system-related protein phosphorulation regulates carbohydrate metabolism in bacteria. Microbiol Mol Biol Rev. 70: 939 – 1031.
Diaz-Ricci JC, Regan L, Bailey JE. 1991. Effect of alteration of the acetic acid synthesis pathway on the fermentation pattern of Escherichia coli.
Biotechnol Bioeng. 38: 1318 – 1324.
Dombek KM, Ingram LO. 1983. Effects of ethanol on the Escherichia coli plasma membrane. J Bacteriol. 157: 233 – 239.
Feehily C, Karatzas KAG. 2012. Role of glutamate metabolism in bacteial responses towards acid and other stresses [review]. J Appl Microbiol.
doi:10.1111/j.1365-2672.2012.05434.x.
24
Galkin A, Kulakova I, Yoshimura T, Soda K, Esaki N. 1997. Synthesis of optically active amino acids from α-keto acids with Escherichia coli cells expressing heterologous genes. Appl Environ Microbiol. 63: 4651 – 4656. Hahm DH, Pan J, Rhee JS. 1994. Characterization and evaluation of a pta
(phosphotransacetylase) negative mutant of Escherichia coli HB101 as production host of foreign lipase. Appl Microbiol Biotechnol. 42: 100 – 107.
Hayashi K, Morooka N, Yamamoto Y, Fujita K, Isono K, Choi S, Ohtsubo E, Baba T, Wanner BL, Mori H, Horiuchi T. 2006. Highly accurate genome sequences of the Escherichia coli K-12 strains MG1655 and W3110. Mol Syst Biol. doi:10.1038/msb4100049.
Ho HT, PJ Falk, KM Ervin, BS Krishnan, LF Discotto, TJ Dougherty, MJ Pucci. 1994. UDP-N-acetylmutamyl-L-alanine function as an activator in the regulation of the Escherichia coli glutamate racemase activity. Biochem.
34: 2464 – 2470.
Hoppner TC, Doelle HW. 1983. Purification and kinetic characteristics of pyruvate decarboxylase and ethanol dehydrogenase from Zymomonas mobilis in relation to ethanol production. Eur J Appl Microbiol Biotechnol.
17: 152 – 157.
Huffer S, Clark ME, Ning JC, Blanch HW, Clark DS. 2011. Role of alcohols in growth, lipid composition, and membrane fluidity of Yeasts, Bacteria, and Archaea. Appl Environ Microbiol. 77: 6400 – 6408.
[IEA] International Energy Agency. 2008. From 1st to 2nd-generation Biofuel Technologies. An Overview of Current Industry and RD & D Activities. Paris Cedex (FR): OECD/IEA.
Ingram LO, Conway T, Clark DP, Sewell GW, Preston JF. 1987. Genetic engineering of ethanol production in Escherichia coli. Appl Environ Microbiol. 53: 2420 – 2425.
Ingram LO, Lai X, Moniruzzaman M, Wood BE, York SW. 1997. Fuel ethanol production from lignocellulose using genetically engineered bacteria. In: Saha, Badal C, Woodward, Jonathan, editor. Fuels and Chemicals from Biomass volume 666 and ACS Symposium Series; 1997 May 1st; Washington DC, USA. Washington (US): American Chemical Society. page 57 – 73.
Ingram LO, Vreeland NS. 1980. Differential effects of ethanol and hexanol on
Escherichia coli cell envelope. J Bacteriol. 144: 481-488.
Jeppsson M, Johansson B, Hahn-Hagerdal B, Gorwa-Grauslund MF. 2002. Reduced oxidative pentose pathway flux in recombinant xylose-utilizing
Saccharomyces cerevisiae strains improves the ethanol yield from xylose.
Appl Environ Microbiol. 68: 1604 – 1609.
Kayser A, Weber J, Hecht V, Rinas U. 2005. Metabolic flux analysis of
Escherichia coli in glucose-limited continuous culture. I. Growth-rate-dependent metabolic efficiency at steady state. Microbiol. 151: 693 – 709. Koolman J, Roehm KH. 2005. Color Atlas of Biochemistry. Stuttgart (DE): Georg
Thieme Verlag.
25
Luli GW, Strohl WR. 1990. Comparison of growth, acetate production, and acetate inhibition of Escherichia coli strains in batch and fed-batch fermentations. Appl Environ Microbiol. 56: 1004 – 1011.
Ma M, Liu Zl. 2012. Molecular mechainsms of ethanol tolerance in
Saccharomyces cervisiae. Inside: Liu ZL, editor. Microbial Stress Tolerance for Biofuels; 2012; London (UK): Springer.
Madigan MT, Martinko JM, Stahl DA, Clark DP. 2012. Brock: Biology of Microorganism 13th Ed. Espinoza D, editor. San Francisco (US): Benjamin Cummings.
Moat AG, Foster JW, Spector MP. 2002. Microbial Physiology 4th Edition. New York (US): Wiley-Liss inc.
Ojima Y, Suryadarma P, Tsucida K, Taya M. 2012. Accumulation of pyruvate by changing the redox status in Escherichia coli. Biotechnol Lett. 34: 889-893.
Peng L, Shimizu K. 2003. Global metabolic regulation analysis for Escherichia coli K12 based on protein expression by 2-dimensional electrophoresis and enzyme activity measurement. Appl Microbiol Biotechnol. 61: 163 – 178. Peterson JD, Ingram LO. 2008. Anaerobic Respiration in engineered Escherichia
coli with an internal electron acceptor to produce fuel ethanol. Ann NY Acad Sci. 1125: 363-372.
Pipper PW. 1995. The heat shock and ethanol stress responses of yeast exhibit extensive similarity and functional overlap [minireview]. FEMS Microbiol Lett. 134: 121 – 127.
Pratviel-Sosa F, Mengin-Lecreulx D, van Heijenoort J. 1991. Over-production, purification and properties of the uridine diphosphate N-acetylmuramoyl-L-alanine: D-glutamate ligase from Eschercihia coli. Eur J Biochem 202: 1169 – 1176.
Reece JB, Urry LA, Cain ML, Wasserman SA, Minorsky PV, Jackson RB. 2011.
Campbell Biology 9th Edition. San Francisco (US): Pearson Education Inc. Roth GW, Mary PL, Dietzler DN. 1985. Osmotic stress drastically inhibits active transport of carbohydrates by Escherichia coli. Biochem Biophys Res Comm. 126: 434 – 441.
Schellenberg GD, Furlong CE. 1977. Resolution of the multiplicity of the glutamate and aspartate transport systems of Escherichia coli. J Biol Chem
252: 9055 – 9064.
Schwechheimer C, Kuehn MJ. 2015. Outer-membrane vesicles from gram-negative bacteria: biogenesis and fucntions [review]. Nature Rev Microbiol. 13: 605 – 619.
Shaw JA, Mol PC, Bowers B, Silverman SJ, Valdieviso MH, Duran A, Cabib E. 1991. The function of chitin synthases 2 and 3 in the Saccharomyces cerevisiae cell cycle. J Cell Biol. 114: 111 – 123.
26
Steinsiek S, Bettenbrock K. 2012. Glucose transport in Escherichia coli mutant strains with defects in sugar transport systems. J Bacteriol. 194: 5897 – 5908.
Suryadarma P, Ojima Y, Tsuchida K, Taya M. 2012. Design of Escherichia coli
cell culture for regulating alanine production under aerobic condition. J Chem Eng Japan. 45: 604 – 608.
Swartz JR. 2001. Advances in Escherichia coli production of therapeutic proteins.
Curr Opin Biotechnol. 12: 195 – 201.
Underwood SA, Buszko ML, Shanmugam KT, Ingram LO. 2004. Lack of protective osmolytes limits final cell density and volumetric productivity of ethanologenic Escherichia coli KO11 during xylose fermentation. Appl Environ Microbiol. 70: 2734- 2740.
Van Heijenoort J. 2001. Recent advances in the formation of the bacterial peptidoglycan monomer unit. Nat Prod Rep. 18: 503 – 519.
Vemuri GN, Altman E, Sangurdekar DP, Khodursky AB, Eiteman MA. 2006. Overflow metabolism in Escherichia coli during steady-state growth: transcriptional regulation and effect of the redox ratio. Appl Environ Microbiol. 72: 3653 – 3661.
Vollmer W, Blanot D, de Pedro MA. 2008. Peptioglycan structure and architecture [review]. FEMS Microbial Rev. 32: 149 – 167.
Wolfe AJ. 2005. The acetate switch [review]. Microbiol Mol Biol Rev. 69: 12 – 50.
27
APPENDIXES
Appendix 1 Procedure of glucose kit (Roche)
Pipette into cuvettes Blank Sample
Solution 1 Mix and read absorbances of solutions (A1) after approx. 3 min. Start
reaction by addition of:
Suspension 2 0.020 mL 0.020 mL
Mix, wait until the reaction has stopped (approx. 10-15 min) and read the absorbances of the solutions (A2).
If the reaction has not stopped after 15 min, continue to read the absorbances at 2 min intervals until the absorbance increases conctantly for 2
min.
If the absorbance A2 increases constantly, extrapolate the absorbance to
the time of the addition of suspension 2. Determine the absorbance differences (A2-A1) for both, blank and sample. Substract the absorbance difference of the
blank from the absorbance difference of the sample. ∆� = �2− �1 � � − �2− �1
The measured absorbance differences should, as a rule, be at least 0.100 absorbance units to achieve sufficiently precise results.
Calculation
According to the general equation for calculating the concentration: = ×
�× ×�× 1000×∆� [�/ ]
V = final concentration [mL]
v = sample volume [mL]
MW = molecular weight of the substance to be assayed [g/mol]
d = light path
28
Appendix 2 Research database in glucose kit analysis
Test Cultivation time
Glucose remaining
Blank Sample
∆A Dilution Glucose
consumption Average Stdev
A1 A2 ∆blank A1 A2 ∆sample
Control (1) 24 7.457 0.085367 0.154480 0.069113 0.111189 1.906500 1.795311 1.726198 10 29.002
29.035 0.045701
Control (2) 24 7.393 0.085367 0.154480 0.069113 0.144650 1.925000 1.780350 1.711237 10 29.067
20 gL-1 Ethanol (1) 24
17.570 0.085367 0.154480 0.069113 0.129020 1.214900 1.085880 1.016767 40 18.890
17.957 0.853849 20 gL-1 Ethanol (2) 24
18.693 0.085367 0.154480 0.069113 0.134430 1.285300 1.150870 1.081757 40 17.767
20 gL-1 Ethanol (3) 24 19.245 0.085367 0.154480 0.069113 0.150150 1.333000 1.182850 1.113737 40 17.214
20 gL-1 Ethanol and 2
gL-1 glutamate (1) 24 16.428 0.085367 0.154480 0.069113 0.106860 1.443600 1.336740 1.267627 30 20.031
21.518 1.34774 20 gL-1 Ethanol and 2
gL-1 glutamate (2) 24 13.801 0.085367 0.154480 0.069113 0.118390 1.252400 1.134010 1.064897 30 22.658
20 gL-1 Ethanol and 2
29
Appendix 3 Organic acids standard curve in HPLC analysis
30
BIOGRAPHY
Indra Kurniawan Saputra was born in Sumbawa Besar, West Nusa Tenggara Province in 15th August 1989, as father H. Syafruddin S.Pd and mother Hj. Hayati. The author is first son from 3 siblings. The author was accepted as bachelor student in Biochemistry Department, Math and Science Faculty Bogor Agricultural University, and graduated with a science degree in Biochemistry. Afterward, continued master in same university in Biotechnology Programs.
During in Bogor Agricultural University, the author had many achievements; as prospective innovator that given by Ministry of Research and Technology, Republic of Indonesia together with Business Innovation Center (BIC), the most outstanding student of IPB period from May to August in extracurricular field. Then, in PIMNAS XXIV Hasanuddin University (Makassar, South Sulawesi) was held by Ministry of National Education, Republic of Indonesia. In that event, the author got two medals; gold medalist on National Environmental Supporting Contest and silver medalist on Research Creative Student Programs. The author was scholarship awardees of Bakrie Center Foundation (BCF) for cover thesis research and master fee, and the author was crowned as the best paper presenter in 2015 3rd International Conference on Adaptive and Intelligent Agro-industry (ICAIA).
Moreover, in Bogor Agricultural University, Indra began his organizational experience as staff of social and prosperity student of student executive agency TPB IPB, as staff of FORCES (Unit Student Activity in Scientific area), as chairman of CREBs (Professional Association of Biochemistry), and currently as member in Indonesia Biochemistry and Biology Molecular Association. The author also had worked at Biochemistry Department as executive assistant practical with subject “Structure and Functions of Bimolecular”, as assistant researcher at Indonesian Center for Post-Harvest and at Indonesian Center for Agricultural Biotechnology and Development (ICABIOGRD).
The author’s papers had been published with title “brilliant use of refuse” in book “Indonesia 104 innovations”, Business Innovation Center publisher, “Isolasi dan Nanoenkapsulasi Karotenoid Limbah Serat Buah Kelapa Sawit”, Proceeding and Scientific Seminars Indonesian Student throughout Europe, ISSN: 9-772302-690005, and “Enhancing Ethanol Tolerant of Escherichia coli