.*{$;;:iffieffiffiffiffi,,ffi
Service
Volue lnnovotion ond
Chollenges
-December
9
-
12,2AA7,
The
Ambossodor
Hotei, Koohsiung,
Toiwon-Asio
Pocific
lndusiriol
Chinese
Sponsor
Engineering
ond Monogement
Soclety
lnsliiute
ol
lnduslrlol
Engineers.;
Conference Orgonizer
Deportmenl
of lnduslriol Engineeringond
Monogemeni
Nollono
Yunlin Univenity of Scienceond
lechnology
:
I
APIEMS&CIIEmi7
KAOHSIUNG
Proceedings
ofThe
8th Asiir Pacitic Industlial Engineering&
ManageDent S),stem and2007 Chinese InstitLrte of Indush ial Eneineels
Confflcncc
December 9-12,2007
Kaohsiung, Taiu,an
Sponsor
Asia Pacilic lnclustrial
Fngit]ee
ng and l\{anagetnellt SocieryAPIEMS&CilEM7
KAOHSIU
NG
Published by
Dcpaltmenl
of
lndustlial Engineering and \4anagerlenl National Yunlinlinive|sitv ofScie[ce
and Technoloevl2i.
Uni\ersit-1 Road. Secrion 3. Douliu, Yunlin 64002. Taiu.an. R.O.C.Dccember 2007 Edition
A11 co1.respondcncc rclaring ro the contcnt
ofthis
publicario|
should be addressed toDr
Cllau-Chen TornsDepanrncnt
olIndustrial
Enginee
ng and N4anagcmelttNational Yunljn
Unirersity of
Science and TechnologyTel:
886-5--<3.12601#5 1.19Fax: 886r 5
F5l11013E-mai1 : apiemsi.aluntech.cdu.trv
Wcbsite:
http:iln\\{..apjems.!untech.edu.tu.
Printed in Tairvan
by
Depanmcrt
of Industrial Engineelingtnd
N,lanagcmentISBN: 978-986 0l-1 761 -5
Advisorv
organization
National Scierce Council
Ministry
of EconomicAt'airs,
R.O.C.Ministry
of Education, R.O.C.Sponsor
Asia Pacific lodustrial
Elgineering
&
Management SocietyChrn<.< ln5riture
of
lndtisrri.rl LngineersConference
Orqanizer
National
Yunlin
Univcrsityof
Science and TechnologyCo-organizer
The Govemmcnt
ofKaohsiung City
The Government
of
Kaohsiurlg CountyChincsc Sociely
lbr
MaragementofTechnology
Chinese Society for
Quality
Chinese Society of Managcmont Scielce
Ergonomics Society of Taiwan
l-Shou University
National Kaohsiung University
ofApplied
ScienceNational Sun Yat-Sen
University
Natio0al University of Kaohsiung
Operations Research Society of Taiwan
Tairvanese Association of
Artihcial
lntelligenceI clu'an
Logr.ric.
Vanagemenl A.socirrionCo-Sponsor
Ardentec ColporationAdvanccd SemicondLlctor Engineering lnc.
China Steel Corporation
Siliconware Precision Industrics Co..
Ltd
Table of Contents
Session M3-R01
Comp.trisons ofth€ Srmmetric and Aslnrmetric Control Linlits lbr R Chart!... ... ... .. 1
Htifen Chek, Wbi-Luh Kto
l'he Fusi'n Six Sigmn Cas€ Study: ReduciDgWav€ Solde ng Delects in ,n El€ctronic tndustry..l
Pi<l1it Sukchdreonpong, JarunSahs.tae.
a
d vinit ThuedkthoigSir Sigma and Balanccd Storetrrd: Complementary Approaches... ...
.I
Sdru Behdatl, Saeed Man\ouL anl Fnhi,neh Moha tnt.ulidn
A Ntodified Control Scl!cme lor F.rction Notrcontbrming under Nlarkov Depend€nt Processes ...2
Pei-tlr
Chen, Ch en-Sheng Cl,engrorecaiting
{ith
X-12-.A.RI\{A: intel.nation!l touri!t arrivrls n} Indir and Thailnnd...2Chukidt Chdiboo sti, Pmsci Chaiti?, N. Ranedsw.t
r
Scssion M3-R02
-{n Optimal Policl for CSP-l
xith
lnspection Errors and Return Cost... ... ... .. ... ...2Hohg-F)t, vu, fi'en-Chi g
lr,
md llen Ping h1tEconoaric Produciion Quantilt
*ith
lmpcrfcct Production Processes and Lcrrning trffects... .2Estimating the Stage Completion I im€ tnd ihe Internal Due Datc in tlexible Flow Shops lYith
Dlnamic Ar riral
...
. ... ... ...1Ming-Hsien Ya g, Sht-Hsing Chung, akd Chikg-Ku.i Kao
lntegrated Optjmal Economic Production Quantit.l and Prevertive Xlaintenxnc€ P|an...3
Stu -Jheng S!\1, dn.l Y,t in Kuo
A Decomposition Approach lbr a T$o-Nlnchine
nor
Shop Sequencing nith Time ConstrrintYdiitl Kuo-
H
san-H
YaScssidn lV3-R03
Ming-ShaD Lu. ntng Chi? Hsieh, Jding lthk va
Prcdicti0n of Defed Inspection Cyclc
l
ime in TFT-LCD Panel X!xnuf4cturing... ...,..,...213Chien-Wen SlPn, Ctuio-Fa Ch.n
Customer Pretercncc hrsed Product Conliguration and RetrieYing for Mass Customization using
Jaeho Lee, Joon tbung Patk
Pel.formance Eraluation of an -{ssemble-To-Order Sysiem Operatcd hy th€ CONWIP Cont.ol
Chak-Wtu Putk, H)o-Seong Lee
Session Wl-R04
A Soft ComputingApproach in Predictive Crstomer Behavior Modelitrg for Customcr
Rela tionship Nlanagemcrt
...,
...,... ... ... ...215Y ng-Hsin Chcn,.hti-Chen Hsu
A System DJnsmics Nlodel for Collaborati!e Forecasting ofDemnnd Chain
-
Takinglhilrnn
NIotherboird Industry asExanlp1e...
..
...,... .. 215Mikg-Kuen Chen. Chie -Hsin Wang , Kudne-Hud P.ti
AnalJsii ofthe Behaviors ofllulti-Robots that lmplemcntlnt Colony Clustcring Using N{ohilc
Osaw Sato , M.tsttikt Ugdiin , vanfiit't, Tsuji'n ru
'
Hisashiva
dnoto, v,,sashi Kahlbr6hi
Construction of Nlachine \Iodel for Corrug.rted Board \{aking in Paper Laboratory...,...217
hlittav Koewsuhsak, Suchdpa Ne1trudit, Tanaton Tongs untith
AStudIontheEftcctofConsutnerHeterogencityBascdotrPerctivedPrice...,...217
Sessiotr Wl-R05
Sattt\ -first Po rtfolio Optimizatior Pro ble m using -{ppronmntcd tail Distribution ...-...- 2 I 8 Kto-Hwd Chang, v"-Lin Chidng, Mihg-Kuan Wei,liFTing Chott
tr\act Solution oflnlentory Replenishmcnt Polic) lor Deteriorating Items rYith Linearly
Incrersing Demand
...
... ...--..- 21 8Iyan-Yang Lo
Expccted Return vs. Volatility: Lcssons from the Time-Series and Cmss-Scctional Factors Undcrlying Taiwan Stock Retu rns
...,...
...- -21gPetet A, Ahn ewakn , Ming-Hsiahg Che , Ming'Chang Che g
A Scmi Hierrrchical Cluster-A.nalysis of Genome-wide Expressiotr
D.tr
and a Casc Study... ...219Kao-Sheng Lin, Cheh-Fu Chien
A Particle Swarn Optimization for the Vehicle Routing Problemwith Clustered Customcr\..--220
The Jin Ai, Vorotas Kachittichrdkukul
Session Wl.R06
How Effcctivc is Government Support for Korean Women Entrepreneurs in Smrll and Medium
Jong Hd Lac, So Youhg Sohn
Integrated Competency-Based Human Resource Managcment System: lmplemented Nlodcl in Indonesian Croryn
Corporations...-....
...--..22lThc Dcterminant ofBi-nationrl Mrnpower Disposing: Optimal Employee Rrtios ofOut-sourcing
T)iruke T.
Li
,Chuk-Lin ChenRealizing a Stratcgic Htrman Resource Mrnag€ln€nt through Accourt Management Approach
222
Charrcteristics ofEnvironnlcnt,rl Management itr the Chinese Company ... ... ... ...223
Li Ke
S€ssion W1-R07
Developing a Coupling oriented Algo rithm in Process f{ode|... ... .,,,,..,...-..-....,....224
H"k-fi Jcn. t hi-Luong Ch?n. Ch?ne-Ho T\ti
-39
A Particle Swarm Optimization for the Vehicle Routing Problem with
Clustered Customers
The Jin Ai 1* and Voratas Kachitvichyanukul 2
1,2
Industrial Engineering and Management, School of Engineering and Technology Asian Institute of Technology
P.O. Box 4, Klong Luang, Pathumtani 12120, THAILAND
1
Corresponding author, E-mail: [email protected]
2
E-mail: [email protected]
Abstract: This paper presented a particle swarm optimization algorithm (PSO) for solving vehicle routing problem (VRP) which involves single depot and clustered customers. Three different solution representations and decoding methods are proposed for solving VRP using PSO. These representations are similar in the use of particle with 2m dimension to represent m vehicles. In the decoding step, these particle dimensions are transforming to a priority matrix of vehicle to serve each customer. These representations are different on how to create customer priority list: the first representation directly uses the customer list data as the customer priority list; the second preprocesses the customer list data according to its polar angle as the customer priority list; the third uses random-key to build the customer priority list. The customer priority list and vehicle priority matrix are utilized for constructing vehicle routes at the end of the decoding step. A computational experiment is conducted by applying the proposed algorithm on the benchmark data set of capacitated vehicle routing problem (CVRP) and the vehicle routing problem with time windows (VRPTW). The result showed that the proposed algorithm with the third representation is the most effective to solve CVRP and VRPTW problems.
Keywords: Vehicle Routing Problem, Clustered Customers, Particle Swarm Optimization, Solution Representation.
1. INTRODUCTION
Recently, the Particle Swarm Optimization (PSO) had been applied for solving the Capacitated Vehicle Routing Problem or CVRP (Chen et al., 2006; Ai and Kachitvichyanukul, 2007). The CVRP is the basic variant of the Vehicle Routing Problem (VRP), which is a problem to design a set of vehicle routes in which a fixed fleet of delivery vehicles of uniform capacity must service known customer demands for a single commodity from a single depot at minimum cost. The general requirements of this problem are (1) each route starts and ends at the depot, (2) each customer is visited exactly once by exactly one vehicle, (3) the total demand of each route does not exceed vehicle capacity, and (4) the total duration of each route (including travel and service times) does not exceed a preset limit. Christofides et al. (1979) provided a comprehensive review on problem formulation and solution methods for the CVRP.
Particle Swarm Optimization (PSO) is a population based search method proposed by Kennedy and Eberhart (1995), which were motivated by the behavior of group organism such as bee swarm, fish school, and bird flock. PSO imitated the physical movements of the individuals in the swarm as a searching method, altogether with its cognitive and social behavior as local and global exploration abilities. In the PSO, a solution of a specific problem is being represented by a position of an n-dimensional particle. The particle searches for solution by moving through search space with a velocity vector. The PSO algorithm starts with population of particles with random initial position and velocity. The population of particles is usually called a swarm. In one iteration step, every particle is moved from previous position to the new position based on its velocity; and its velocity is updated based on its personal best position and the global best position obtained so far. Once a particle reach a position which has a better objective function than the previous best objective function for this particle, the personal best position is updated. Also, if it found better objective function than the previous best objective function of the whole swarm, the global best position is updated. A brief and complete survey on PSO mechanism, technique, and application is provided by Kennedy and Eberhart (2001) and also Clerc (2006).
larger problem with faster computational time than the discrete value PSO, even though the real value PSO is implemented without any local search or other hybrid method (Ai and Kachitvichyanukul, 2007).
This paper studies further the capability of the real value PSO by focus only on the problem with single depot and clustered customers and extend the work not only for the capacitated problem, but also for the vehicle routing problem with time window (VRPTW). The VRPTW extends the CVRP by one additional set of constraints, in which each customer must be served by a vehicle within a certain given time window. Three different solution representations and its decoding method for transforming particle to vehicle route are proposed here based on the real value PSO for CVRP (Ai and Kachitvichyanukul, 2007). The PSO framework for CVRP is also extended to the general VRP and applied here using three different solution representations and decoding methods.
The remainder of this paper is organized as follow: Section 2 reviews PSO framework for solving VRP. Section 3 explains the proposed solution representations and decoding methods. Section 4 discusses the computational experiment of the PSO on benchmark data set. Finally, Section 5 concludes the result of this study.
2. PSO FRAMEWORK FOR SOLVING VRP
The PSO framework for solving VRP is presented in Algorithm 1 for review purpose. The algorithm is exactly same with the PSO framework for CVRP (Ai and Kachitvichyanukul, 2007), which is developed based on GLNPSO, a PSO Algorithm with multiple social learning structures (Pongchairerks and Kachitvichyanukul, 2005).
In this algorithm, the particles are initialized in step 1, their corresponding fitness value are evaluated in steps 2-3, their cognitive and social information are updated in steps 4-7, and their positions are updated in step 8. Step 9 is the controlling step for repeating or stopping the iteration. This framework can be applied to different VRP variant with different solution representation by changing the decoding method in step 2.
Notation
t : Iteration index; t=1…T
i : Particle index, i=1…I
d : Dimension index, d =1…D
u : Uniform random number in the interval
[ ]
0,1( )
w t : Inertia weight in the th iteration
t
( )
id
v t : Velocity of the ith particle at the dth dimension in the tth iteration
( )
id
x t : Position of the ith particle at the dth dimension in the tth iteration
id
p : Personal best position (pbest) of the th particle at the dimension
i th
d
gd
p : Global best position (gbest) at the th dimension
d L
id
p : Local best position (lbest) of the th particle at the dimension
i dth
N id
p : Near neighbor best position (nbest) of the th particle at the dimension
i th
d
p
c : Personal best position acceleration constant
g
c : Global best position acceleration constant
l
c : Local best position acceleration constant
n
c : Near neighbor best position acceleration constant
i
X : Vector position of the th particle,
i ⎡⎣xi1 xi2 xiD⎤⎦
i
V : Vector velocity of the ith particle, ⎣⎡vi1 vi2 viD⎤⎦ i
P : Vector personal best position of the ith particle, ⎣⎡pi1 pi2 piD⎤⎦ g
P : Vector global best position, ⎡⎣pg1 pg2 pgD⎤⎦
L i
P : Vector local best position of the ith particle, 1 2
L L L
i i iD
p p p
⎡ ⎤
⎣ ⎦
Algorithm 1: PSO Framework for VRP
1. Initialize particles as a population, generate the I ith particle with random position Xi in the range ,
velocity and personal best for
min max , x x ⎡ ⎤ ⎣ ⎦ 0 i
2. For i=1…I, decode X t to a set of vehicle route i
( )
Ri.3. For i=1…I, compute the performance measurement of Ri, and set this as the fitness value of Xi, ϕ
( )
Xi . 4. Update pbest: For i=1…I, update Pi =Xi, if ϕ( ) ( )
Xi <ϕ Pi .5. Update gbest: For i=1…I, update Pg =Pi, if ϕ
( )
Pi <ϕ( )
Pg .6. Update lbest: For i=1…I, among all pbest from K neighbors of the particle, set the personal best which obtains the least fitness value to be
th i L
i
P .
7. Generate nbest: For i=1…I , and d=1…D, set pidN = pjd that maximizing fitness-distance-ratio (FDR ) for 1
j= …I. Where FDR is defined as
( )
i( )
id jd
j
X P FDR
x p
ϕ −ϕ
=
− which i≠ j (1)
8. Update the velocity and the position of each ith particle:
( ) ( )
( ) ( )
1 1t T
w t w T w w T T
−
= + ⎡⎣ − ⎤⎦
− (2)
( ) ( ) ( )
1(
( )
)
(
( )
)
(
L( )
)
(
N( )
id id p id id g gd id l id id n id id
v t+ =w t v t +c u p −x t +c u p −x t +c u p −x t +c u p −x t
)
(3)( )
1( )
( )
1id id id
x t+ =x t +v t+ (4)
9. If the stopping criterion is met, i.e. t=T , stop. Otherwise, t= +t 1 and return to step 2.
3. SOLUTION REPRESENTATIONS AND DECODING METHODS
[image:10.595.153.447.553.744.2]Previous work of PSO for CVRP used a solution representation that incorporating idea of representing each vehicle by reference point in two-dimensional Cartesian map (Ai and Kachitvichyanukul, 2007). The reference point is called vehicle route orientation within this paper. Route orientation of a vehicle is defined as a point in the service map that represents a certain area in which the vehicle is most likely to serve. As a consequence, a vehicle route will tend to aggregate around its corresponding route orientation. A simple illustration of relationship between vehicle route and route orientation is shown in Figure 1. It is seen that each vehicle covers certain service area that can be represented by the route orientation point. The computational result of previous work of PSO for CVRP also showed that the idea of vehicle route orientation is effective for problems with clustered customers.
This paper explored further the idea of vehicle route orientation by proposing three different solution representations and testing them on VRP with clustered customers. These representations are using the same idea of vehicle route orientation in which a particle will consist of 2m dimensions representing m vehicles. In the decoding process, every two dimensions of position are transformed to a vehicle route orientation point on a Cartesian map. The differences among these representations are related to the additional dimensions of particle and the specific steps in the decoding method for constructing vehicle routes.
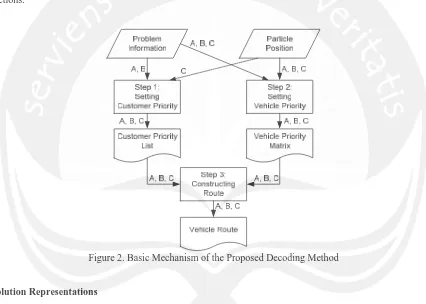
The basic mechanism of the proposed decoding methods is illustrated in Figure 2. Three steps are taken in order to decode the solution representation into VRP solution. First, extract customer list data or customer coordinate from the problem information or the corresponding particle position to make a priority list of customers. Second, convert the corresponding 2m dimensions into the route orientation point of vehicles and use this information altogether with the customer coordinate to create priority matrix of vehicles. Third, construct the vehicle routes based on the customer priority list and vehicle priority matrix.
[image:11.595.84.510.275.579.2]The major differences among the decoding method of the three solution representations (A, B, and C), are also shown in Figure 2. In step 1 of the decoding method, solution representations A and B only used the problem information such as customer list data and customer coordinate, while solution representation C is using both the problem information and particle position. The details of each solution representations and decoding step will be discussed in the following sub-sections.
Figure 2. Basic Mechanism of the Proposed Decoding Method
3.1 Solution Representations
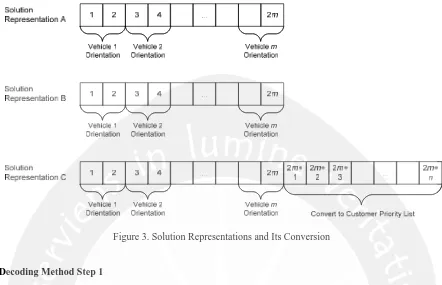
Solution representations A and B are different with solution representation C in term of the numbers of particle dimension. While the solution representation A and B use 2m dimensional particle, the solution representation C needs 2m+n dimensional particle to represent solutions for VRP with n customers and m vehicles. Each particle dimension is encoded as a real number. For all representations, the 2m dimensions are related to vehicles, each vehicle is represented by two dimensions. These dimensions will be extracted as the orientation point of vehicles in the Cartesian map.
Figure 3. Solution Representations and Its Conversion
3.2 Decoding Method Step 1
The first step of decoding method is setting a priority list of customers. Each solution representation is using different method to create the customer priority list. The customer list data, which is a list of customer ID in the original problem data set, is directly used as the customer priority list for solution representation A; The customer list data is preprocessed according to its polar angle as the customer priority list for solution representation B; The n dimensions of particle is converted to the customer priority list for solution representation C.
No further explanation is needed for the first step of decoding method for solution representation A. The details of the step for solution representation B and C is presented in Algorithm 2 and 3, respectively.
Algorithm 2: Step 1 of Decoding Method for Solution Representation B 1. Calculate the polar angle of each customer relative to the depot. 2. Sort the customer index based on its polar angle in ascending order. 3. Take the sorted customer index as the customer priority list.
Algorithm 3: Step 1 of Decoding Method for Solution Representation C
1. Take out the last n dimension of position value as the corresponding position value of customers. 2. Sort the customer index based on its corresponding position value in ascending order.
3. Take the sorted customer index as the customer priority list.
Note that the customer priority list for solution representations A and B remain the same for all particles during overall iterative process. Hence, it is only predetermined once before the iteration process begin. In term of computational effort, this is an advantage of these solution representations over the solution representation C in which the customer priority list must be updated for every particles in each iteration.
3.3 Decoding Method Step 2
The second step is to extract the route orientation point of vehicles and to construct the priority matrix of vehicle. The matrix is constructed based on the relative distance between these points and customers location. The distance can be calculated as long as the reference points and the customer locations are placed in the same Cartesian map. A customer is prioritized to be served by vehicle with closer distance. For convenience of the subsequent step, each row in the matrix keeps the vehicle priority for serving customer with the same index in the customer priority list.
Algorithm 4: Step 2 of Decoding Method
1. Take out the 2m dimension of position value as the vehicle route orientation points. 2. For each customer in the customer priority list:
a. Calculate the Euclidean distance between the customer and vehicle route orientation points. b. Sort the vehicle index based on its Euclidean distance in ascending order.
c. Take the sorted vehicle index as the corresponding row for the customer in the vehicle priority matrix.
3.4 Decoding Method Step 3
The last decoding step is to construct routes based on the customer priority list and the vehicle priority matrix. One by one each customer in the customer priority list is assigned to a vehicle based on its priority and other problem constraints, such as vehicle capacity constraint, service duration constraint, and time window constraint. This newly assigned customer may be inserted to the best sequence in the existing vehicle route based on the least additional cost. This heuristic is usually called the cheapest insertion heuristic. Another effort to improve solution quality of the route is to re-optimize the emerging route using some improvement heuristic methods, i.e. 2-opt method. The detail of this step is described in Algorithm 5. This step is also identical for all representations.
Algorithm 5: Step 3 of Decoding Method
For each customer in the customer priority list, starting from the first to the last priority: 1. Set j as the first vehicle priority of the customer.
2. Make a new candidate route by inserting the customer to the position which has the smallest additional cost in route j. 3. Check feasibility of the candidate route by evaluating all constraints: vehicle capacity, service duration, and time
window constraints.
4. If a feasible solution is reached, update route j with the candidate route and re-optimize emerging route with 2-opt method; then return to step 1 with the next customer.
5. If the candidate route is infeasible, set j as the next vehicle priority of the customer; then go to step 2.
4. COMPUTATIONAL EXPERIMENTS
Computational experiment is conducted in order to evaluate the effectiveness of each solution representations. All solution representations are tested using the same PSO Algorithm (Algorithm 1 in section 2) and the same benchmark problems of CVRP and VRPTW. Four problems with clustered customers from the CVRP benchmark data (Christofides, 1979) are used, which are consists of 100 customers (vrpnc12 and vrpnc14) and 120 customers (vrpnc11 and vrpnc13). For VRPTW case, seventeen problems of 100 customers from benchmark data of Solomon (1987) are used (C101 – C109, C201 – C208).
The algorithm is implemented in C# language using Microsoft Visual Studio.NET 1.1 on a PC with Intel P4 3.4 GHz – 1 GB RAM. For each data set, 5 replications of the algorithm are tried. The PSO parameters are set similar with the
previous work of Ai and Kachitvichyanukul (2007). The parameters are: Number of Particle, ; Number of
Iteration, ; Number of Neighbor,
100
I =
1000
T = K=5; First inertia weight, w
( )
1 =0.9; Last inertia weight, w T( )
=0.4;Personal best position acceleration constant, cp =0.5; Global best position acceleration constant, ; Local best position acceleration constant, ; Near neighbor best position acceleration constant, . The range of initial
position is 0.5 g c = 1.5 l
c = cn=1.5
[
]
min max
, 0,1
X X
⎡ ⎤ =
⎣ ⎦ 00 , since the position of customer and depot in the map for all problem is located within
this range.
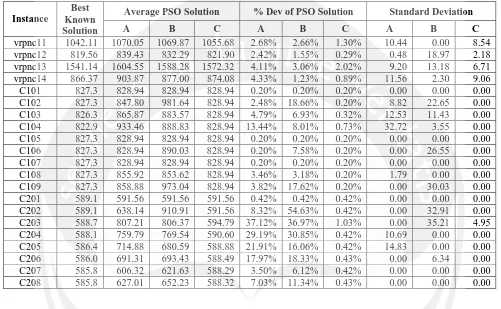
Summary of the computational result is presented in Table 1 comprise of the average of objective function values, the percentage deviation of the average values from the best known solution (% Dev), and the standard deviation of the objective function of each instance using three proposed solution representations. The percentage of deviation from best-known solution is calculated by the following equation:
* % 100%
*
Dev ϕ ϕ
ϕ−
= × (5)
where
% Dev : Percentage of deviation from best-known solution
ϕ : Objective function of current solution
*
Information about the best known solution for CVRP instance is obtained from the VRP-Web (http://neo.lcc.uma.es/radi-aeb/WebVRP/index.html?/results/BestResults.htm) and for VRPTW is obtained from the Solomon’s website (http://web.cba.neu.edu/~msolomon/problems.htm).
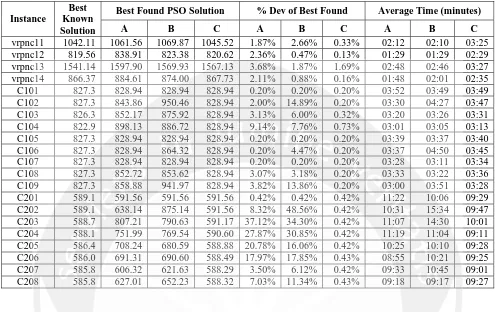
[image:14.595.48.549.189.498.2]The best found solution among iterations and the average computation time (displayed as minutes: seconds) for each instance using three proposed solution representations is summarized in Table 2.
Table 1. Summary of PSO Solution: Average, % Dev, and Standard Deviation
Average PSO Solution % Dev of PSO Solution Standard Deviation
Instance
Best Known
Solution A B C A B C A B C
vrpnc11 1042.11 1070.05 1069.87 1055.68 2.68% 2.66% 1.30% 10.44 0.00 8.54
vrpnc12 819.56 839.43 832.29 821.90 2.42% 1.55% 0.29% 0.48 18.97 2.18
vrpnc13 1541.14 1604.55 1588.28 1572.32 4.11% 3.06% 2.02% 9.20 13.18 6.71
vrpnc14 866.37 903.87 877.00 874.08 4.33% 1.23% 0.89% 11.56 2.30 9.06
C101 827.3 828.94 828.94 828.94 0.20% 0.20% 0.20% 0.00 0.00 0.00
C102 827.3 847.80 981.64 828.94 2.48% 18.66% 0.20% 8.82 22.65 0.00
C103 826.3 865.87 883.57 828.94 4.79% 6.93% 0.32% 12.53 11.43 0.00
C104 822.9 933.46 888.83 828.94 13.44% 8.01% 0.73% 32.72 3.55 0.00
C105 827.3 828.94 828.94 828.94 0.20% 0.20% 0.20% 0.00 0.00 0.00
C106 827.3 828.94 890.03 828.94 0.20% 7.58% 0.20% 0.00 26.55 0.00
C107 827.3 828.94 828.94 828.94 0.20% 0.20% 0.20% 0.00 0.00 0.00
C108 827.3 855.92 853.62 828.94 3.46% 3.18% 0.20% 1.79 0.00 0.00
C109 827.3 858.88 973.04 828.94 3.82% 17.62% 0.20% 0.00 30.03 0.00
C201 589.1 591.56 591.56 591.56 0.42% 0.42% 0.42% 0.00 0.00 0.00
C202 589.1 638.14 910.91 591.56 8.32% 54.63% 0.42% 0.00 32.91 0.00
C203 588.7 807.21 806.37 594.79 37.12% 36.97% 1.03% 0.00 35.21 4.95
C204 588.1 759.79 769.54 590.60 29.19% 30.85% 0.42% 10.69 0.00 0.00
C205 586.4 714.88 680.59 588.88 21.91% 16.06% 0.42% 14.83 0.00 0.00
C206 586.0 691.31 693.43 588.49 17.97% 18.33% 0.43% 0.00 6.34 0.00
C207 585.8 606.32 621.63 588.29 3.50% 6.12% 0.42% 0.00 0.00 0.00
C208 585.8 627.01 652.23 588.32 7.03% 11.34% 0.43% 0.00 0.00 0.00
Table 1 shows that that the average objective function value of solution representation A and B is quite similar. It is also shown that the objective function values obtained from these representations are worse than the objective function values obtained from algorithm using solution representation C. This finding is emphasized by the analogues pattern of the best found objective function value in Table 2, in which the result of solution representation C is better than the result of solution representation A and B. The best found objective function of solution representation is C very close to the best known solution, in most case less than 0.5% deviation from the best known solution.
In term of standard deviation of the objective function value, Table 1 shows that the solution representation C also outperformed solution representations A and B. The standard deviation of C is generally smaller than A and B for each instance. More over, the standard deviation of C is consistently small, while unstable standard deviation is shown in the result of A and B. The results with small standard deviation demonstrate the robustness of the proposed method since the solutions among replications are very consistent even though the method is a random search algorithm.
Table 2. Best Found Solution and Average Computational Time
Best Found PSO Solution % Dev of Best Found Average Time (minutes) Instance
Best Known
Solution A B C A B C A B C
vrpnc11 1042.11 1061.56 1069.87 1045.52 1.87% 2.66% 0.33% 02:12 02:10 03:25
vrpnc12 819.56 838.91 823.38 820.62 2.36% 0.47% 0.13% 01:29 01:29 02:29
vrpnc13 1541.14 1597.90 1569.93 1567.13 3.68% 1.87% 1.69% 02:48 02:46 03:27
vrpnc14 866.37 884.61 874.00 867.73 2.11% 0.88% 0.16% 01:48 02:01 02:35
C101 827.3 828.94 828.94 828.94 0.20% 0.20% 0.20% 03:52 03:49 03:49
C102 827.3 843.86 950.46 828.94 2.00% 14.89% 0.20% 03:30 04:27 03:47
C103 826.3 852.17 875.92 828.94 3.13% 6.00% 0.32% 03:20 03:26 03:31
C104 822.9 898.13 886.72 828.94 9.14% 7.76% 0.73% 03:01 03:05 03:13
C105 827.3 828.94 828.94 828.94 0.20% 0.20% 0.20% 03:39 03:37 03:40
C106 827.3 828.94 864.32 828.94 0.20% 4.47% 0.20% 03:37 04:50 03:45
C107 827.3 828.94 828.94 828.94 0.20% 0.20% 0.20% 03:28 03:11 03:34
C108 827.3 852.72 853.62 828.94 3.07% 3.18% 0.20% 03:33 03:22 03:36
C109 827.3 858.88 941.97 828.94 3.82% 13.86% 0.20% 03:00 03:51 03:28
C201 589.1 591.56 591.56 591.56 0.42% 0.42% 0.42% 11:22 10:06 09:29
C202 589.1 638.14 875.14 591.56 8.32% 48.56% 0.42% 10:31 15:34 09:47
C203 588.7 807.21 790.63 591.17 37.12% 34.30% 0.42% 11:07 14:30 10:01
C204 588.1 751.99 769.54 590.60 27.87% 30.85% 0.42% 11:19 11:04 09:11
C205 586.4 708.24 680.59 588.88 20.78% 16.06% 0.42% 10:25 10:10 09:28
C206 586.0 691.31 690.60 588.49 17.97% 17.85% 0.43% 08:55 10:21 09:25
C207 585.8 606.32 621.63 588.29 3.50% 6.12% 0.42% 09:33 10:45 09:01
C208 585.8 627.01 652.23 588.32 7.03% 11.34% 0.43% 09:18 09:17 09:27
The computational time for all solution representation is generally reasonable short. It is shown in Table 2 that the computational time for CVRP instances are not more than 4 minutes, for VRPTW-C1xx instances are less than 5 minutes, and for VRPTW-C2xx instances are less than 16 minutes.
The hypothesis that the solution representations A and B lead to faster time than that obtained from solution representation C due to the effort to set the customer priority list is only demonstrated by the result of CVRP instances. It is clearly shown in Table 2 that the average computational time of solution representation A and B for CVRP instances are quite similar, while the solution representation C gives longer computational time. However, the hypothesis is not confirmed for the case of VRPTW since the computational time for all representations are mostly similar and there is no clear pattern in the computational time results. This result implies that the step of setting customer priority list is dominant in CVRP case, while it is not dominant in VRPTW case. The step for route construction is dominating the computational effort in the VRPTW case, in which extra effort for constraints checking is required.
It is also shown in Table 2 that the VRPTW-C2xx instances required much longer computational time than VRPTW-C1xx instances even though all instances are considering the same number of customers. This difference may came from the different number of vehicles and the computational process related to the number of vehicles. Note that instances C1xx use 10 vehicles to serve 100 customers, while instances C2xx use 3 vehicles to serve 100 customers. Smaller number of vehicles can reduce the computational effort in the step of setting vehicle priority, but it will increase the computational effort in the step for route construction. The effort reduction in the setting of vehicle priority is related to the distance calculation and sorting procedures, where the smaller number of vehicles leads to the faster procedures. The effort in the route construction step is for finding the best insertion point and re-optimizing using 2-opt method. The smaller number of vehicles means the larger number of customers in one route and it causes these steps to be slower. This computational result showed that the time required to construct the route is dominating the time required to set vehicle priority, so that the computational time for VRPTW-C2xx instances are longer than VRPTW-C1xx instances.
5. CONCLUSION
capable to increase the solution quality of the route. Also, the structure and mechanism of PSO are facilitating to generate diverse solutions and always maintaining or improving the best found solution.
The computational time aspect of the proposed algorithm need to be further improved. The details of the algorithm and programming implementation need to be studied further, since some problem instances, i.e. VRPTW-C2xx instances, still required long computational time. The main objective of this further study would be improving the algorithm and programming implementation in order to reduce the computational time without reducing solution quality.
Some further research for applying the proposed method to other VRP variants or type of problem is promising. Since the variants of VRP differ from one another only on the specific problem constraints, the only adjustment needed is at the constraint feasibility checking on the decoding method. However, the effectiveness of this idea should be further assessed.
REFERENCES
1. Ai, T.J. and Kachitvichyanukul, V. (2007). A Particle Swarm Optimization for the Capacitated Vehicle Routing Problem. Proceedings of the 3rd International Congress on Logistics and SCM System, pp. 205-212.
2. Chen, A.L., Yang, G.K., and Wu, Z.M. (2006). Hybrid Discrete Particle Swarm Optimization Algorithm for
Capacitated Vehicle Routing Problem. Journal of Zhejiang University SCIENCE A, 7: 607-614.
3. Christofides, N., Mingozzi, A., and Toth, P. (1979). The vehicle routing problem. In Combinatorial Optimization (Eds.: Christofides, N., Mingozzi, A., Toth, P., and Sandi, C.), John Wiley & Sons, Chicester, pp. 315-338.
4. Clerc, M. (2006). Particle Swarm Optimization. ISTE, London.
5. Kennedy, J. and Eberhart, R. (1995). Particle swarm optimization. Proceedings of IEEE International Conference on Neural Networks, Vol. 4, pp. 1942-1948.
6. Kennedy, J. and Eberhart, R.C. (2001). Swarm Intelligence. Morgan Kaufmann Publishers, San Francisco.
7. Pongchairerks, P. and Kachitvichyanukul, V. (2005). A non-homogenous particle swarm optimization with multiple social structures. Proceedings of International Conference on Simulation and Modeling 2005, Paper A5-02.