JURNAL ILMU·ILMU PERAIRAN DAN PERIKANAN INDONESIA
Terbit dua kali setahun pada bulan Juni dan Desember. Berisi tulisan yang diangkat dari hasil ; penelitian dan kajian analitiskritis dalam ilmuilmu perairan dan perikanan. ISSN 08543194.
Ketua Penyunting Mennofatria Boer
Penyunting Pelaksana Kadarwan Soewardi
Kiagus Abdul Aziz Ridwan Affandi
Penelaah (Mitra Bestari) Akhmad Fakhrudin
Ario Damar Dadi Rochnadi Sukarsa
Etty Riani Hefni Effendi Joko Santoso Kiagus Abdul Aziz
Luki Adrianto Majariana M. Mukhlis Kamal
Nikcn T. M. Sri Lestari Angka
Yusli Wardiatno Zairion
Pelaksana Rahmat Kumia Wahju Widijati
Ari Maria
Alamat Penyunting dan Tata Usaha: Departemen Manajemen Sumberdaya Pcrairan, Fakultas Perikanan dan I1mu Kelautan, Institut Pertanian Bogor J1. Lingkar Akademik, Kampus IPB Darmaga, Bogor 16680, Wing C, Lantai 4 Telepon (0251) 622912, Fax. (0251) 622932. E-mail: [email protected]
JUR:"IlAL ILMU-ILMU PERAlRAN DA:'Il perikセnan@ INDONESIA diterbitkan sejak Juni 1993 oleh Departemen Manajemen Sumberdaya Perairan, Fakultas Perikanan dan I1mu Kelautan, Institut Pertanian Bogor.
Penyunting menerima sumbangan tulisan yang belum pemah diterbitkan dalam media lain. Naskah diketik di atas kertas HVS A4 spasi ganda sepanjang lebih kurang 10 halaman, dengan format seperti tercantum pada halaman kulit dalambelakang (Persyaratan Naskah untuk JIPPl). Naskah yang masuk dievaluasi dan disunting untuk keseragaman fonnat, istilah, dan tata cara lainnya.
•
ISSN 0854--3194
JURNAL ILMU·ILMU PERAIRAN DAN PERIKANAN INDONESIA
Juni 2006, Jilid 13, Nomor 1
Halaman 1 - 82
Amir, F. Pendugaan Pertumbuhan, Kematian dan Hasil per Rekrut lkan Nila (Oreochromi.f ni/oticus) di Waduk Bilibili. (Estimation of Growth, Mortality and Yield per Recruit of
Oreochromis ni/olicus in Bilibili Reservoir) ... . 15 Prasetiamartati, 8.. A. Fauzi, R. Dahuri, A. Fakhrudin, dan H. Lange. Modal Sosial dalam
Pengelolaan Sumberdaya Perikanan. (Social Capital Contribution in Fishery Management) .. 719 Mustahal, Manijo, dan C. Kirana. Pengujian Penyakit Koi Herpes Virus (KHV) pada Beberapa
lkan Budidaya. (The Examination of the KHV (Koi Herpes Virus) Disease on Several
Cultured Fish Spccies) ... . 2126 Makmur, S. dan D. Prasetyo. Kebiasaan Makan, Tingkat Kematangan Gonad dan Fekunditas
Ikan Haruan (Channa striata Bloch) di Suaka Perikanan Sungai Sambujur DAS Barito Kalimantan Selatan. Reasearch or Food Habit and Spawning Season of Snake head Fish (Channa striata Bloch) in Fisheries Reserve Sungai Sambujur, Kabupaten Hulu Sungai Utara,
Kalimantan Selatan ... . 2731 Adam, I. Jaya dan M. F. A. Sondita. Model Bioekonomi Perairan Pantai (In-Shore) dan Lepas
Pantai (O//-..f)hore) untuk Pengelolaan Perikanan Rajungan (Portunus pe/agicus) di Perairan Selat Makassar. (Ill-shore and OfFshore Bioeconoll1ic Model lor Swimming Crab
Fisheries Management in Makassar Strait) ... . 3343 Utomo, B. S. B. dan N. Satri, ana. Sifat FisikoKimia AgarAgar dari Rumput Laut Graci/aria
chilensis yang Diekstrak dengan Jumlah Air Berbeda. (The PhysicoChemical
Charactcristics of Agar from Graci/aria chi/.msis Extracted Using Different Water Quantity) .... 4550 Syafei, L. S., R. Affandi, M. S. Saeni, K. Praptokardiyo, dan B. Kiranadi. Pengaruh Beban Kerja
Osmotik Terhadap Perkembangan dan Kelangsungan Hidup Larva Udang Galah Macrobracllium rosenbergii de Man. (Effect or Osmotic Regulation on Larvae Development
and Survival of Giant Prawn, Macrobrachium rosenbergii de Man) ... . 5158 Susilo, S. B. dan D. S. Sjarei. Water Quality for Aquatic Life in Cimanuk River, West Java.
(Kualitas Air Bagi Kehidupan Organisme Perairan di Sungai Cimanuk, Jawa Barat) ... .. 5967 Soewardi, K. dan Suwarso. Variasi Geografik dalam Struktur Genetik Populasi lkan Kakap
Merah, Lutjanus malabaricus (Lutjanidae) dan Interaksi Lingkungan di Laut Jawa. (Geographic Variation in Population Genetic Structure of Red Snapper, Lutjanatus
ma/abaricus (Lutjanidae) and Environmcnlallntcraction in Java Sea) ... .. 6975 Toha, A. H. A. Ulasan llmiah: Manfaat Bulu Babi (Echinoidea), dari Sumber Pangan sampai
Organisme Hias. (Function of Sea Urchin (Echinoidea), rrom Food to Decoration Animal) ... 77-82
WATER QUALITY FOR AQUATIC LIFE
IN CIMANUK RIVER, WEST JAVA
(Kualitas Air Bagi Kehidupan Organisme Perairan di Sungai Cimanuk, Jawa Barat)
Setyo Budi Susilo
1dan Djadja S. Sjafee
ABSTRACT
A survey on \\ater quality was conducted in Cimanuk river in 1999/2000 representing the upstream down to estuary region. Twelve sampling stations were chosen along the river. At each station. we sampled three times. in August. Octo her. and January. to represent three different seasons of the year. Some parame-ters \vere measured in sitll. while the other were analyzed at laboratory in Bogor Agricultural lJniversity.
["he results of this study indicated that. in general. water quality in Cimanuk river is still suitable (Dr aquatic I ife. This condition is reflected hy water quality indices. which arc in the range of 50 to SO or from moderate to good. Cimanuk river is typical of tropical flood river. in which the discharge fluctuate according to the rainfall. The rain water flushing on surface land in the early wet season decreases sharply the water quality of the river. Therefore. although the water quality of the river is still good f'or aquatic organisms. there is poten-tial pollution from its watershed. especially in early rainy season.
Key words: water quality. Cimanuk river. seasonal.
ABSTRAK
Sehuah survci kualitas air dilakukan di Sungai Cimanuk pada tahun I 99920()0 mulai dari hulu sungai hingga ke daerah estuari. Dua helas stasiun pengamhilan contoh ditctapkan di sepanjang aliran sungai. Pada setiap stasi un. pengamhilan contoh dilakukan tiga kali waktu pengamhilan. yaitu pada hulan Agustus. Okto-her. dan Januari untuk dapat mewakili tiga musim yang berheda pada periode tahun terse hut. l1eherapa para-meter diukur in situ. sementara heherapa yang lainnya dianalisis di laboratorium di Institut Penanian Bogor. Ilasil studi ini menunjukkan hahwa secara umum kualitas air di Sungai Cimanuk masih sesuai hagi peruntuk-an kehidupperuntuk-an organisme perairan. Kondisi terse hut tercermin pada indek kualitas airnya )ang herada pad a se-lang 50 hingga SO atau dari kategori sedang ke haik. Sungai Cimanuk adalah satah satu contoh khas sungai tropis. dilllana volume aliran sungai bertluktuasi menurut hesamya curah hujan. Air hujan menggelontor per-llluJ..aan tanah pada a\\al musim hujan yang herakihat menurunkan secara tajam kualitas air sungai. Oleh ka-rena itu walaupun kualitas air sungai masih baik bagi kehidupan organisme perairan. terdapat potensi pence-maran dari daerah aliran sungai tersebut. terutama pada awal musim hujan.
Kata kunci: kualitas air. Sungai Cimanuk. musiman.
INTRODUCTION
life that has been recognized for centuries,relatively few studies have been carried out on the broad aspects of river characteristics. Com-River basin or river system closely
relat-pared with lakes, rivers have for some time l:d to human development activities. The
an-been neglected, partly because limnologists pre-cient civilizations usually were associated with
fer to study relatively closed systems (Bayley, a river system. The reason is that the river
1979). The concept of sustainable develop-makes a human being easy to access the
neces-ment, introduced in 1992 by UNCED (United sities of lifereliable sources of food and water
Nations Conference on Environment and Deve-(Awachie, 1981). Fisheries, drinking water,
lopment) for the world's resource use (Cicin-and transportation may be the first tripleuse of
Sain and Knecht, 1998), has not been seriously rivers. Now. as human activities and the needs
applied on river basin management in Indone-of life increase, a river is used multiply.
De-sia. The failure contributed to the Jakarta mas-spite the vital role of river system for human
sive flooding in the beginning of 2002 and as-tonished the government, experts, and even the
Departemen IImu dan Tcknologi Kclalltan. Fakultas Pcrikanan people of the whole nation. dan IImu Kelautan. Institut Pertanian Bogor. Bogor
Cimanuk is one of the six major rivers in
Departemen Manaiemen Sumherdaya Perairan. Fakultas Peri-
kanan dan IImu Kelautan. Institut Pertanian Bogor. Bogor. West Java. (the others are
·
.60 Jumaillmu-ilmu I'eru/ran dan Perikanan Indonesia. Juni 20{j6. Ji/id 13. .\'omor I: 59-67
sadane, Cimandiri. and Citandui), flowing from hilly area of Gamt. the Cikurai mountain. pass-ing through Sumedang and Majalengka areas and ended in the coastal area of Indramayu (the Java Sea). The length of this river is
approxi-mately 175 km with the width varies from about
6 fII upstream to about 150 III downstream.
Wa-ter quality study in this river is very limited. The last spatially extensive study on water qual-ity in this river was in 1979 done by a team of PliSDI-PSL-IPA (1979). The river is used mainly for irrigation purposes while traditionally it is for fishing. washing. bathing. and waste discharg-ing activities as well. Since fisheries and wild life are not the priority in this river system, decisions to maintain a healthy quality of the ri-ver's biological life depends on compromising with the users outside to the tisheries and wild
life afTairs. This ottcn retards regular water
quality monitoring and evaluation
or
the riversystem.
With the increasing understanding of the importance of the sustainable development con-(,;cpt all users ultimately have to be more
COI1-(';ern with the river's water quality. l10t only to maintain the health ot' biological life ill the river but also to indicate sListainability of the deve-lopment in the basin. The assemblage of cha-racteristics of a river summarizes the geology, geography. and development in its basin. All activities taking place on earth are eventually reflectcd in thc rivcr \valcrs (Welcommc and
Henderson. 11)76). Ih is study is intended to
figure out some watcr qua I ity characteristics in Cimanuk river and cvaluate the environmental condition based on that. Water quality parame-ters measured in this study is limited to para-meters related to organic pollution since that matter is the dominant form of water pollution in the area. This study does not include mea-surements on heavy metal concentrations due to shortage of fund available. However, source of heavy metals as pollutant in the river basin seems to be still very limited. Hopely, this pa-per will be taken as a consideration for the Ci-manuk river management toward sustainable management of the river use.
MATERIALS AND METHODS
The study was conducted from June 1999 to January 2000 in Cimanuk river, including its major tributary. Cipeles river or "Sungai
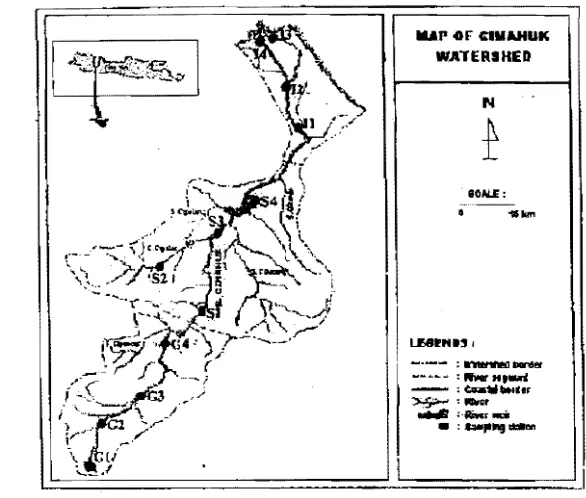
Cipe-les". In this study. the river basin was divided into three segments from upstream toward down-stream, whieh were Garut segment, Sumedang segment. and Indramayu segment. Every seg-ment of the river had four measureseg-ment stations where nearby stations had approximately the same distances. The stations v... ere named re-fering to the initial segment names, which were GI, G2, G3, G4, SI, S2, S3, S4, [I, 12, 13, and 14. Station S2 was in the tributary and the I' stations located downstream of Rentang weir. Therefore, water quality characteristics of the I' stations may not relate directly with its upper stations. Figure I shows the locations of the stations along the river.
Some important water quality parameters were measured at the stations in three different months expected to reflect cond ition in three different seasons. Measurements were done in August 1991) to rellect the condition of dry sea-son, in October 1999 as a representation of tran-sition season (early wet season), and in January 2000 as a representation of wet or rainy season.
Water quality parameters measured; and will be discussed in this paper: were water Ilow, river depth, turbidity. temperature. pH (acidity), alkalinity. dissolved oxygen (DO), five-day bio-chemical oxygen demand (BOD,), ammonia, and orthophosphate. Somc of the parameters were measurcd in the field and the others were analyzed at the "Laboratorium Produktivitas dan l.ingkungan Perairan (ProLingr, Faculty of Fisheries and Marine Sciences. Aogor
Agricul-tural University. Measurements and analyses
were based on standard methods on freshwater quality analyses.
This paper \vill discuss the water quality condition of the river based on water quality standard for fisheries or aquatic lite. Addition-ally. the overall water quality will also be ana-lyzed using the water quality index (WQI) de-veloped by Ott (1978). The index of each sta-tion is calculated with the formula of:
!-i
61
Susi/a, S. B. and D. S .sjatei, Water Qua/ill'F)r Aquatic in Cimal1uk Rh:er. West Java
100. The weigths are as follows: 0.25 for BOD and orthophosphate. 0.05 for pH and
tempera-and ammonia. 0.20 for DO. 0.10 for turbidity ture,
lUI' .oF CIII....UK WATERIRED
N
IO/ol.R:
.
..
...I..f,8'NI'.
- . - - : ntInIIOII...,..
キ⦅セセ⦅@
'''-H,''
- :e...nI...
セGGGGGG
...
.
,._'
....
:-..
...
-Figure L Cimanuk River Basin and Sampling Stations.
The WQI of each station will have value ranging from 0 to 100. The value will deter-mines the water quality level according to the following criteria: 0 - 25 as very bad. 26 - 50 as
bad, 51 - 70 as moderate, 71 90 as good, and
91 - 100 as very good
RESULTS AND DISCUSSION
Water quality characteristics in Cil11anuk river measured in 1999 - :2000 are presented on Table 1. According to Welcomme ( 1979), rivers may be classified into two types. reservoir and flood rivers. Reservoir rivers have a stable flow throughout the year while flood rivers have
large seasonal variations in the flow.
Consi-dering the above categories, Cimanuk river be-longs to the flood river or the rainfall river. This can be characterized by seasonal flow (Fi-gure 2) and seasonal depth of the river (Fi(Fi-gure 3). On Iy few natural springs are found in the watershed so that the flow depends mostly on rainfall spill. In dry season (August), the flows
are less than 20 m3!s for all stations. [n early
rainy season (transition season, October), the flows begin to increase before achieving the peak in January. Similar flow characteristics were recorded in Solo river (DGWRD. 1983).
Hickling (1961) said that in general, tropical rivers undergo great seasonal variations in level.
Water Debit Variation
- "::
---セ@ lセ@
e
.0
"
セ@;;;-セ@ 4:
---ッBcセセセセセ@
S?
sエNAエゥッセ@
Figure 2. Flow Characteristics ofCimanuk River
Figure 2 also tries to show spatial variat-ion of flow from upper reach down to lower reach of the river, and therefore, station S2 is excluded from analysis since this station
locat-ed in a tributary. Station I. I, 12, 13, and 14 are
also excluded because there is a weir just be-low station S4 so that the fbe-low at the I' stations have no longer represented natural flows. A river dam v iolates the river continuum concept
as described by Vannote el
al.
(1980). In [image:6.611.195.488.124.373.2] [image:6.611.368.573.460.576.2]62 JI/rnal Jlmll-ilmll Perairan dan Perikanan Indont'sia . .Julli 2()O6. Ji/id 13. Xomor I. 59-67
downstream. except in dry season, which is fair- downriver has also shown on the depth
charac-ly constant. The increasing flow transmitted teristics (Figure 3).
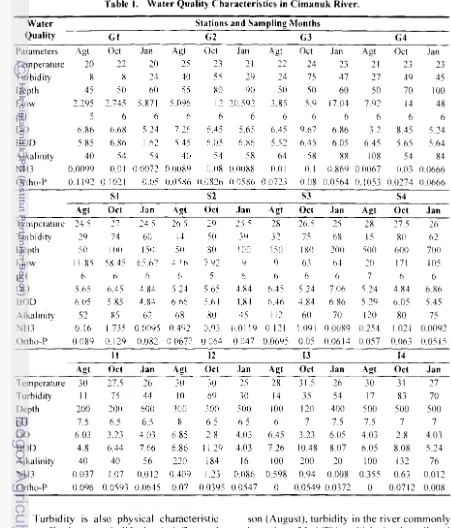
Table I. Water Quality Characteristics in Cimanuk River.
Water Stations and Sampling Months
Quality GI G2 G3 G4
Parameters Agt Oct Jan Agt Oct Jan Agt Oct Jan Agt Oct Jan
Temperature 20 22 20 25 21
22
24 21 23Turbidity 8 8 24 40 55 29 24 75 47 27 49 45
Depth 45 50 60 55 80 90 50 50 60 50 70 100
Flow 2.295 2.745 5.871 5.096 12 20.592 3.85 5.9 17.04 7.92 14 48
pI! 5 6 6 6 6 6 6 6 6 6 6 6
DO
6.86 6.68 5.24 7.26 6.45 5.65 6.45 9.67 6.86 3,2 8.45 5.24BOD
'i.85 6.86 1.62 5.45 6.05 6.86 5.52 6.45 6.05 6.45 5.65 5.64Alkalinity 40 54 54 40 54 58 64 58 88 108 54 84
NH3 0.0099 0.0 I 0.0072 0.0089 0.08 0.0088 0.0 I 0.1 0.869 0.0067 0.03 0.0666
Ortho-I> 0.1192 0.1021 0.05 0.0586 0.0826 0.0586 0.0723 (1.08 0.0564 0.1053 0.0274 0.0666
SI S2 S3 S4
Agt Oct Jan Agt Oct .Jan Agt Oct Jan Agt Oct Jan
Temperature 24.5 27 24.5 26.5 29 25.5 28 26.5 25 28 27.5 26
Turbidity 2<1 74 60 14 50 3<1 32 75 68 15 80 62
Depth 50 100 150 50 80 100 150 180 200 500 60() 700
Flow 11.85 58.45 65.62 4.16 7.<12 9 <I 63 64 20 171 105
pH 6 6 6 6 5 6 6 6 (i 7 6 6
DO
5.65 6.45 4.84 5.24 5.65 4.84 6.45 5.24 706 5.24 4.84 6.86BOD
6.05 5.85 4.84 6.66 5.64 4.84 6.46 4.84 6.86 5.29 6.05 5.45Alkalinity 52 85 62 68 80 45 I 12 60 70 120 80 75
NH3 0.16 1.735 0.0095 0.492 0.93 0.0119 0.121 1.091 0.0089 0.254 102/ 0.0092
Ortho-P 0.089 0.129 0.082 0.0672 0.064 0,047 0.06<15 0.05 0.0614 0.057 0.063 0.0515
It 12 13 14
Oct .Jan Oct Jan Oct Jan Oct Jan
Tem perature 30 27.5 26 30 30 25 28 31.5 26 30 31 27
Turbidity J I 75 44 10 69 30 14 35 54 17 83 70
Depth 200 200 600 300 300 500 100 120 400 500 500 500
pH 7.5 6.5 6,5 8 6.5 6.5 6 7 7.5 7.5 7 7
DO
6.03 3.23 4.03 6.85 2.8 4.03 6.45 3.23 6.05 4,03 2.8 403BOD
4.8 6.44 7.66 6.86 11.29 4.03 n.6 10.48 8.07 6.05 8.08 5.24Alkalinity 40 40 56 220 184 16 100 200 20 100 132 76
NH3 0.037 1.07 0.012 0.409 1.23 0.086 0.598 0.94 0.008 0.355 0.63 0.012
Ortho-P 0.096 0.0593 0.0645 0.07 0.0395 0.0547 0 0.0549 0.0372 0 0,0712 0.008
Turbidity is also physical characteristic of river affecting aquatic life that is influenced by rainfall in the basin. Effendi (2000) noted that an increase of turbidity by 5 NTU may
re-duce primary productivity of 3 - 13 %.
Turbi-dity restricts light penetration and limits photo-synthesis although it may not be harmful to fish (Boyd, 1979). Turbidity variations in Cimanuk river may be inspected on Figure 4. In dry
[image:7.611.89.540.130.658.2]63
SlIslio. S. B. ulld D. S. Sla(ei. II'mer QlIollfr/()r Aquafic Lite in Cimanl/Ii Rh·er. tlesl.lura
to the river, turbidity achieves the highest. In the middle of rainy season (January), the land in the basin is relatively cleaner than in the begin-ing of rainy season (October) and the solid material content in the runoff water is lower. Turbidity in rainy season surpass its allowable upper limit for fisheries. This temporal variat-ion of turbidity is observable on Figure 4.
[image:8.611.91.304.123.751.2]Depth Vaflat.ofl
Figure 3. Water I}epth in Cimanuk River.
Turbidity Vanation
;;.0
- A g I
EO
- D c :
S" 70
J a n
g
eC:E? EJJ
:lI
D 3IJ
セ@ 20
10
5 8 8
セ@ セ@ セ@ セ@m
セ@ セ@ セ@ SStation
Figure 4. Turbidity cィ。イ。」エ・イゥウエゥ」セ@ of Cimanuk River.
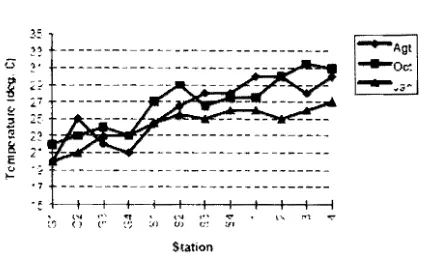
Water temperature in tropical region usu-ally is not a problem for organisms. Huet (1971 ) noted that aquatic organisms live well in 20
-lOne of water: and according to Ilari)adi I.!I al.
(1992). fish will grow optimally at temperature of about 2TC. Figure 5 shows the temperature variation along the river in three different sea-sons. I n general, temperature in C imanuk river varies from 20nC to 30°('. except for station 13 in October. which is 31"C. It means that tempe-rature in the river in all seasons is in allowable range. Temperature difference among seasons is not prominent although in January the tempe-rature seems to be the lowest (Figure 5). Tem-perature exhibits a tendency to decrease dO\·vn-river and may correlates with altitude of the ri-ver base. Goldman and Horne (1983) conclude
cd that substrate composition. ground water temperature. rain temperature. and air tempera-ture influence the surface water temperature. Temperature Vanatlon 2: ?? G ? セ[M
セ@
27 セ@ ::0 Rセ@セ@ <-
"'
セ@ 2'
E ,...
"
• '7
-., I I
, セセ@ Nセセ@ セ@ • セBLi@ " . "'::!'
セGI@ ( ) (P :'; :I) U) U, UI
[image:8.611.332.544.144.279.2]Station
Figure 5. Temperature Variation in Cimanuk River.
Acidity and alkalinity are two water qual-ity parameters important for fish. Acidand alkalinity are two water qual-ity mea-sures concentration of hydrogen ions in water and represented by pH. while alkalinity mea-sures concentration of bases in water and ex-pressed as mgliler equivalent calcium carbon-ate (CaCOll. The two parameters relcarbon-ate each other closely. Acid and alkaline water will be indicated by low value and high value of pH respectively. The acid and alkaline death points for fish are approximately pH 4 and pH II (Boyd, 1979). This author also mentioned that suitable pH for fish production is from about 6.5 to 9. Pescnd (1973) suggested that ideal pH for fish-eries is 6.5 8.S. The allowable pH for fisher-ies according to Indonesian Ministry Decree Number Kep02i MenKLHi1/1988 is 6 9. The
suitable alkalinity for fisheries is 30 500 mg/ liler. Acidity or alkalinity, along with tempera-ture, may be used to estimate ichthyomass of a river (lIokik. 1(79).
64 ./urnal IImu-ilmll Perairall dan Perikanan Indonesia. JUIlI 20(}6. Jilid 13. Somor /. 59-67
pH Vanallon
() t:; ;" Vl fA if, •
MセNァャ@
- 0 : :
...Jan
:I:
Co
[image:9.612.44.298.66.725.2]Station
Figure 6. Acidity Characteristics of Cimanuk River.
The alkalinity of the river commonly is also in the range of suitability for fisheries, except at station 12 and 13 in January (Figure 7). Exceptional fluctuation on pH and alkalinity at I' stations needs more detail data on land use to
explain, which is not available right now.
Wa-ter quality characteristics at those stations may not connect directly with their upper stations since a weir exists just above station II.
Alkaiil1'ty VanatlOn
セ@
[image:9.612.320.533.92.211.2]::i
e:
...-:
..."''''-N _ . " _ . ' セ@ セ@ セ@
セ@セ@ t j t': t I; :fl OJ 11: Zエセ@
Station
Figure 7. Alkalinity in Cimanuk River.
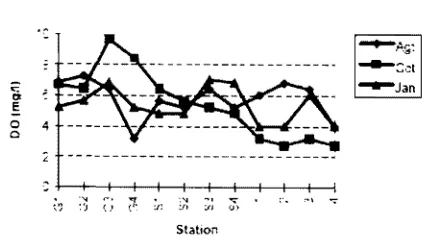
Dissolve oxygen (DO) in the water is vi-tal for aquatic organisms for respiration. How-ever, the DO in river usually is not a limiting factor since a lot of oxygen may be injected from air in flowing water. Huet (1971) men-tioned that minimum physiological activity of fish needs no less than 3 mg/liler of DO, and for normal growth, fish needs more than 5 mg/liler
of DO in the water. Based on various sources of information. Indonesian Ministry Decree Num-ber Kep02/MenKUI/\i1988 uses 4 mglliler as the lower limit DO of fisheries water quality standard. DO variation in Cimanuk river may be inspected on Figure 8. Although some va-lues of DO on Figure 8 are bellow 3 mg/liler. it should be realized that DO may change quickly.
DO Variation
...Ar .. , LセN@
::.::t
...Jan
ij
E
o
o
Station
Figure 8. DO (Ilissolved Oxygen) Variation in G-manuk River.
Biochemical oxygen demand (BOD) is a measure of organic matter in the water. The BOD measures the strength of waste discharges and therefore is widely used as an organic
pol-lution indicator in bodies of water (Ortolano, 1984). High BOD levels have been frequently reported in urbanized river basins due to direct effluent discharge from industrial premises and sewage effluent from domestic homes. while na-tural rivers in general maintain low BOD levels (Lai, 1983). According to Effendi (2000), natu-ral waters have 0.5 7.0 mg/liter BOD and wa-ters with BOD level more than I () mg/liler can be considered as polluted waters. Lai (1983) classified river water qual ity in Selangor,
Ma-laysia, with respect to BOD concentration as very clean
«
1 mglliter), clean (2 mg/liJer). fair-ly clean (3 mg/lifer). doubtful (5 I1Iw'liler) and bad (> 10 mg/liler). Higher level of minimum water quality standard for fisheries based on BOD concentration has been used by Indone-sian Ministry Decree Number Kep02/MenKLHI 111988. which is 45 nlj!,/Iiler.In general, the difterence of BOD level either along the Cimanuk river or among the seasons is not sharp (Figure 9). Again, an ex-ception occurs at station G I and the I' stations. Low BOD level at G 1 in August is obviously because the cleanly spring water not contami-nated yet by waste effluent from its surrounding basin. Higher BOD levels at station 12, 13. and 14 in October are due to land flushing of the early rainfall. All BOD values on Figure 9, however. are less that 12 mglliler and mostly bellow I () mg/liler. These data ind icate that the river is not polluted badly yet.
Am-65
3
.!
C
1
Susilo. S B. and /J. S. ,)Jaf!!i. Water Quality (or Aquatic Li/e in Cinwnuk River. West Java
monia mostly comes from deaminated process
of organic matter. Ammonia is always in
equi-librium with ammonium ion HnhTセIN@ Ammonia is toxic to fish but ammonium ion is not (Boyd, 1979). Effendi (2000) noted that natural water usually contains less than 0.1 mg/liter of ammo-nia. Higher level of ammonia indicates organic pollution of the water. Pescod (1973) suggest-ed that ammonia concentration should be less than I
m:.;//iler
in order to be suitable for fish-eries. The same value has been adopted by In-donesian Ministry Decree Number Kep02/Men KLH/I/1988. [image:10.611.99.313.82.782.2] [image:10.611.95.310.160.447.2] [image:10.611.98.311.551.762.2]BOD Variation
...セLァセ@
: : t
J a n
r.
'"
E o o co 4 StationFigure 9. BOD (Biochemical Oxygen Demand) in Cimanuk River.
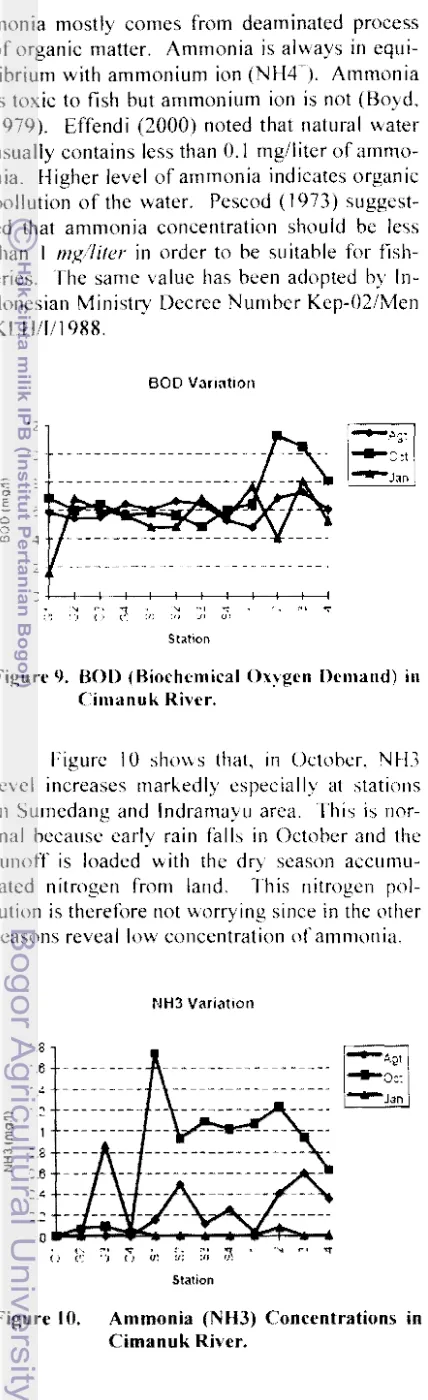
Figure 10 sh(ms that, in October, NH3 level increases markedly especially at stations in Sumedang and Indramayu area. This is nor-mal because early rain falls in October and the runoff is loaded with the dry season accumu-lated nitrogen from land. This nitrogen pol-lution is therefore not worrying since in the other seasons reveal low concentration of ammonia.
NH3 Variation
MセNァャ@
..6
0 : :
J a n
'"
セ@'"
M :.3 J: z :.6 :.4 StalionFigure 10. Ammonia (NH3) Concentrations in Cimanuk River.
Phosphorus (P) is a key metabolic nu-trient and the supply of this element often regu-lates the productivity of natural waters. Al-though phosphorus is a minor constituent of water, its biological importance is considerable, and it is usually considered to be the element that most frequently limits productivity in aqua-tic ecosystem (Boyd, 1979). Hariyadi el al.
(1992) and Boyd (1979) explained that phos-phorus occurs in water as soluble inorganic form (orthoP). particulate inorganic form, and organic forms (polyP). Plant only assimilates the soluble orthoP. Boyd (1979) also men-tioned that concentrations of orthoP in water are quite low, and seldom exceed 0.1 mg/liter even in high Iy eutroph ic waters. Wetzel (1983) categorizes fertility of water based on ortho-phosphate concentrations as follows: olygotro-phic for 0.003 0.0 I mg/liter of orthoP. meso-trophic for 0.0 II 0.03 mg/liter of orthoP. and eutrophic for 0.03 0.1 mg/liter of orthoP. It
should be noted. however. most phosphorus in-put entering the stream during high discharge may be flushed Ollt without entering biogeoche-mical cycles of the ecosystem (Meyer and Li-kens. 1979).
Soluble orthophosphate (orthoP) in Ci-manuk river can be seen on Figure I I. The
fi-gure shows that in general Cimanuk river may be classified as a eutrophic water. Variation of orthoP in this river either among stations or a-mong seasons cannot be explained easily but excessive amount of orthoP at some stations may indicate the use of phosphorus fertilizer in nearby agricultural land. Nevertheless. orthoP has never been toxic to fish.
OrthoP Var'abon
I...
AgtGZLQセ@
i O c :
セ@ :.1
-.ii'
E:.08-...
セ@ :06 T..:;..;...ゥABG|セエ@
o
セPT@('I ,01 't:"" •
() () .,) :') :.t;
5:a::o"
Figure II. Orthophosphate (orthoP) in Cima-nuk river.
.lUl'lla/ IImu-i/I1I/i I'emiran Jail I'eri!wlloll IIIJolleShI . .lUll! 2006 .li/id 13..\on/or I: 59-67
on Figure 12. I n general. the Indices are more
than 50 indicating that the water quality is
mo-derate to good. A Ithough this may be consider-ed as a good news. potential pollution due to degrading watershed and domestic effluent should be alerted. Moderate pollution occurs in early rainy season when the rain water carries considerable pollutant from land. The cleans-ing process gradually vveakens in rainy season because of fewer materials remaining.
Water Quality Indices
ICC
',:.c
Miセ
2C
セMMMー、ャMM
MMセMMMセMMMMセMM
MMセM
MセセZZZ[[セセMセMMM
i[Zセセ
:;::::;:-7C tC
.
'C <c :?c JC Ie Stationfigure 12. Water Quality Indices in Cimanuk River.
Ihe use \\ater quality indices to to ligurc out some water quality characteristics in Cima-nuk river has the advantage mainly in term of easiness for interpretation. The water quality in-dices presented in this paper, however. are not complete indinces to measure water quality of the Cimanuk river sinces not all water quality parameter are included in the analyses. Para-meters analYL.ed in this study mainly arc limited to things that related to organic pollution. Fur-thermore. analysis water quality is focused on aquatic I ife needs.
Without f()rgetting the weakness of the study. the result or this study may be llsed as an early \\arning indicator for pollution poten-tial of the river. Some parameters indicate pol-lution potential in the ri\er in early rainy sea-son. The potential will build up greater and greater and po Ilute the water e\ en in dry season if management on the \\atershed fails. There arc variolls methods and models that can be used to manage the watershed in relation to the water quality ofa river. Mattikalli et al. (1996).
for example. propose the soil conservation ser-vice and the export coefficient models integrat-ed with GIS (Geographical Information
Sys-tem) to predict river discharge and water
qua-lity.
ACKNOWLEDGMENT
fhis study \Va'> a part of the research en-title "Sustainable Management and Conservat-ion Based on Ichthyofauna Diversity in Cima-nuk River Basin", which financially supported by SEAMEOB10TROP Bogor, 1999/2000.
The authors gratefully acknowledge Dr. M. F. Rahardjo. Dr. Wirjoatlllodjo and Mr. M. Akur Arifin f()f their support during the field work.
REFERENCES
Awachie. J. B. I·'. 19XI. Some general considerations on river basins in Africa and their management and development in relation to fisheries. III Kapdsky. 1. M. (cd.) Seminar on river basin management and development. l:,\()(IFA I eeh l'apJDoe. le;;h. (,PCA. (X) 2 -D.
Ba:k:. 1'. It 197') The limits of limnological theory and IIlll)roaches as applied to riverOoodiliain sys-tems and their fish IJroduction. III Wckoll1!llc. R. I ..
fcd.). I'ishen managcmcnt in large ri\ ers. FA() Fish-eric.s I cd!. Pap.. ( I').l): 2326
Bn.\(t. C. I .. 1')79 Water qualit.\: in warm water fish ponds ;\uhurn l'ni\crsity. Agricultural !:\pc:rill1cnt Stat ion. .'\ u hum .. \ lahallla.
CicinSaln. II. and R. \\. h:necht. IlJlJX. Integrated COllst-al and ocean management: Conc:cpts and practices. Island Pr.:". \\a,hington. IH·.
D( i WI{ [) (Dlrcctorate: (,cncral or Water r・セッオイ」・ウ@ Dnc-lopment). 198). Lower Solo river project. Appendix (i: Fisherks and aquati;; el1\ imnment. Ministry 01 Public Works. Repuhlic of Indonesia. Jakarta.
Effcndi. I L :W()(). Teillah kualitas air bagi pengelolaan sumberdaya dan lingkungan perairan. Fakultas
1'L"r-ikanan dan /lIllU Kclautan. Irbtitlll I'crtanian llogor. Bogor.
(,oldman. C. R. and A. J. /lome. IlJX). Limnology. Mc(ira\\ Hill Btlok Company. 1\:cw York.
Ilari" adi. S .. I N. N. Suryadiputra. dan B. \\idigdo. 1992. Limnologi: Penuntun Jlraktikum dan metode anali-sa kualitlls air. lakullas Pcrih.anan. In,tilul Pcrtanian BogoL BOgllL
lIick ling. C. I·. 1%1. Tropical inland fisheries. John Wi!..:) & Snns. \iC\\ York.
Ilokik . .I. 1')7'). Assessment of fish stock and prediction of catch in large rivers. In Weicommc. R. I.. (ed.).
!'ishc!} managclllcnt in large ri\l:rs. FAO lishcrics Icch. Pap .. ( IlJl): RVMSNセ@
llue!. M. 1971. Textbook of fish culture: Breeding and cultivation of fish. [·"hing '\ews (Boob). Londol1.
I.ai. F. S. 1')8.1. Biochemical oxygen demand concen-tration of two river basins in Selangor. PCr1anlka. 6(3): .12--13.
surface wa-¥
I
Susi/o, S. B. and D. ,I;, 5ja/ei. Water QlIality/or Aquatic Life in Cimanuk River, iセG・ウエ@ Java 67
ter quality using an integrated geographical infor-mation system approach. InC.L Remote Sensing. 17 (4): 683-70 I.
Meyer. J. L. dan
n.
E. Likens. 1979, Transport and transformation of phosphorus in a forest stream ecosystem. Lcology. 60(6): 1255-1269,Ortolano. L. 1984. Environmental planning and deci-sion making, John Wilcy & Sons, Nc\\ York.
Ott. W. R. 1978. Environmental indices, Ann Arbor Science Publisher. Oxford.
Pcscod. M, D, 1973, Investigation of rational effluent and stream standard for tropical countries, AIT, Bangkok.
PUSDI-PSL-IPB. 1979. Studi penentuan kriteria kuali-tas lingkungan perairan dan biotik. Panitia Perumus dan Rencana Kerja Bagi Pemerintah di Ridang Pe-ngembangan Lingkungan lIidup, Jakarta.
Vannote. R. L G. W, Minshall. K, W. Cummins. 1. R. Sedcll. dan C. E. Cushing. 1980. The river conti-nuum concept. Can. 1. Fish. Aquae Sci., 37: nO-1)7.
Weleomme. R. I" 1979. Fisheries ecology of floodplain rivers. Longman. New York,
Welcomme, R. L. dan 1 L F. Henderson. 1976, Aspects of the management of inland waters for fisheries. FAO Fisheries Tech. Pap. No. 161. Rome.