STUDY OF REGIONAL TRANSPORTATION FOR
CPO IN CENTRAL KALIMANTAN
Conference Paper · November 2012
CITATIONS
0
READS
60
4 authors, including:
Some of the authors of this publication are also working on these related projects:
The development teaching materials on railways planning and engineeringView project
Noor Mahmudah
Universitas Muhammadiyah Yogyakarta
7PUBLICATIONS 6CITATIONS
SEE PROFILE
All in-text references underlined in blue are linked to publications on ResearchGate, letting you access and read them immediately.
STUDY OF REGIONAL TRANSPORTATION
FOR CPO IN CENTRAL KALIMANTAN
Abstract
This study is intended to provide an overview of regional transportation for Crude Palm Oil (CPO) by considering the characteristics of various transportation networks, modes, and service attributes. The result of study conducted in Central Kalimantan shows that the transportation attributes influencing the efficiency of transportation system are total travel time, cost, and distance. The analysis results of modelling CPO transportation by using geographic information system (GIS) indicate that inter-modal transportation of road and river networks produce the most efficient generalized cost. Therefore the provisions of adequate ports and access roads from CPO factory to the port are needed to support mobility of CPO in the regional scale.
Key Words: Crude Palm Oil (CPO), geographic information system (GIS), regional transportation
INTRODUCTION
The availability and performance of transport infrastructures are very important in supporting freight transportation. Therefore, the reliable transport infrastructures are needed to support industrial activities in certain region (Mahmudah et al, 2012). As noted by Lem (2002), there is a strong relationship between transportation and regional economic development. Firstly, the relationship between transport infrastructure and regional productivity implied that the improvements of transport infrastructure are very important aspects of economic development strategy to increase regional productivity. Secondly, transport infrastructure that adequately facilitates the goods movement of industries within the region can reduce the production costs. Finally, transport infrastructure affects the location of industries. It is implied that a development strategy involving attraction of new industries to a region must ensure that regional transportation infrastructure is adequate for the targeted industries. The access of industries to supply routes must be evaluated in accordance with existing transportation infrastructure and the potential location of factories and distribution.
Siti Malkhamah
Professor
Dept.of Civil and Environmental Engineering Faculty of Engineering
Universitas Gadjah Mada Jl. Grafika No. 2 Yogyakarta 55281 Tel: (0274) 524712; Fax: (0274) 524713
E-mail: [email protected]
Sigit Priyanto
Professor
Dept.of Civil and Environmental Engineering Faculty of Engineering
Universitas Gadjah Mada Jl. Grafika No. 2 Yogyakarta 55281 Tel: (0274) 524712; Fax: (0274) 524713
E-mail: [email protected]
Noor Mahmudah
Ph.D Candidate
Doctoral Programme in Civil Engineering Faculty of Engineering
Universitas Gadjah Mada Jl. Grafika No. 2 Yogyakarta 55281 Tel: (0274) 6497249; Fax: (0274) 631178
E-mail: [email protected]
Danang Parikesit
Professor
Dept.of Civil and Environmental Engineering Faculty of Engineering
Universitas Gadjah Mada Jl. Grafika No. 2 Yogyakarta 55281 Tel: (0274) 901075; Fax: (0274) 901075
Freight transportation plays an important role in the regional economic growth and development, which is mainly to ensuring the efficient movement and timely availability of goods (Kreutzberger et al, 2006). To formulate an effective strategy for regional transportation planning, the planners or policy makers need to know the location of resources, processing or factory locations, and the final ports to send their goods to the outside world. To do this, various characteristics of different commodities and the available transportation networks that can be used, need to be known. An understanding of how the relationships between commodities’ activities and transportation are linked by spatial structure is essential (Mahmudah et al, 2010; 2011).
The role of region in influencing the economic activities is now becoming more important. A variety of socio-economic studies and social change emphasize the importance of region and its role as the economic actor in the new pattern of spatial development (Rodriguez-Pose, 1998 in Kuncoro 2002). In general, the studies of regional or industry sector are disaggregated into province level (Aziz, 1994; Hill, 1989, Hill, 1996; Wibisono, Suryadi & Layer, 1992 in Kuncoro, 2002). This aggregation level is becoming easy to conduct and more attractive (Kuncoro, 2002).
The rapid growth of Crude Palm Oil (CPO) industries and the high investment of palm plantation in Central Kalimantan are some of considerations in selection of this province as study area (Mahmudah et al, 2010; 2011). Due to more than 80% of palm plantation area are locating in the eight regencies, so study area considered are Lamandau, Kotawaringin Barat, Seruyan, Kotawaringin Timur, Katingan, Gunung Mas, Pulang Pisau, and Kapuas Regencies. In general, this research attempts to study regional transportation for CPO by considering the characteristics of various transportation networks, modes, and service attributes, to produce an efficient freight movement to enhance sustainable mobility in the regional scale. However, this study is not considered the capacity constraints of each transportation networks.
METHOD
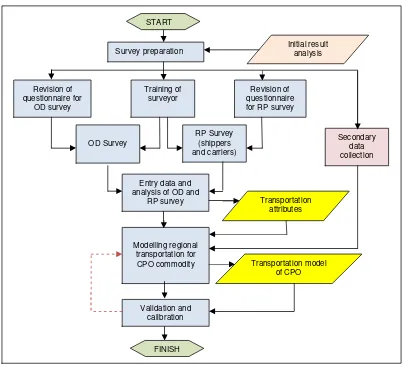
In general, the method used to conduct study of regional transportation for CPO in Central Kalimantan is as illustrated in Figure 1. The stages consist of: 1) survey preparation such as finalization of survey questionaires, training of surveyors, and secondary data collection; 2) conducting Origin-Destination (OD) survey and Revealed Preference (RP) survey to shippers (goods owners/consignees) and carriers (drivers/operators); 3) analyzing data obtained from the surveys (OD and RP) to determine significant transportation attributes; and 4) modelling regional transportation for CPO using ArcGIS 10 and Excel programs.
regencies. The drivers of tank-trucks going to Bumiharjo Port (Kotawaringin Barat) and Bagendang Port (Kotawaringin Timur) are stopped to be interviewed about the origin and destination od commodity, weight of commodity, travel distance, travel cost, total travel time, number, place and time of transit, and route selected for transporting CPO. Moreover, the surveyors have also recorded the type, capacity, wheel configuration, and weight of vehicle. During the survey, team of surveyor is accompanied and is assisted by the staffs of Transportation Office and Police Office. The total drivers interviewed are 290, which consist of 184 in Kotawaringin Barat Regency and 106 in Kotawaringin Timur Regency.
Figure 1. Flow chart of the research
Secondary data are collected from the official institutions in Central Kalimantan Province such as the Provincial Planning Agency (Bappeda Provinsi), Regency Planning Board (Bappeda Kabupaten), Transportation Office (Dinas Perhubungan), Provincial Plantation Office (Dinas Perkebunan Provinsi) as well as Port Authority (Pelindo III).
All of the primary data is then compiled and analysis by employing statistical analysis using Statistic Product Service Solution (SPSS). Both primary and secondary data are then used in GIS analysis to obtain the spatial and transportation model of CPO. The stages of modeling CPO transportation using ArcGIS 10 are as follows:
START
Survey preparation
Revision of questionnaire for
OD survey
Revision of questionnaire for RP survey Training of
surveyor
OD Survey
RP Survey (shippers and carriers)
Initial result analysis
Modelling regional transportation for CPO commodity
Secondary data collection
Validation and calibration
FINISH
Transportation model of CPO Entry data and
analysis of OD and
1. Data preparation by constructing/updating the GIS data (geo-database) using ArcGIS 10. The latest data (both primary and secondary data) obtained from the survey or literatures are formatted in the GIS. Data considered in building the model using ArcGIS 10 are palm plantation (name of firms, area, location, type, and status of permit), road networks and attributes, river networks and attributes, administrative map (regency, sub-district, and village, general and special ports (name, location, etc), and land use data.
2. Mapping the selected route of CPO transportation using GIS. Data obtained from RP surveys to the shippers and carriers and data collected using GPS (Global Positioning System), are then plotted and transfered to GIS format. The routings of CPO transportation from factory to the ports are visualized in image format.
3. Conducting simulation/mapping of spatial and transportation model for CPO by using tools of network analysis (that is available within ArcGIS 10). The direct output of this simulation are the location of CPO factory, the accessibility of CPO factory to the road networks and river networks, travel distance and travel time required for transporting CPO from certain factory (origin) to specific port (destination). The GIS data used in analysis are as shown in Table 1. By utilizing the travel distance and travel time obtained from network analysis (ArcGIS 10), the generalized cost can be then calculated using Excel software.
Table 1. GIS data used for modeling CPO transportation
No Data Format Year
1. Administrative map Geo-database 2011
2. Road network Geo-database 2011
3. River network Geo-database 2011
4. General port map Geo-database 2011
5. Special port map Geo-database 2011
6. Land use map Geo-database 2011
7. Palm plantation map Geo-database 2011
4. Displaying/ saving the output of modeling to image format (bitmap or jpg).
RESEARCH FINDINGS AND DISCUSSIONS
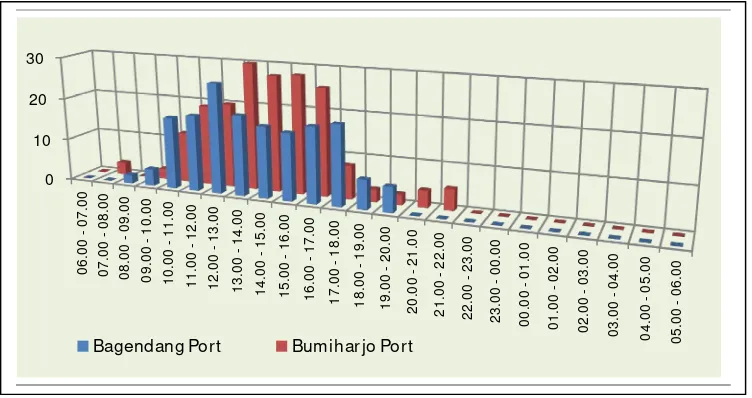
1. Origin-Destination (O-D) surveyFigure 2. Number of tank-trucks at general ports in Central Kalimantan
2. Revealed Preference (RP) survey to carriers and shippers
The RP survey directed to carriers were conducted in Kotawaringin Barat Regency (Bumiharjo port) and Kotawaringin Timur Regency (Bagendang port) in 2011. During the survey, researcher was assisted by surveyor team, staff of Transportation Office (Dinas Perhubungan) and Police Office (Satuan Lalulintas). The respondents (drivers) who have been successfully interviewed are 106 with various types of tank trucks. In addition, there are 184 drivers have been interviewed in Kotawaringin Barat with various types of tank trucks. The number of respondents interviewed in these two regencies can be seen in Figure 3. The RP surveys to the shippers have been conducted in Lamandau, Kotawaringin Barat, Seruyan, Kotawaringin Timur, Katingan, Gunung Mas, Pulang Pisau, and Kapuas Regencies. There were 56 firms that had been interviewed in the period of May to October 2011.
Figure 3. Number of respondents of RP Survey (carriers) in Central Kalimantan
Based on the RP survey, the type of tank truck and its composition, the speed, and the total weight of loaded truck are as presented in figures 4 and 5.
Figure 4. Type and speed of tank truck transporting CPO in Central Kalimantan
Figure 5. Percentage of loaded truck in Kotawaringin Timur (a) and Kotawaringin Barat (b) Regencies
3. Travel distance, time, and cost
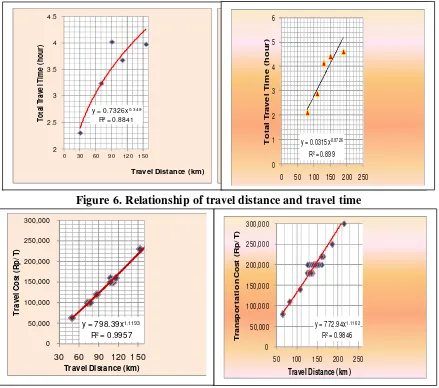
The travel distance, travel time and travel cost obtained from Revealed Preference (RP) survey were analyzed using SPSS. Based on statistical analysis result, it is known that the relationship of travel distance and time are as presented in Figure 6(a) for Kotawaringin Barat Regency and Figure 6(b) for Kotawaringin Timur Regency. In general, the relationship of travel distance and time is in power function as the followings:
In Kotawaringin Barat Regency : y = 0.7326 x 0.349 , R2 = 0.884 (1) In Kotawaringin Timur Regency : y = 0.0315 x 0.972 , R2 = 0,899 (2)
The relationship of travel distance and cost are as presented in Figure 7(a) for Kotawaringin Barat Regency and Figure 7(b) for Kotawaringin Timur Regency. In general, relationship of travel distance and cost is in power function as follows:
Figure 6. Relationship of travel distance and travel time
Figure 7. Relationship of travel distance and cost
4. Modelling of regional transportation for CPO by considering generalized cost
The flow chart used to modelling CPO transportation is as illustrated in Figure 8. In addition, the data required in modelling CPO transportation are GIS data as presented in Table 1. By utilizing the equation (1) and (2), the transportation cost of tank truck can be obtained (Rp 1500/ton/km). Further, the transportation cost using barge is taken from the data of survey to shippers (Rp 300/ton). The operational speed of tank truck is 45 km/hour (maximum) and the speed of barge is 35 km/hour. The shortest route from CPO factory to the nearest port is simulated using network analysis of ArcGIS 10 (closest facility). The result obtained from network analysis are O-D point, travel distance, and total travel time.
The generalized cost (GC), which is used as indicator of transport efficiency, is defined as the sum of fare (travel cost) and travel time cost. Further, travel time cost is calculated by multifying travel time with value of time. In more specific, the generalized cost can be calculated using the following formula:
Where:
Rich et al (2009) noted that usually the estimations of value of time (VoT) for freight are based on Stated Preference studies among the shippers. This will lead to a problem in that the various definition of shippers and shipments from one case study to another. Moreover, they also promoted that VoT follows the commodity rather than modes. It means that a high VoT is not due to attributes associated to the mode but because different modes carry different commodity mixes. This new perspective is then adopted for estimating the VoT in this study. CPO is grouped as bulk commodity. By refering the FEMEX (Fidelity Advisor
Emerging Europe Middle East Fund) standard (2003), which had been corrected by Rich et
al (2009), the VoT for bulk commodity is 0.63 euro/ton/hour or equal to Rp 7700/ton/hour.
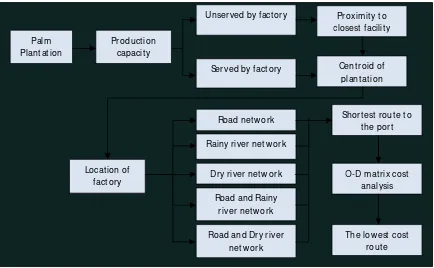
Figure 8. Flow chart of modelling CPO transportation using ArcGIS 10
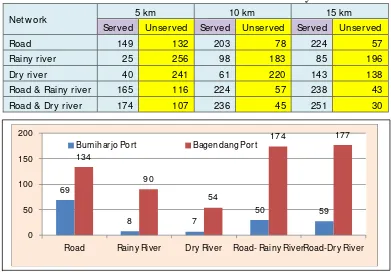
To define the shortest route from CPO factory to port, the closest facilities function in ArcGIS 10 is used. In this stage, simulation among three options of tolerance 5 km, 10 km, and 15 km are utilized. Moreover, there are 2 ports considered as the final outlet, they are Bagendang port (Kotawaringin Timur) and Bumiharjo port (Kotawaringin Barat). The lowest generalized cost of each O-D pair is selected as the most efficient route. It is to be noted that the capacity constraint of each transportation networks is not considered. Based on the result of network analysis, the number of CPO factories that are served and unserved by five transportation networks (road, rainy river, dry river, combination of road
and rainy river, and combination of road and dry river) are as presented in Table 2. It is obviously seen that combination of road and river, either in dry and rainy season, serves the high number of CPO factory for all tolerance distance (5, 10, and 15 km). Moreover, the number of CPO factories served by the two ports (Bagendang and Bumiharjo) is as illustrated in Figure 9. By considering the calculation of O-D matrix cost, the lowest generalized cost among five alternatives is intermodal or combination of road-rainy river. It also convinces that intermodal transportation is more efficient compare to unimodal.
Table 2. Number of CPO factories served and unserved by the networks
Net w ork 5 km 10 km 15 km
Served Unserved Served Unserved Served Unserved
Road 149 132 203 78 224 57
Rainy river 25 256 98 183 85 196
Dry river 40 241 61 220 143 138
Road & Rainy river 165 116 224 57 238 43
Road & Dry river 174 107 236 45 251 30
Figure 9. Number of CPO factories served by two general ports
CONCLUSIONS
The RP surveys conducted in Central Kalimantan, either to the shippers and carriers, have provided data of the type and composition of vehicle, weight of loaded vehicle, speed of vehicle, and the distance range of CPO transportion. Furthermore, total travel time, cost, and distance are considered as the attributes influencing the generalized cost.
The result of GIS analysis shows that combination of road and river, either in dry and rainy season, serves the high number of CPO factory for all tolerance distance (5 km, 10 km, and 15 km). In addition, by considering the generalized cost, the lowest generalized cost is by using combination of road and rainy river. It also convinces that inter-modal transportation is more efficient compare to uni-modal (road or river only). Hence, it is recommended to provide an adequate port and access road from factory to the ports to support CPO transportation in the region.
69
8 7
50 59
134
90
54
174 177
0 50 100 150 200
Road Rainy River Dry River Road- Rainy RiverRoad-Dry River
ACKNOWLEDGEMENT
It is a pleasure to thank Dr. Mark Zuidgeest and M.Sc students involved in the Group Research Project, Double Degree Programme ITB-ITC Year 2010/2011, University of Twente, The Netherlands. The authors also would like to thank the Institute for Research and Community Services (LPPM) of Universitas Gadjah Mada that have provided funding for this research through Dissertation Grant FY 2011.
REFERENCES
Badan Perencanaan Pembangunan Daerah Provinsi Kalimantan Tengah. 2009. Rencana
Umum Tata Ruang Kawasan dan Kota Provinsi Kalimantan Tengah, Palangka Raya.
Kreutzberger, E., Macharis, C,, and Woxenius, J. 2006. Intermodal versus unimodal road freight transport, in Towards Better Performing Transport Networks, Routledge, Oxon, page 17-42.
Kuncoro, M. 2002. Analisis Spasial dan Regional: Studi Aglomerasi dan Klaster Industri Indonesia, STIM YKPN, Yogyakarta.
Lem, L, L, 2002. Promoting Economic Development by Improving Transportation Infrastructure for Goods Movement, U.S. Economic Development Administration, USA
Mahmudah, N., Parikesit, D., Malkhamah S., Priyanto, S., Zuidgeest, M. 2012. Study of Modal Competition for CPO Transportation in Central Kalimantan, International
Journal of Civil and Environmental Engineering IJCEE-IJENS Vol. 12 No. 04, pp
17-24.[online] http://www.ijens.org/Vol_12_I_04/1212204-0505-IJCEE-IJENS.pdf Mahmudah, N, 2011, Laporan Akhir Hibah Disertasi Doktor UGM TA 2012, LPPM
UGM, Yogyakarta (unpublished)
Mahmudah, N., Parikesit, D., Malkhamah S., Priyanto, S., Zuidgeest, M. 2011, Modeling Freight Transportation for Crude Palm Oil in Central Kalimantan, Proceeding of the 3rd International Conferences of European Asian Civil Engineering Forum
2011, 20-22 September 2011, Universitas Atma Jaya, Yogyakarta, pp 49-54
Mahmudah, N., Parikesit, D., Malkhamah S., Priyanto, S. 2010. Regional Freight Transportation Model for Crude Palm Oil (CPO) in Central Kalimantan, Jurnal
Transportasi Vol 10 No. 3, Desember 2010, pp 213 - 224
Mahmudah, N., Parikesit, D., Malkhamah S., Priyanto, S., Zuidgeest, M. 2010. Regional Freight Transportation Planning: An Overview of Developing Methodology,
Proceedings of Malaysian Universities Transportation Research Forum and
Conferences 2010 (MUTRFC2010), 21 December 2010, Universiti Tenaga Nasional,
Putrajaya, Malaysia, pp 99 – 116.
Rich, J, Holmblad, P, M and Hansen, C, O. 2009. A Weighted Logit Freight Mode-Choice Model, Transportation Research Part E, Elsevier (in Press)