Noor Mahmudah1*, Danang Parikesit1, Siti Malkhamah1, Sigit Priyanto1, and Mark Zuidgeest2
1
Department of Civil and Environmental Engineering, Universitas Gadjah Mada, Yogyakarta, Indonesia
2
Faculty of Geo-Information Science and Earth Observation, University of Twente, Enschede, The Netherlands *e-mail of corresponding author: [email protected]
ABSTRACT
To formulate an effective strategy for regional freight transportation planning, the planners or policy makers need to know the location of resources, processing or factory locations, and the final outlet (ports) to send their goods to the outside world. Thus, an understanding of how the relationships between commodities’ activities and transportation are linked by spatial structure is essential. This study attempts to give illustration about the freight transportation model in the regional scale for specific commodity toward export. To do this, various characteristics of different available transport networks and modes that can be used to transporting specific commodity, are the important factors to be considered. The case of Crude Palm Oil (CPO) transportation in Central Kalimantan shows that modelling freight transportation in the regional scale can be conducted by using Geographical Information System (GIS) analysis by considering distance, travel time, travel cost, and season as the variables influencing the transportation system. Moreover, there are two stages applied in building the model: the first stage is modelling location choice and spatial pattern of CPO production; and the second one is modelling freight transportation of CPO commodity. The analysis of the model shows that there is a competition between road transportation and inter-modal (road-river) transportation in the region.
Keywords: Central Kalimantan, CPO, freight transportation model, GIS.
1. INTRODUCTION
There is a parallel evolution of a political economy and the transportation system either in developed or developing countries. The growth of economic will also increase the number of ton-km of freight transportation. As flows of freight and their impacts increase, transportation planners, managers, and operators have a more concern to develop a better methods for tracking and monitoring the flows of commodities and analyzing the impacts of these flows to the transportation infrastructures. Current estimation of freight flows and analysis methods have several problems, which are related to the data and the method itself. The existing freight transportation planning methods, for instance, are generally adopted from the conventional four-stage model (Houlguin-Veras et al, 2001; Southworth, 2002; De Jong et al, 2004).
Freight transportation plays an important role in the regional and economic growth and development, which is mainly to ensuring the efficient movement and timely availability of goods. To enhance the efficiency and quality of freight transportation, it is necessary to improve the overall cost effectiveness and functioning of transport operations and infrastructures. Nowadays, it is more and more realized that inter-modality may provide a key towards a better performing transport system (Kreutzberger et al, 2006) because of environmental concerns, reasons of efficiency and the benefits of co-ordination of modes to cope with growing transportation flows (OECD, 1997 in Bontekoning, 2000; Bontekoning et al, 2004).
To formulate an effective strategy for regional transportation planning, the planners or policy makers need to know the location of resources, processing or factory locations, and the final outlet (ports) to send their goods to the outside world. To do this, various characteristics of the different commodities and the available networks that can be used, need to be known. An understanding of how the relationships between commodities’ activities and transportation are linked by spatial structure is essential. Moreover, the relationship of the economics activities of commodities toward export - specifically the production of goods and services that generate freight transportation, the spatial data of commodities related to the economics’ activities (resources, factories, and outlets), the transportation data (infrastructures, modes, and services), and government regulations, is now crucial to be considered in formulating the method for freight transportation planning by considering intermodality concept, to produce an efficient freight movement to enhance sustainable mobility and economic development in the regional scale.
2. MATERIALS AND METHODS
[image:2.595.150.449.181.309.2]Recently the government of Indonesia stated that palm oil industry plays more important roles, at least, in three areas of the economic development. Firstly, it contributes significantly to the creation of millions employment opportunities and the alleviation of poverty, especially in rural areas. Secondly, palm oil industry is also one of the engines of regional development. Many areas developed mainly due to the existence and expansion of this industry. Thirdly, palm oil industry has become major non-oil export earnings. In 2008, for example, the export earnings from palm oil valued at around US $ 12.4 billion dollars, which is the largest contributor of export earnings non-oil exports (The Coordinating Ministry for Economic Affairs, 2009).
Figure 1. Investment on plantation in Central Kalimantan
The Province of Central Kalimantan is the fourth-largest-palm plantation in Indonesia, after the Province of Riau, North Sumatra and South Sumatra respectively. In 2009, the total area of palm plantations in Central Kalimantan is 4,011,032.364 Ha but only 1,687,969.104 Ha that has been operated and licensed. Crude Palm Oil (CPO), which is the primary products of palm plantation, grew 13.5% by the period of 2000-2004 and it rose up to 15% in 2007. The current productivity of palm plantation to produce CPO in Central Kalimantan is around 0.205 ton CPO/ha/year (Provincial Government of Central Kalimantan, 2009). Investment and consumption are the main activities of activator economy in Central Kalimantan. By considering the foreign and domestic investment in the last five years (2005 to 2009) - as reported by Central Bank of Indonesia, the growth of investment in plantation, which is mostly to support CPO industries, is as illustrated in Figure 1 (Mahmudah et al, 2010).
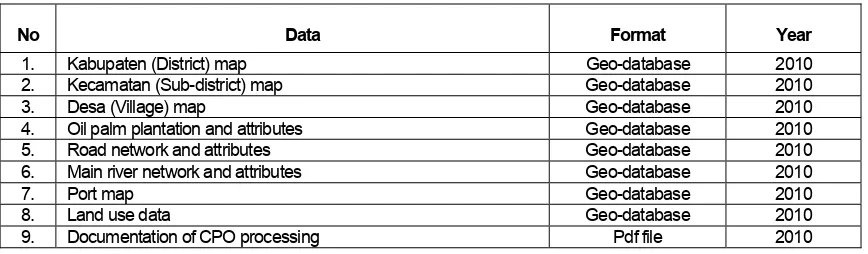
Nowadays, most of national and provincial roads in Central Kalimantan, which are used as the main access for CPO production and distribution, are in poor condition. According to the Public Works Office of Central Kalimantan Province (2006), it is estimated more than 50% of the existing roads, which consist of 1,707.57 km-long national road and 1,050.26 km-long of provincial road, are in bad condition due to truck-overloaded. Most of the trucks transporting CPO are loaded up to 12 tons although maximum of the prevailed axle load is only 8 ton. This circumstance is not only affecting the transport infrastructures (like road deterioration) but also the transportation services as well (like longer travel time and higher transportation cost due to low speed of vehicle). Therefore, an appropriate method of freight transportation planning (including modelling), in relation to the spatial location of commodities’ activities is required to achieve efficient freight flow in the region. The data used in the model analysis and vehicle characteristics considered in the model are presented in Table 1 and 2 (Mahmudah, et al, 2010).
Table 1. Data used for modelling CPO transportation
No Data Format Year
1. Kabupaten (District) map Geo-database 2010
2. Kecamatan (Sub-district) map Geo-database 2010
3. Desa (Village) map Geo-database 2010
4. Oil palm plantation and attributes Geo-database 2010
5. Road network and attributes Geo-database 2010
6. Main river network and attributes Geo-database 2010
7. Port map Geo-database 2010
8. Land use data Geo-database 2010
[image:2.595.85.519.571.698.2]Table 2. Vehicle characteristics of CPO transportation
Max Des. Speed
Capacity (kph) Range Average (Rp) (US$) Medium Truck
7.5 T 60 35 - 50 40 Rp 3200/Ton/Km US$ 0.34/Ton/Km Tanky Truck
6.8 T 60 35 - 50 40 Rp 6460/Ton/Km US$ 0.68/Ton/Km Tanky Barge
400 - 800 DWT 30-60 40 Rp 6000/Ton US$ 0.63/Ton (1000 - 2000 T)
Transport Mode Operational speed
(kph) Travel Cost
This study utilize the freight network simulation, especially using ArcGIS software by considering spatial location and transportation factors as the input, and government regulation as the constraints, to modeling intermodal freight transportation in regional scale by considering the generalized costs as efficiency indicator of optimum transportation system. The spatial location and transportation models built in this study are part of proposed methodology for regional freight transportation planning, which is on-going research in Universitas Gadjah Mada. In order to achieve the objectives as explained earlier, the Network Analyst of ArcGIS software is applied.
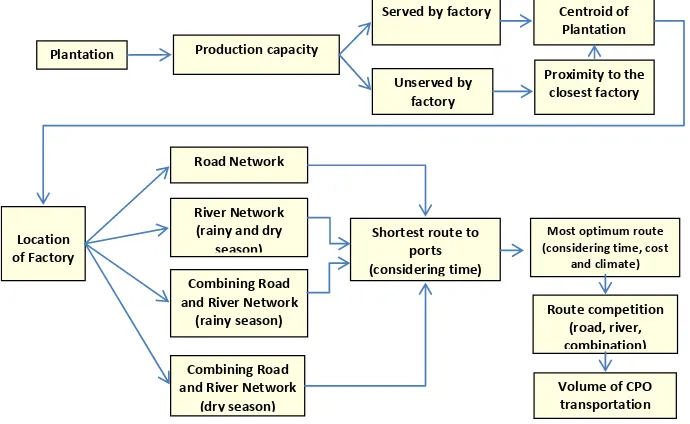
Broadly there are two stages applied in building the model. The first stage is modeling location choice and spatial pattern of CPO production; and the second one is modeling freight transportation of CPO commodity. These two stages are then elaborated in more specific steps. Two steps considered in modelling location choice of CPO factory are defining the CPO factories and defining the shortest route. In addition, the steps required to modeling freight transportation of CPO commodity are determining the transfer points, determining the most optimum route from factories to port, and calculating probability and volume of modal competition.The methodology used for modelling CPO transportation is as illustrated in Figure 2.
Most optimum route (considering time, cost
and climate)
Plantation Production capacity
Served by factory
Unserved by factory
Centroid of Plantation
Proximity to the closest factory
Location of Factory
Route competition (road, river, combination) Road Network
Shortest route to ports (considering time) River Network
(rainy and dry season)
Volume of CPO transportation Combining Road
and River Network (rainy season)
Combining Road and River Network
(dry season)
Figure 2. Methodology of modelling CPO transportation
Factories are defined on the basis of the productivity of palm plantation. Generally the productivity of palm plantation is 30 up to 35 tons fresh fruit bunch (FFB) per hectares (ha) in which it can produce 6 tons of CPO. In addition, the minimum capacity of mills (for CPO processing) used by CPO factory owners is 30 FFB/hour. Therefore, the CPO factory with capacity of 30 tons FFB/hour need at least 6,000 hectares area of palm plantation. However, for plantations with the total area less than 6.000 hectares will not build their own factory, but they are served by nearest factories. The location of CPO factories is assumied in the center of the plantations.
[image:3.595.126.471.374.586.2]are: the villages that are passed by the navigable river in dry and rainy season; the closeness to arterial, collector and local road; and number of factories that are possible to use the transfer points. The place of transfer points are digitized on screen in ArcGIS software. Total transfer point identified in this research is 11 points. Direction rule applied for each transfer point is Oneway From To function.
The most optimum route is determined by using Microsoft Excel software. The variables which are used to define the optimum routes are distance, travel time, travel cost and season. Calculation of utility for each network is different. For instance, road networks consider the distance in defining the travel cost. However river networks only consider the volume (weight) of goods. Thus the utility of river networks do not consider the distance and travel time because the travel cost is relatively constant. The owner of palm plantation and CPO factory only uses rental cost. The shortest distance unit for river transport is 6.5 Km (based on the shortest distance derived from the network analyst) multiplied by lowest tanky barge speed 30 Km/hr. After calculating the utility of each route, the next step is calculating probability to use certain transport mode (road, river and combination) which then can be differentiated in two seasons (rainy and dry seasons). The value of probability represents the preference of CPO factories owner to choose a specific transport mode. The higher the probability, the more possible the specific mode is used, or vice versa. After obtaining the probability value, the next step required is calculating the volume (weight) of CPO that is transported using certain transport mode by multiplying the probability of each route to the total CPO shipped from each factory.
One of behavioral model is conditional logit model, and this model has often been used to model freight mode choice. The estimation of a freight transport demand function using a Conditional Logit model has emphasized the role of cost, transit time, and frequency of shipments as determinants of mode choice (Garcia, et al, 2004). To calculate the value of utility and the logit model, te following equation can be used (Mahmudah et al, 2010).
) ( 3 ) ( 2 ) ( 1 ) , ,
(TimeCostClimate TravelTime TravelCost Climate
V = =β +β +β ...(1)
)) ( ) ( ( ) ( river road road road V Exp V Exp V Exp y Probabilit − − − − = ...(2) )) ( ) ( ( ) ( river road river river V Exp V Exp V Exp y Probabilit − + − − = ...(3) )) ( ) ( ) ( ( ) ( mix river road mix mix V Exp V Exp V Exp V Exp y Probabilit − + − + − − = ...(4)
In this case study, climate (season) factor is considered by dividing river network into two networks. The first network consists of river which can be navigated in both dry and rainy season and the second one consists of river which can be navigated only in the rainy season. Therefore, the equation (1) is modified to become:
) ( 3 ) ( 1 ) ( 1 ) ,
(TimeCost TravelTime TravelCost LoadingTime
V = =β +β +β ...(5)
3. RESULTS AND DISCUSSIONS
Based on the consideration of that a CPO factory is established in the centre of plantation, which has more than 6,000 ha size area, there are 277 factories identified. The distribution of factory is as illustrated Figure 3. It is clearly seen on the map that the location of plantation are distributed along the river and road network. Further, there are two seaports as the final destination of CPO transportation in Central Kalimantan Province; they are Sampit and Kumai seaports. Three kinds of network are identified; they are road networks, river networks and combination of road and river networks (multi-modal networks). Due to the road networks are not influenced by seasonal factor, so there is only one type of road networks built in this model. On the other hand, because of not all river are navigable throughout the year, the networks are divided into two networks; first one is river networks which are navigable in dry season and the other one are river networks which are navigable in rainy season. As a result, the combination networks also divided into two networks. Firstly the combination of road and river networks which is navigable in dry season and the second one is combination of road and river networks which is navigable in rainy season.
Figure 3. CPO Factory Map
In term of combination route (road-river networks), there are 277 factories identified and 182 of them can be served during the rainy season. Moreover, there are 63 factories that have more efficient route if they transport CPO to Kumai port, while the other 119 factories has more efficient route for sending CPO to Sampit port. In dry season, there are 189 factories can be served, in which 77 factories transport their CPO to Kumai port and 112 factories transport CPO to Sampit Seaport. By using Network Analysis in ArcGIS application, the shortest path analysis can be done. However, the impedance used in ArcGIS is only one parameter and the TIME is chosen. Thus, the result is the shortest path based on time consideration. Based on this approach, it is known that by combining the transport modes, the number of factories can be served by the networks will be more optimum as shown in Figure 4.
0% 50% 100%
Ro ad River (Rainy Seaso n)
River (Dry Seaso n)
Co mbinatio n (Rainy Seaso n)
Co mbinatio n (Dry Seaso n)
Unserved
[image:5.595.115.481.379.494.2]Served
Figure 4. Percentage of factory served by each networks
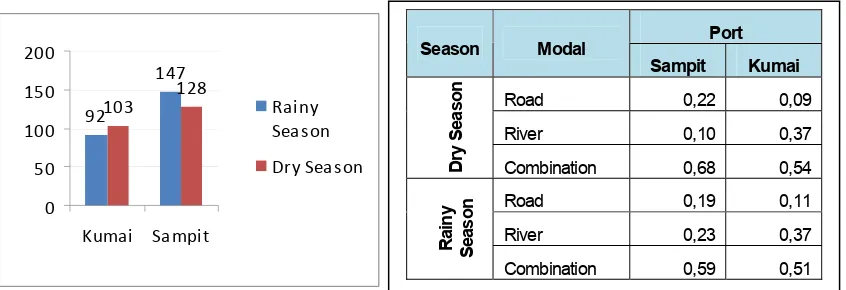
Through utility calculation, the optimum route is determined by considering travel cost, travel time, season (climate), and loading/unloading time. Based on utility value calculation, it can be concluded that the number of factories that transported CPO to Sampit port are 147 factories in rainy season and 128 factories in dry season. In addition, the factories transported CPO to Kumai port are 92 factories in rainy season and 103 in dry season with probability as illustrated in Figure 5.
92
147
103
128
0 50 100 150 200
Kumai Sampit
Rainy Season
Dry Season
Port Season Modal
Sampit Kumai
Road 0,22 0,09
River 0,10 0,37
D
ry
Seas
on
Combination 0,68 0,54
Road 0,19 0,11
River 0,23 0,37
Rain
y
Seas
[image:5.595.89.512.588.733.2]4. CONCLUSION
There are 3 types of modal networks (road, river and combination of road and river networks) considered in building the model for CPO transportation in Central Kalimantan Province. Due to seasonal reason where not all the rivers can be navigable throughout the year, therefore the river and combination networks are then classified as dry and rainy season networks. In order to develop the model of combination networks, transfer points need to be determined first. The shortest route is determined by considering the time as the attributes to connect the factory to the ports where the CPO will be transported to outside the Province. Among three networks considered in the model, shortest route in combination networks serves the higher number of factories rather than in unimodal road networks only and river networks only. Based on the calculation of the most optimum route, which is defined by considering travel time and cost, season/climate and loading/unloading time, Sampit port served more factories than Kumai port. Finally, competition of three modal networks result shows that multi-modal networks which is the combination of road and river networks, either in dry or rainy season, provides the high probability compare to other modal networks (road networks only and river networks only).
5. AKNOWLEDGEMENT
It is a pleasure to thank Dr. Mark Zuidgeest and M.Sc students involved in the Group Research Project, Double Degree Programme ITB-ITC Year 2010/2011, University of Twente, The Netherlands.
6. REFERENCES
[1] Bontekoning, Y.M., Macharis, C., and Trip, J.J. Is a new applied transportation research field emerging?A review of intermodal rail-truck freight transport literature. Transportation Research Part A 38 (2004), pp. 1–34.
[2] Bontekoning, Y.M. A jump forward in intermodal freight transport: are hub-terminals an alternative for shunting? TRAIL Research School, Delft. (2000)
[3] Central Bank of Indonesia. Kajian Ekonomi Regional Provinsi Kalimantan Tengah. Retrieved on 23 December 2009 from http://www.bi.go.id/web/id/
[4] De Jong, G., Gun, H. F., and Walker, W. National and international freight transport models: an overview and ideas for further development. Transport Reviews 24 (1) (2004), pp. 103 – 124. Retrieved on 16 June 2009 from http://eprints.whiterose.ac.uk/2015
[5] Holguin-Veras, J, et al. (2001). An assessment of methodological alternatives for a regional freight model, Appendix I : literature review on freight transportation demand modelling. New York Metropolitan Transportation Council Report, New York, NY. Retrieved on 1 April 2009 from http://www.utrc2.org/research/ assets/6/regionalfreight2.html
[6] Kreutzberger, E., Macharis, C., Woxenius, J. Intermodal versus unimodal road freight transport. In Jourquin, B., Rietveld, P., Westin, K. (2006). Towards Better Performing Transport Networks, Routledge,`Oxon, pp. 17– 42
[7] Mahmudah, N., Parikesit, D., Malkhamah, S., Priyanto, S., and Zuidgeest, M. Regional Freight Transportation Planning: An Overview of Developing Methodology. Malaysian Universities Transportation Research Forum and Conference, Malaysia, 21 December 2010, pp. 99 -116
[8] Mahmudah, N., Parikesit, D., Malkhamah, S., and Priyanto, S. Regional Freight Transportation Model for Crude Palm Oil in Central Kalimantan.Jurnal Transportasi FSTPT Vol. 10 No.3, December 2010, pp. 213-224
[9] Menendez, L, G, Zarzoso, I, M and De Miguel, D, P. Determinants of mode choice between road and shipping for freight transport: Evidence for four Spanish exporting sectors, Journal of Transport Economics and Policy, Volume 38 Part 3 (2004), pp. 447–466
[10] Office of Public Works of Central Kalimantan Province. (2006). Sinergi antara transportasi jalan dan sungai di Kalimantan Tengah menuju sistem berkelanjutan, Palangka Raya
[11] Provincial Development Planning Agency of Central Kalimantan. (2009). Rencana Umum Tata Ruang Kawasan dan Kota Provinsi Kalimantan Tengah, Palangka Raya
[12] Southworth, F. (2002). Freight Transportation Planning: Models and Methods, Book Chapter, K.G. Goulias (Ed) CRC Press, USA