REGIONAL FREIGHT TRANSPORTATION MODEL FOR
CRUDE PALM OIL
IN CENTRAL KALIMANTAN
Abstract
This study attempts to model freight transportation of specific commodity in the regional scale, particularly to identify the shortest route of Crude Palm Oil (CPO) commodities, which are transported from factories to ports using different transportation network and mode. Several activities were performed, including identifying the location of palm plantations and factories supporting CPO industries, identifying intermediate points in the road and river networks, and determining the access route of CPO transportation from factory to the road or river networks. In determining the shortest route, various transportation networks and modes are simulated using Geographical Information System analysis by considering travel distance, time, and cost as the variables influencing transportation systems. There are 113 of CPO factories identified, then be classified into three classes by considering their production capacity. It is found that 80 factories are classified as small (71%), 26 factories are medium (23%), and 7 factories are big (6%). The shortest route is identified through both road and river networks. The analysis of the shortest routes shows that road networks have shorter travel distance and time compared to the rivers. Nevertheless, river transportation offers a cheaper price compared to road transportation. Therefore, there is a competition between these two transportation modes, in which about 51% of factories probably use road networks and 49% use river networks. Moreover, it is predicted that about 70% of total CPO in Central Kalimantan is transported to Sampit port and only 30% is transported to Kumai port.
Keywords: freight transportation, shortest route, Geographical Information System
Abstrak
Pada studi ini dicoba untuk memodelkan transportasi barang suatu komoditas tertentu dalam skala regional, terutama untuk mengidentifikasi rute terpendek bagi komoditas Crude Palm Oil (CPO), yang diangkut dari
pabrik ke pelabuhan dengan menggunakan jaringan dan moda transportasi yang berbeda. Beberapa kegiatan dilakukan pada studi ini, termasuk mengidentifikasi lokasi perkebunan sawit dan industri penunjang industri CPO, mengidentifikasi titik pertemuan jaringan transportasi jalan dan jaringan transportasi sungai, serta menentukan rute akses transportasi CPO dari pabrik ke jaringan transportasi jalan atau jaringan transportasi sungai. Dalam menentukan rute terpendek, berbagai jaringan dan moda transportasi disimulasikan menggunakan analisis Sistem Informasi Geografis dengan mempertimbangkan jarak, waktu, dan biaya perjalanan sebagai variabel-variabel yang mempengaruhi sistem transportasi. Terdapat 113 pabrik CPO yang berhasil diidentifikasi, yang kemudian dikelompokkan menjadi tiga kelas berdasarkan kapasitas produksi mereka. Diketahui bahwa terdapat 80 pabrik termasuk klasifikasi kecil (71%), 26 pabrik masuk klasifikasi sedang (23%), dan 7 masuk klasifikasi besar (6%). Rute terpendek diidentifikasi bagi kedua jaringan transportasi, yaitu jalan dan sungai. Analisis rute terpendek menunjukkan bahwa jaringan transportasi jalan mempunyai jarak dan waktu perjalanan yang lebih pendek dibandingkan dengan jaringan transportasi sungai. Namun demikian, transportasi sungai menawarkan harga transportasi yang lebih murah dibandingkan dengan transportasi jalan. Oleh karena itu, terjadi kompetisi di antara kedua moda transportasi tersebut, dengan kemungkinan sekitar 51% pabrik menggunakan jaringan transportasi jalan dan sekitar 49% menggunakan jaringan transportasi sungai. Selain itu, diperkirakan sekitar 70% dari total CPO di Kalimantan Tengah ini diangkut ke pelabuhan Sampit dan hanya 30% yang diangkut ke pelabuhan Kumai.
Kata-kata kunci: angkutan barang, rute terpendek, Sistem Informasi Geografis
INTRODUCTION
Transportation is often regarded as a prerequisite of economic development. The growth of economic requires transport and infrastructure development (Kreutzberger et al, 2006a). Moreover, Simon (1996) has showed that the transportation affects the growth of economic in the country or region. The importances of transport infrastructure to the four key aspects of economic development are in production costs, industrial location, regional productivity, and cost of interregional trade (Lem, 2002).
Freight transportation plays an important role in the regional and economic growth and development, which is mainly to ensuring the efficient movement and timely availability of materials or goods. To enhance the efficiency and quality of freight transportation, it is necessary to improve the overall cost effectiveness and functioning of transport operations and infrastructures. Nowadays, it is more and more realized that inter-modality may provide a key towards a better performing transport system (Kreutzberger et al, 2006b) because of environmental concerns, reasons of efficiency, and the benefits of co-ordination of modes to cope with growing transportation flows (OECD, 1997 in Bontekoning, 2000; Bontekoning et al, 2004).
There is a parallel evolution of a political economy and the transportation system either in developed or developing countries. The growth of economic will increase the number of ton-km of freight transportation. The case of European Union and Indonesia showed that across all freight transport modes, road freight transportation remains dominant (Stead and Banister, 2006; Lubis et al, 2005). On the other hand, empirical studies showed that the domination of road freight transportation caused economic loss, and safety and environmental problems. Road deterioration and traffic accident due to overloaded truck, and adverse impact to the environment, due to gas emissions and noise of truck, are the main problems raised from road freight transport (Kreutzberger et al, 2003).
flows of commodities and analyzing the impacts of these flows to the transportation infrastructures. Current estimation of freight flows and analysis methods have several problems, which are related to the data and the method itself. To formulate an effective strategy for regional transportation planning, the planners or policy makers need to know the location of resources, processing or factory locations, and the final outlet (port) to send their goods to the outside world. To do this, various characteristics of the different commodities and the available networks that can be used, need to be known. An understanding of how the relationships between commodities, activities and transportation are linked by spatial structure is essential. In addition, the spatial and network analysis provided in ArcGIS program, can be used as an effective tools in the determination of the service coverage area of commodities’ activities and routing towards outlet in a region.
Recently the government of Indonesia stated that palm oil industry plays more important roles, at least, in three areas of the economic development. Firstly, it contributes significantly to the creation of millions employment opportunities and the alleviation of poverty, especially in rural areas. Secondly, palm oil industry is also one of the engines of regional development. Many areas developed mainly due to the existence and expansion of this industry. Thirdly, palm oil industry has become major non-oil export earnings. In 2008, for example, the export earnings from palm oil valued at around US $ 12.4 billion dollars, which is the largest contributor of export earnings non-oil exports (The Coordinating Ministry for Economic Affairs, 2009).
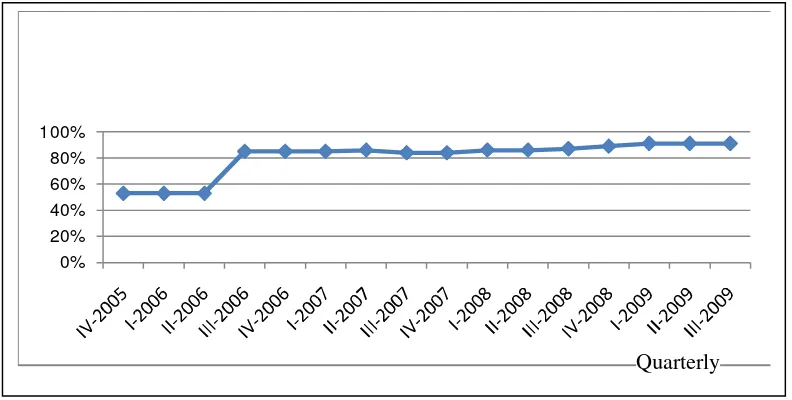
The Province of Central Kalimantan is one of provinces in Indonesia that has large palm plantation areas. This Province is the fourth-largest-palm plantation in Indonesia, after the Province of Riau, North Sumatra and South Sumatra respectively. In 2009, the total area of palm plantations in Central Kalimantan is 4,011,032.364 Ha but only 1,687,969.104 Ha that has been operated and licensed. Crude Palm Oil (CPO), which is the primary products of palm plantation, grew 13.5% by the period of 2000-2004 and it rose up to 15% in 2007. The current productivity of palm plantation to produce CPO in Central Kalimantan is around 0.205 ton CPO/ha/year (Provincial Government of Central Kalimantan, 2009). Investment and consumption are the main activities of activator economy in Central Kalimantan. By considering the foreign and domestic investment in the period of 2005 to 2009 -as reported by Central Bank of Indonesia, the growth of investment in plantation that is mostly to support CPO industries is as shown in Figure1.
The master plan of Central Kalimantan Province (2009) showed that around 26% of total area has been designed to palm plantation. The expansion of plantation area to support the CPO industries and the growth of vehicles derived from those commodities’ activities should be anticipated properly through the precise strategy of planning. The activities of production and distribution of these commodities will need transport infrastructures and services that can support these freight flow efficiently.
and higher transportation cost due to low speed of vehicle). Therefore, an appropriate method of freight transportation planning, in relation to the spatial location of commodities’ activities is required to achieve efficient freight flow in the region.
Source: Central Bank of Indonesia (2009)
Figure 1 Investment On Plantation In Central Kalimantan
The objective of this study is directed to identify the optimum location of CPO factories and to formulate the most efficient routes for transporting CPO from the CPO’s factories (origins) to the ports (destinations) by using GIS analysis. The specific objectives of this study are: (1) to identify the location of CPO factories in the study area, (2) to formulate the access and egress route of CPO transportation from factory to the road or river network, and (3) to determine the shortest route of various transportation networks and modes by considering distance, travel time, and travel cost.
This study utilize the freight network simulation, especially using ArcGIS software by considering spatial location and transportation factors as the input, and government regulation as the constrains, to modelling intermodal freight transportation in regional scale by considering the generalized costs as efficiency indicator of optimum transportation system. The spatial location and transportation models built in this study are part of proposed methodology for regional freight transportation planning, which is on-going research in Universitas Gadjah Mada. The considered factors in building the models among others: the type of commodities (fresh fruit bunch or FFB and CPO); transportation service attributes (travel cost and travel time); and the type of transportation modes (truck and barge/ship). The expected output of the research is the optimum utility (travel time and cost) resulted from the optimum location of resources, factories, and ports, to support the freight flow of CPO commodities in the regional scale. ArcGIS and statistical analysis will be used to model, map and visualize service coverage areas of logistics nodes for selected transporting commodities. This includes the analysis of the shortest routes from an origin (e.g. plantation and processing areas) to certain destination (e.g. sea and river ports) by using different modal network. The analysis will also determine and simulate the
0% 20% 40% 60% 80% 100%
Percent age of Invest ment on Plant at ion t o t he Tot al Invest ment (Foreign and Domest ics)
in Cent ral Kalimant an in t he Period of 2005-2009
shortest path in terms of travel time, travel cost, and the combination of both. The method used is as depicted in Figure 2 and the sequential processes of analysis in ArcGIS are illustrated on Figure 3 respectively.
To identify the closest road and river networks, the location of CPO factories are calculated using nearest distance to road and river networks. Intermediate points on the road and river networks are identified based on the nearest distance from factories to networks. The intermediate points are useful to define the access route from factory to the networks. Modelling the efficient route for transporting commodities from intermediate point to final ports by using road network considers the distance, travel time, and travel cost. Network analyst of ArcGIS software is used to determine the most efficient road and river networks from every CPO factory location to the two destination ports. Furthermore the closest facility from the factories is used to define where the commodity should be transported. Finally, the most efficient route of road and river networks to the ports is compared according to travel time and cost needed to transport the CPO commodities. The data used in the model analysis and vehicle characteristics are presented in Table 1 and Table 2.
Table 1 Data Used For Modelling CPO Transportation
No Data Format Year
1. Administrative map Geo-database 2006
2. Road network Geo-database 2006
3. River network Geo-database 2006
4. Port map Geo-database 2006
5. Land use map Geo-database 2006
6. Regional spatial plan (RTRW Province) Geo-database 2006
7. Palm plantation map Geo-database 2006
8. Regional economic growth Pdf file 2005-2009
9. Documentation of CPO processing and economics activities
Pdf file 2006 10 Documentation of port facilities and performance Pdf file 2005–2008
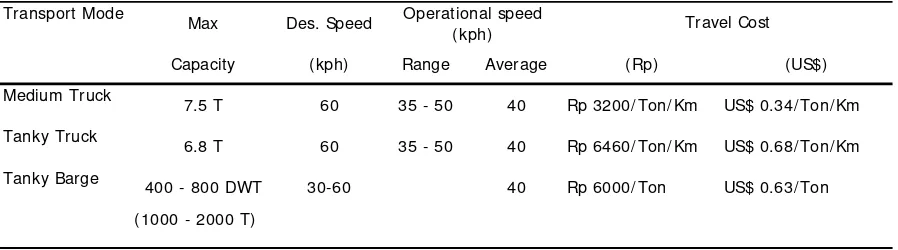
Table 2 Vehicle Characteristics Of CPO Transportation In Central Kalimantan Province
Source: Coordinating Ministry for Economic Affairs (2009) Max Des. Speed
Capacity (kph) Range Average (Rp) (US$)
Medium Truck
7.5 T 60 35 - 50 40 Rp 3200/ Ton/ Km US$ 0.34/ Ton/ Km
Tanky Truck
6.8 T 60 35 - 50 40 Rp 6460/ Ton/ Km US$ 0.68/ Ton/ Km
Tanky Barge
400 - 800 DWT 30-60 40 Rp 6000/ Ton US$ 0.63/ Ton
(1000 - 2000 T)
Transport Mode Operational speed
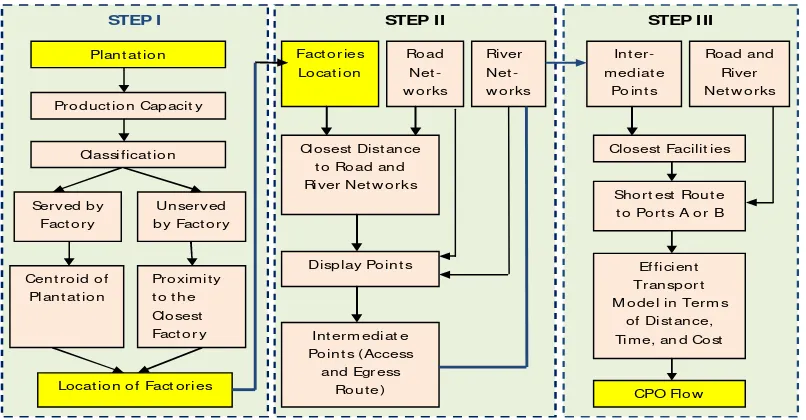
Figure 2 Research Methodology of CPO Transportation
Figure 3 Sequential Processes of Analysis in ArcGIS for CPO Transportation
STEP I
Classif icat ion Classificat ion
Modelling Location Choice And Spatial Pattern Of CPO Production
There are two steps considered in modelling location choice of CPO factory: (1) identification of optimum location of CPO factory, and (2) identification of the shortest route of CPO transportation from factory to the networks. Identification of the most likely location of CPO factories in this study is started from calculation of production capacity of palm plantation every year. Production capacity of plantation was classified in three classes according to service area. Assumption used in this study is that every plantation should have minimum area of 5,400 ha to have a factory. Proximity analysis using nearest distance to closest factory is used to identify the un-served plantations.
Identification of the shortest route of CPO transport from factory to the road and river network that consist of: (a) identification of intermediate points on the closest road and river networks from the factories, and (b) identification of accessibility level of factories to the networks. Intermediate; points are points in the road or river to transport CPO from factories to the final ports. These intermediate points are calculated from the shortest distance of factories to the road and river networks. The function of intermediate points in this process is to know the level of accessibility of factories to networks and to identify the starting points of transport route to the ports.
Accessibility levels show the ease to transport CPO from factories to the closest intermediate points in the road and river networks. To identify the level of accessibility, the assumption is based on average velocity of road transport mode (40 km/hour). The accessibility is classified as good if the distance is less than 10 km (15 minutes trip), 10– 20 km for moderate, and more than 20 for bad accessibility. The results of this process are the map accessibility of factories to the road and river networks.
Modelling Regional Freight Transportation Of CPO Commodity
There are several processes required in modelling regional freight transportation for CPO commodity in Central Kalimantan Province using network analysis of ArcGIS software. These processes include modelling distance, time, and cost of specific transportation mode, determining the nearest port, determining the shortest route of using road and river networks, and modelling of probability of choosing certain modes of transportation.
Identification of efficient CPO transportation from road and river networks using various modes considers some criteria, which are distance, travel time, and travel cost. For these criteria, the calculation is conducted by considering the average speed and travel cost of each mode. The average speed used was based on assumption that there is no different classes among networks either in road or river network, so that all segments in networks can be passed in the same speed without impedance. In terms of road network, the distance was calculated by considering the distance from the factories to road networks (intermediate points in road), based on a detour distance factor of 1.2. For river network, the calculation of these criteria is conducted by combination of both road and river networks. The combination is used because the factories are not directly attach to the river networks. To reach the river network, CPO are transported first to the river by road networks.
assumption that people tend to go to relatively closest facilities around them rather than to farther away facilities, because of distance, time and cost reasoning. Utility function measures the satisfaction level perceived by the decision-maker upon which he or she makes the choice decision. In term of transport, people consider time, cost, and other factors for satisfying them. This study only considers time and cost for determining utility that is indicated in linear function and is expressed as follows:
= ( , ) = 1 ( ) + 2 ( ) (1)
Generalized cost function is regarded as disutility or deterrence functions (Ortuzar and Willumsen, 2001) and it is considering the following formula:
= = + (2)
Estimation parameter is minus because it represents the disutility function of time and cost.
Probability of choosing certain modes is calculated by using the logit model from utility function of transportation by road and river. The logit model used for determining the probability of choosing certain mode is:
))
According to the analysis, there are 113 CPO factories identified. The factories are classified into 3 classes based on their production capacity: (1) small (less than 60 tons FFB/hour), (2) medium (60tons to 90 tons FFB/hour), and (3) big (more than 90 tons FFB/hour). Among 113 factories, 80 factories are small (71%), 26 factories are medium (23%), and 7 factories are big (6%).
port using road network is Kumai, on the other hands, by using river networks the closest port using river network is Sampit. This condition is closely related to the factory location from road and river networks (accessibility level to network), and the travel distance by road and river from factory to port. These conditions also considered on the latter step for determining the efficient routes from factories to ports, especially to which port and network the CPO will be delivered efficiently.
The accessibility of factories and plantations to the existing networks depends on the distance from factories or plantation to networks. According to the analysis, it is about 86 factories (76%) which have good accessibility to the road networks (less than 10 km distance and 10 minutes time). The rest is about 20 factories (18%) having moderate accessibility (10 km to 20 km and 10 minutes to 30 minutes), and 7 factories (6%) which have bad accessibility level to road (more than 20 km and more than 30 minutes). The plantations situated in the center area of Central Kalimantan tends to have good accessibility to road and those situated in the southern part of Central Kalimantan have bad accessibility to road. The concentration of road network in the center part (east to west) of Central Kalimantan and the lack of road network in the northern and southern part is one of the causing factors. Therefore, the local government should consider to provide road infrastructure on the southern and northern part, to give equal level of service for the whole area in the region.
On the other hands, the accessibility level of factories and plantation served by river network is mostly bad. It is about 43 factories (38%) are in bad accessibility. Only 34 factories (30%) have good accessibility, and 36 factories (32%) have moderate accessibility to river. This condition mostly depends on the distance of the factories and plantation to the river network. Only plantations which close to the river network have good accessibility. The distribution of river on the area cannot be considered on the analysis, because the locations of rivers naturally cannot be arranged. Considering the accessibility on both road and river networks, the plantation accessibility to network can be determined. There are 91 factories (81%) are identified as accessible to the networks, 19 factories (17%) are moderate, and only 3 factories (2%) are not accessible in both road and river networks.
The utility of each mode (river and road) is defined by the equation considering travel time and cost. The weighting factor of cost considered 4 times more important than
time. The estimated parameters β1 and β2 are derived from trial and error process,
considering former assumption in which people consider cost factor is 4 times important than time, because CPO is categorized into un-perishable goods. Hence the equation for utility, for road and river, are as follows:
= (−1. 000000) + (−0.000004 ) (5)
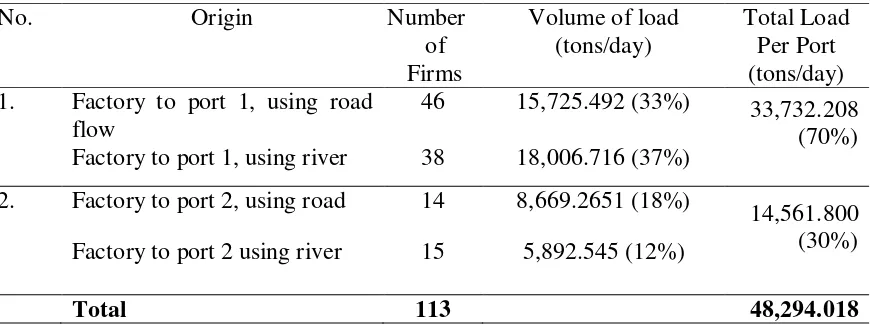
Table 3 CPO Flows On The Road And River Networks
No. Origin Number
of Firms
Volume of load (tons/day)
Total Load Per Port (tons/day) 1. Factory to port 1, using road
flow
46 15,725.492 (33%) 33,732.208 (70%) Factory to port 1, using river 38 18,006.716 (37%)
2. Factory to port 2, using road 14 8,669.2651 (18%)
14,561.800 (30%) Factory to port 2 using river 15 5,892.545 (12%)
Total 113 48,294.018
CONCLUSIONS
This study attempts to model freight transportation of specific commodity in the regional scale, particularly to identify the optimum location of CPO factories and to formulate the most efficient routes for transporting CPO from the CPO’s factories (origins) to the ports (destinations) using GIS analysis. The result show that there are 113 CPO factories identified is now locating in Central Kalimantan Province, which have different classification of their production capacity (based on service area) and different accessibility to the existing road and river networks.
The accessibility level depends primarily on the distance from factory to reach the closest networks. In term of road networks, the plantations with bad accessibility to road are located in the southern part of the study area, because of the lack of road infrastructures in this area.
Considering the travel time and travel cost, the road network is more efficient for transporting CPO. In adition, it is also supported by higher probability in choosing this transportation mode. However, the river network also has opportunity to compete with road network in term of travel cost. According to the result, There is little different between probability to choose road or river networks.
This study only considers travel time and cost for determining utility. In fact, there are other attributes that should be considered for utility calculation, such as the reliability of river network influenced by climate and error estimation. Moreover, the port (outlet) choice only depends on the shortest route in terms of distance, travel time, and cost, and doesn’t consider other attributes, such as the shipper or carrier preference, and other transportation service attributes (e.g. reliability/quality).
ACKNOWLEDGEMENTS
REFERENCES
Bontekoning, Y. M, Macharis, C, and Trip, J. J. 2004. Is a New Applied Transportation Research Field Emerging? A Review of Intermodal Rail-Truck Freight Transport
Literature. Transportation Research Part A, 38: pp.1–34.
Bontekoning, Y. M. 2000. A Jump Forward in Intermodal Freight Transport: Are Hub-Terminals An Alternative For Shunting? TRAIL Research School. Delft.
Central Bank of Indonesia. 2009. Kajian Ekonomi Regional Provinsi Kalimantan Tengah.
Retrieved from http://www.bi.go.id/web/id/ (diakses 23 December 2009).
Kreutzberger, E, Macharis, C, and Woxenius, J. 2006 a. Intermodal Versus Uni-Modal Road Freight Transport. Towards Better Performing Transport Networks: 17– 42. Kreutzberger, Konings, R, and Aronson, L, D. 2006b. Evaluation Of The Cost
Performance Of Pre- And Post-Haulage in Intermodal Freight Networks. In Jourquin, B., Rietveld, P., Westin, K. 2006. Towards Better Performing Transport Networks: 256 – 284.
Kreutzberger, E, Macharis, C, Vereecken, L, and Woxenius, J. 2003. Is Intermodal Freight Transport More Environmentally Friendly Than All-Road Freight
Transport? A Review, NECTAR Conference No 7, Umeå.
Lem, L, L. 2002. Promoting Economic Development by Improving Transportation Infrastructure for Goods Movement, United States Economic Development Administration, Washington, DC.
Lubis, H, A, Isnaeni, M, Sjafruddin, A, and Dharmowijoyo, D. 2005. Multimodal Transport in Indonesia: Recent Profile and Strategy Development, Proceedings of the Eastern Asia Society for Transportation Studies, 5: 46 – 64.
Ortuzar, J, D and Willumsen, L, G. 2001. Modelling Transport. New York, NY: John Willey and Sons.
Office of Public Works of Central Kalimantan Province. 2006. Sinergi antara transportasi jalan dan sungai di Kalimantan Tengah menuju sistem berkelanjutan. Palangka Raya.
Provincial Development Planning Agency of Central Kalimantan.2009. Rencana Umum Tata Ruang Kawasan dan Kota Provinsi Kalimantan Tengah. Palangka Raya.
Simon, D.1996. Transport and Development in the Third World. New York, NY.