DOI: 10.12928/TELKOMNIKA.v14i1.2353 588
An Optimum Database for Isolated Word in Speech
Recognition System
Syifaun Nafisah*1, Oyas Wahyunggoro2, Lukito Edi Nugroho3
1,2,3Deparment of Electrical Engineering and Information Technology, Universitas Gadjah Mada 1
Department of Library and Information Science, IslamicState University Sunan Kalijaga Yogyakarta,
Jalan Grafika No. 2, Yogyakarta 55281, 62 274 552305
*Corresponding author, e-mail: [email protected], [email protected], [email protected]
Abstract
Speech recognition system (ASR) is a technology that allows computers receive the input using the spoken words. This technology requires sample words in the pattern matching process that is stored in the database. There is no reference as the fundamental theory to develop database in ASR. So, the research of database development to optimize the performance of the system is required. Mel-scale frequency cepstral coefficients (MFCCs) is used to extract the characteristics of speech signal and backpropagation neural network in quantized vector is used to evaluate likelihood the maximum log values to the nearest pattern in the database. The results shows the robustness of ASR is optimum using 140 samples of data reference for each word with an average of accuracy is 99.95% and duration process is 27.4 msec. The investigation also reported the gender doesn’t have significantly influence to the accuracy. From these results it concluded that the performance of ASR can be increased by optimizing the database.
Keywords: Optimum, Database, ASR, Backpropagation, MFCCs
Copyright © 2016 Universitas Ahmad Dahlan. All rights reserved.
1. Introduction
An automatic speech recognition (ASR) uses the process and related technology for converting speech signals into a sequence of words or other linguistic units using an algorithm which was embedded as a computer program. Speech understanding systems presently are capable for vocabularies of thousands of words in operational environments. ASR has some ability for special purposes such as a machine translation. Now, ASR was armed with vast amounts of example translations and powerful computers to proving a significant progress for achieving the dream. The one algorithm for constructing an automatic machine translation system is using statistical analysis of bilingual parallel corpora. It is the best algorithm of machine translation systems for some language pairs up till now [1, 2]. In this algorithm, part of speech (PoS) is used as feature to improve the quality of this machine [3]. In this study, the experiments were conducted on long sentence (30 words). The results show that the average of increase in accuracy of the translation uses grammar PoS on before the use of PoS is 2.23%. The accuracy is increases about 4.13% or the accuracy is achieving up to 6.45% when the machine using PoS computing.
ASR consists of two major steps. First, DSP-style operations to convert the signal from analog to digital and the signal will extracted to get the key feature vectors. The key feature vectors are passed into pattern matching phase. In this step, ASR requires the data samples that are stored as database. Although this technology has been widely used, it still requires human review and intervention to ensure the accuracy rate of up to 100%. Several studies have documented that error rates are for vocabulary sizes of 200 is 3%, 5000 is 7% and more than 100000 is 45% [4]. Rabiner and Juang (2006) also explained word error rates for range of ASR such as described in Table 1 [5].
on the hybrid HMM-genetic algorithm (GA) to optimizing the Baum-welch method in the training process increase the accuracy from 20% to 41%. It is proved that these combinations give more optimal results than HMM method [6]. Linear predictive Coding (LPC) and dynamic time wrapping (DTW) also ever used as a technique in the matching process. The conclusion is state that these techniques are useful for Speaker Dependent & Speaker Independent in ASR [7]. Other method that is used to recognize the speech so that the system becomes faster, efficiently and accurately is combination between mel frequencies cepstral coefficients (MFCCs) and distance minimum techniques. Based on the experiments, it found that these combinations give the best performance results accurately in most of the cases with an overall efficiency of 95%. The study also reveals that the HMM algorithm achieves the effeciency of the system up to 98% to identify the most commonly used isolated word [8].
Table 1. Word error rates for a range of speech recogni tion systems Vocabulary size Word Error Rate
11 1000 2500 64000 210000 28000 - 45000
0.3% - 5.0% 2.0% 2.5% 6.6% ~ 15% ~ 27% - 35%
Will speech-processing system ever reach human transcriber accuracy? Realistically, this will not happen. Wankhede et al. determined the dimension that affect the accuracy of speech recognition system. These dimensions are vocabulary size, confusability of word, dependence/independence speaker, isolated/discontinuous/continuous speech, read/spontaneous speech and adverse conditions [4]. It will produce a various pattern in data reference in database. The various pattern in database makes the training phase is difficult to do when tested using various sample groups. How to minimize the effects of these dimensions in database is becomes a chore that is constantly scrutinized by research in ASR. Based on this consideration, this paper will present the proposed method by developing an optimum database to produce the robustness speech recognition system in order to generate recognition accuracy approaching 100%.
2. Proposed Method
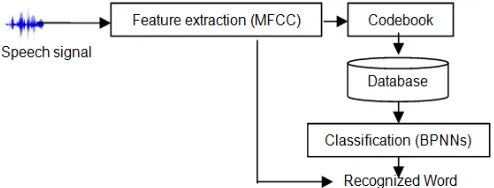
The main goal of this study is to develop the database for isolated word. The investigation covers how many data speech and the impact of gender in the database to improve the accuracy of ASR. It includes the algorithm that will be used in the development of database for data reference. The block diagram in the Figure 1 shows the proposed model.
Figure 1. Block Diagram of System
3. Research Method
3.1. Speech Data Selection
speakers. First, the recording process was done to acquire data that was constructed using isolated word in Indonesian language. The recording must be clean with minimal background disturbance. Any mistakes made while recording have been undone by re-recording or by making the corresponding changes in the transcription set. To ensure the minimal disturbances, the process was performed in a sound treated audiometric booth using vocal microphone PG48-LC, mini mixer EuroRack UB1002FX that was connected to computer. The distance between the mouth to microphone was carefully maintained at one inch from the left hand corner of the mouth and duration of pronounciation for each word about two second [9]. The data testing was grouped into four dataset and will tested using the combination such as shown in Table 2.
Table 2. The combinations of data set
Combination Training set Testing set Combination Training set Testing set
1 2 3 4 5
Set I Set I Set I Set II Set II
Set II Set III Set IV Set I Set III
6 7 8 9
Set II Set III Set III Set III
Set IV Set I Set II Set IV
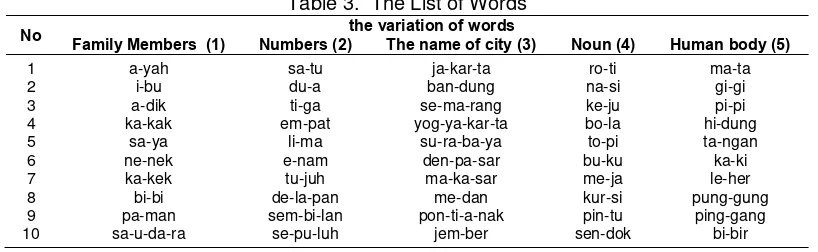
Set I consists of the males data speech, Set II is females data speech and Set III is combination between males and females speakers. Set I, II and III are the speakers who fill as data reference in the database. Set IV consist of combination between males and females speakers who is not fill the database as data reference. All of the data set will tested by other data set to evaluate the accuracy of the system. The speaker ranging from 15-22 years of age. They asked to utters a set of words in a normal manner which the utterance was repeated 12 times in a low-noise environment to reduce acoustic interference and only the first eight repetitions were used in the training/testing phase [10]. The data was segregated individually and stored as *.wav files using Cool Edit Pro 2.0. The set of word are listed in Table 3.
Table 3. The List of Words
No the variation of words
Family Members (1) Numbers (2) The name of city (3) Noun (4) Human body (5)
1 2 3 4 5 6 7 8 9 10
a-yah i-bu a-dik ka-kak
sa-ya ne-nek ka-kek bi-bi pa-man sa-u-da-ra
sa-tu du-a ti-ga em-pat
li-ma e-nam
tu-juh de-la-pan sem-bi-lan se-pu-luh
ja-kar-ta ban-dung se-ma-rang yog-ya-kar-ta
su-ra-ba-ya den-pa-sar ma-ka-sar me-dan pon-ti-a-nak
jem-ber
ro-ti na-si ke-ju bo-la to-pi bu-ku me-ja kur-si pin-tu sen-dok
ma-ta gi-gi pi-pi hi-dung ta-ngan ka-ki le-her pung-gung
ping-gang bi-bir
3.2. Feature Extraction
The first step in feature extraction process is segmented the signal to get specific parts of the utterances by listen the wave file of each data to look the boundary of the specific parts, then cut the wave file to extract the specific parts manually. For example, the word ‘Pintu’, will cut into ‘Pin’ and ‘Tu’ waves files. Another sample is the word ‘Jakarta’ will segmented into ‘Ja’, ‘Kar’ and ‘Ta’ From the recording process, this study have 13230 final words, and after the segmentation step, from 13230 final words, there are 26850 wave files as data reference in the database such as described in Table 4.
Table 4. The final words of data speech
Speech Data Utterances Segmented Files
Female Male
8380 4850
17900 8950
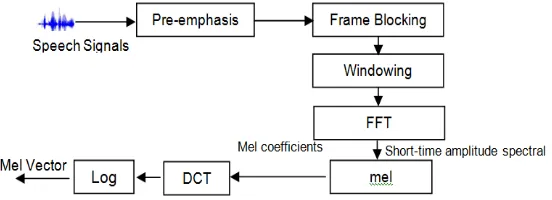
In this process, the MFCCs was used for acoustic features because it takes human perception sensitivity with respect to frequencies. Figure 2 shall explain the step-by-step computation of MFCCs in this investigation [11-12].
Figure 2. Block Diagram of Speech Analysis Procedure
3.2.1. Pre-emphasis
The 1st step in MFCC algorithm is send the speech signal to a high-pass filter using the following equations:
∗ (1)
Where s n is the output signal and the value of which used in this study is between 0.9 and 1.0. The z-transform of the filter is:
∗ (2)
The goal of pre-emphasis is to compensate the high-frequency part that was suppressed during the sound production mechanism of humans. The result of this process will be used as the input in the frame blocking process.
3.2.2. Frame Blocking
After the pre-emphasis process, the signals were segmented into frames. In this study, the sample rate is 44.1 kHz and the frame size is 1024 sample points, so the duration is:
. sec
Based on this caluculation, the speech data will segment during 20 msec with overlap 50% of each frame. If the overlap is 512 points, then the frame rate is:
.
In this process, the signals needed a zero padding process into the length value = 50000 as the nearest length of power of two frames.
3.2.3. Windowing
The next process is windowing all of the frames. In this step, each frame has to be multiplied with a function of window to keep the continuity first and last points of the frame. If the signal in a frame is denoted by , , … , , then the signal after windowing is:
, ∗ (3)
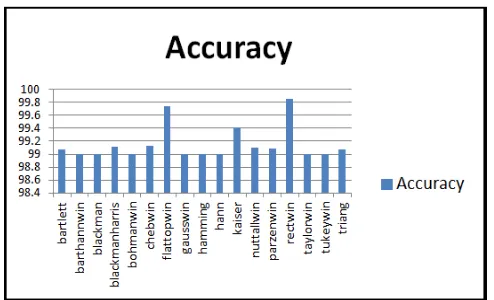
Figure 3. The accuracy based on the various function of windows
defined by:
. , (4)
In practice, the value is set to 0.97. MATLAB also provides the command rectangle for generating the curve of a Rectangle window.
3.2.4. Fast Fourier Transform (FFT)
After windowing, spectral analysis shows that different timbres in speech signals corresponds to different energy distribution over frequencies. To obtain the magnitude frequency response of each frame, FFT was performed. In this process, the signal is assumed a periodic, and continuous when wrapping around. If this is not the case, the signals can still perform FFT but the incontinuity at the frame's first and last points is likely to introduce undesirable effects in the frequency response. To deal with this problem, the signals are multiply each frame by a rectangle window to increase its continuity at the first and last points. If the input frame consists of three identical fundamental periods, then the magnitude frequency response will be inserted two zeros between every two neighboring points of the frequency response of a single fundamental period. In other words, the harmonics of the frequency response is generally caused by the repeating fundamental periods in the frame. However, in this study, to extract envelop-like features, this step uses the triangular bandpass filters, as explained in the next step.
3.2.5. Mel
After the coefficients were kept, this investigation will compute the DCT of the log filterbank energies. There are two main reasons this is performed. The first reason is the filterbanks in this study are all overlapping and the second reason is the filterbank energies are quite correlated with each other. To compute the DCT of the log filterbank energies, the frequency of the signal should convert into Mel scale using the following equations:
log ⁄ ) (5)
The result of this step is the diagonal covariance matrices can be used to model the features in the classifier. From this step, the matrices composed by 96 cepstral coefficients per feature which were consist of 47 MFCCs coefficients, 47 MFCCs delta features that indicate the degree of spectral change, one energy feature, and one delta-energy feature. In recognizer, Cepstral-mean-subtraction (CMS) of the MFCCs coefficients was done to remove some of the effects of noise.
3.2.6. Discrete Cosine Transform (DCT)
cos ∗ . ∗ / ∗ (6)
Where N is the number of triangular bandpass filters, L is the number of MFCCs. In this step, the investigation set N=20 and L=12.
3.2.7. Log Energy
After mel-filter bank processing, log processing will be done. The energy within a frame is also an important feature that can be easily obtained. Hence this step adds the log energy as the 13rd feature to MFCCs.
3.2.8. Delta Cepstrum
It is also advantagous to have the time derivatives of energy and MFCCs as new features, which shows the velocity and acceleration of both. The equations to compute these features are:
∆ / (7)
The value of M is set to 2. In this study, this study add the velocity, the feature dimension is 26, so the acceleration, the feature dimension is 96-dimensional features for recognition.
3.3. Classifier
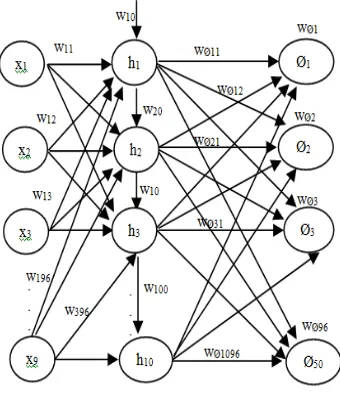
The final step of this study is send the features to the classifier. In this study, the BPNNs have 96 input nodes, 10 hidden nodes, and 50 output nodes which was trained using 4364 samples from each word. The architecture of classifier shown in Figure 4.
Figure 4. 96-10-50 BPNNs Architecture Figure 5. The MSE of recognizer using various numbers of hidden nodes
The experiments fixed that the number of hidden layer to ten. Figure 5 shows the Mean Square Error (MSE) of the utterance type recognizer with one hidden layer and various number of hidden nodes.
4. Results and Discussion
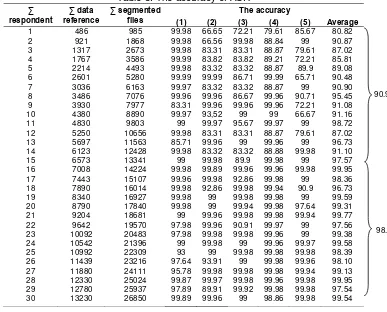
scenario such as already shown in Table 1. All of the data was trained using the BPNNs algorithm. The number of iterations use an epoch that will be set as a variable. The variable was needed because the system iterated until all the errors were below the threshold of 0.5, or until the number of iterations reached 1,000,000. An epoch was trained with a fixed training set until all the errors that was produced by the data pairs were below a threshold. Every epoch comprised a variable number that were resulted by backpropagation iterations. The data testing will be tested using one respondent and the system will be calculated the accuracy and the number of respondent will be added to be two, three, etc until ASR is finding the number of respondent in the database which will produced the robust system for recognition. Based on the experiments, the result of the test shown in Table 5 and Table 6.
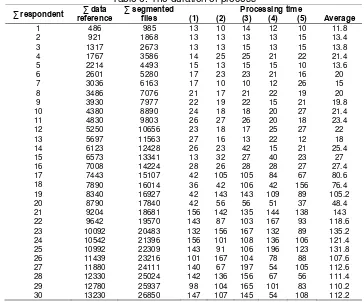
As explanation of Table 5 and Table 6, (1), (2), (3), (4) and (5) is the group of words that have been previously described in Table 2. Based on experiments in Table 4 and Table 5, the number of respondents in the database generates the difference of accuracy. For example, by using one respondent, the experiments noted that the average of accuracy that is produced by each group are 99.98%, 66.65%, 72.21%, 79.61% and 85.67%.The processing times are 13 msec, 10 msec, 14 msec, 12 msec dan 10 msec. Based on these values, the accuracy of system using one respondent is 80.82% on average and the average of duration of process is 11.8 msec.
The investigation noted the occurrence of fluctuations of the accuracy that occurs when the number of respondents in the database is increased. For example, when the number of respondents is increased up to six respondents, the accuracy has increased for all groups up to 90.48% with the duration of process is 20 msec on average, but this accuracy is not stable. It can be seen from the decrease in accuracy on some groups while the number of respondents is increased up to twelve respondents. The investigations noted that when data reference in database is increased up to twelve respondents, the accuracy of each groups are 99.98%, 83.31%, 83.31%, 88.87% and 79.61%. Based on this result, it can calculated the average of accuracy is 87.02% and the duration of process that is needed is 22 msec on average. In other words, there has been a decrease in accuracy by 3.46%.
Table 6. The duration of process
Table 5 and Table 6 shows that the ASR produces the robust system by using at least 7008 sample of utterance as data reference in the database. In this study, 7008 data samples were collected from 16 respondents and it produces the accuracy up to 99.95% with the duration of process is 27.4 msec. This study shows that the number of data samples in the database with a minimal amount of reference data as much as 7008 can produce a more reliable system. The Accuracy that is generated using the number of samples less than 7008 is 90.92% on average with the lowest accuracy is 80.82% and the highest accuracy is 98.86%. While accuracy using a data samples least than 7008 is 98.69%. The lowest accuracy is 95.94% and the highest accuracy reaches 99.95%. It means that if 50 words need 7008 sample of syllables to produce the robustness of ASR, so for each word, the system requires about 140 samples of syllables that are collected from 16 respondents.
Table 7. The impact of gender to the accuracy
Gender of Trainer Accuracy
Male Female All Data
Male 99.76 99.76 99.76 Female 99.56 99.56 99.56
Male+Female 99.69 99.67 99.66
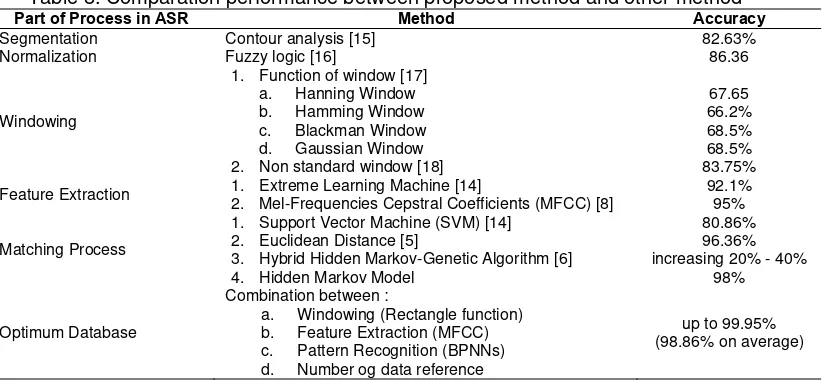
The experiment shows that the male speaker is produce the accuracy higher than female speaker with the difference of 0.2%. It is not the significant values. The combination of males and females speaker in database also shows the small difference value only around 0.1%. It means that the composition of gender in database does not affect the accuracy of system. Based on the experiments, the main conclusion is the accuracy of speech recognition system will generate an optimum value almost to 100% by performing the processing of data reference that will be stored in the database. The processing of data reference will reach an optimum value by developing an optimum database. The development not only in the parts of the ASR process but it covers all of the processes. If we compare the results that have been done by some researchers to improve the performance of ASR, it is clearly visible that the efforts of improvemnet by using an emphasis on one process can not produce optimal value of ASR such as describe in Table 8.
Table 8. Comparation performance between proposed method and other method
Part of Process in ASR Method Accuracy
Segmentation Contour analysis [15] 82.63%
Normalization Fuzzy logic [16] 86.36
Windowing
1. Function of window [17] a. Hanning Window b. Hamming Window c. Blackman Window d. Gaussian Window 2. Non standard window [18]
67.65 66.2% 68.5% 68.5% 83.75%
Feature Extraction 1. Extreme Learning Machine [14]
2. Mel-Frequencies Cepstral Coefficients (MFCC) [8]
92.1% 95%
Matching Process
1. Support Vector Machine (SVM) [14] 2. Euclidean Distance [5]
3. Hybrid Hidden Markov-Genetic Algorithm [6] 4. Hidden Markov Model
80.86% 96.36% increasing 20% - 40%
98%
Optimum Database
Combination between :
a. Windowing (Rectangle function) b. Feature Extraction (MFCC) c. Pattern Recognition (BPNNs) d. Number og data reference
up to 99.95% (98.86% on average)
5. Conclusion
Acknowledgements
The authors would like to thank for the support given to Ministry of Religious Affairs of the Republic of Indonesia for the scholarship of doctoral degree program.
References
[1] Koehn P. Statistical Machine Translation. New York: Cambridge University Press. 2010.
[2] Peng L. A Survey of Machine Translation Methods. TELKOMNIKA Indonesian Journal of Electrical
Engineering. 2013; 11(12): 7125-7130.
[3] Sujaini H, Kuspriyanto, Arman AA, Purwarianti A. A Novel Part-of-Speech Set Developing Method for
Statistical Machine Translation. TELKOMNIKA Indonesian Journal of Electrical Engineering. 2014;
12(3): 581-588.
[4] Wankhede HS, Chhabria SA, Dharas RV. Human Computer Interaction Using Eye and Speech: The
Hybrid Approach. International Journal of Emerging Science and Engineering (IJESE). 2013; 1(7):
54-58.
[5] Rabiner LR, Juang BH. Speech Recognition: Statistical Methods. Elsevier. 2006: 1-18.
[6] Emillia NR, Suyanto, Maharani W. Isolated Word Recognition Using Ergodic Hidden Markov Models
and Genetic Algorithm. TELKOMNIKA Indonesian Journal of Electrical Engineering. 2012; 10(1):
129-136.
[7] Shinde RB, Pawar VP. Isolated Word Recognition System based on LPC and DTW Technique.
International Journal of Computer Applications. 2012; 59(6): 1-4.
[8] Swamy S, Ramakrishnan KV. An Efficient Speech Recognition System. Computer Science &
Engineering: An International Journal (CSEIJ). 2013; 3(4).
[9] Goss B. Listening as information processing. Communication Quarterly. 1982; 30(4).
[10] Polur PD, Gerald ME. Effects of high-frequency spectral component in computer recognition of
dysarthric speech based on Mel-cepstral stochastic model. Journal of Rehabilitation Research &
Development (JRRD). 2005; 42(3): 363-372.
[11] Doman G. What To Do About Your Brain-injured Child. Square One Publishers. 2005.
[12] Tiwari V. MFCC and its applications in speaker recognition. International Journal on Emerging
Technologies. 2010: 19-22.
[13] Furui S. Digital Speech Processing: Synthesis and Recognition. Second edition. CRC Press. 2000. [14] Hardy, Cheah YN. Question Classification Using Extreme Learning Machine on Semantic Features.
Journal of ICT Research and Applications. 2013; 7(1): 36-58
[15] Kurniawan F, Mohd Rahim MS, Sholihah N, Rakhmadi A, Mohamad D. Characters Segmentation of
Cursive Handwritten Words based on Contour Analysis and Neural Network Validation. Journal of
ICT Research and Applications. 2011;5(1): 1-16.
[16] Suyanto, Putro AE. Automatic Segmentation of Indonesian Speech into Syllables using Fuzzy
Smoothed Energy Contour with Local Normalization, Splitting, and Assimilation. Journal of ICT
Research and Applications. 2014; 8(2): 97-112.
[17] Favero RF. Comparison of mother wavelets for speech recognition. International Conference Speech
Science and Technology. 1994: 336-341.
[18] Rozman R, Kodek DM. Improving speech recognition robustness using non-standard windows.