Growth
and Development of UnderfÏves
in Marunda
Area
in
North
Jakarta
Titi
Sunarwati SularyoAbstrak
Abstract
Keywords : Growth' developnent, feetling pattern, breastfeeding
pattern, ntother's reproductive pattern, nother,s
schooling-INTRODUCTION
:g':ïJ:lii::hi"î.1}ar
stimuration ror underrivesmethod can easily and quickly be performed, is reliable and valid. The DDST can effectively identify 85% -LOO%
of
underfiveswith
developmental delays. On further îo\\ow-upit revea\ed
that 89% of the group of underfiveswith
abnormal DDSTfail
at school 5-6 years later.s-8Th*
assessing the growth and develop-mentof
the underfives and early detecting abnor-malities so as to be able to early intervene when needed are of great importance for the child.The purpose of this paper is to evaluate underfives in Marunda, a rural coastal area in North Jakarta concern-ing their growth and development and what environ-mental factors relate to them.
METIIODS
This study was conducted prospectively
in
the year 1986 on underfives aged 6 to < 60 months chosen at random, who lived in a coastal rural area in Marunda, North Jakarta.The
investigations conducted on the child consisted of measurement of body weight for age, body lengthor
heightfor age, general
physical ex-amination, the Denver Development Screening Test (DDST), and interviewwith
thechild's
mother in termsof
environmental factors that might probably have influence on the child's growth and development suchas mother's
andfather's
educational level, mother's reproductive pattern, family income, child's feeding pattern, breastfeeding,numbr
of underfives,morbidity and immunization
statusof
child,
the presence of educative playthings, verbal communica-tion etc.Parental educational level was considered poor when they never
had
any schooling at all. Family income was considered poor when the total family income was Rp. 15,000.00or
less per capita per month.A
good immunization status was considered when at the ageof
less than 14 months the child had had once BCG, 3 times DTP and Polio, or when the child was less than 14 months the immunization was already performed according to the schedule.The child's growth status I was good when the child's weight was between the 97th and 3rd centile of NCHS (National Center
for
Health Statistics) chart, Growth statusII
was good when thechild's
length or height was between the 97th and 3rd centile of NCHS chart. The child's development status was considered good when the DDST was normal. The child feeding pattern was good whenit
was accordingto
the standard schedule and the breastfeeding pattern was good whendwing the first 4 months the child got only breastfeed-ing. The KMS utilization was good when the weight
for
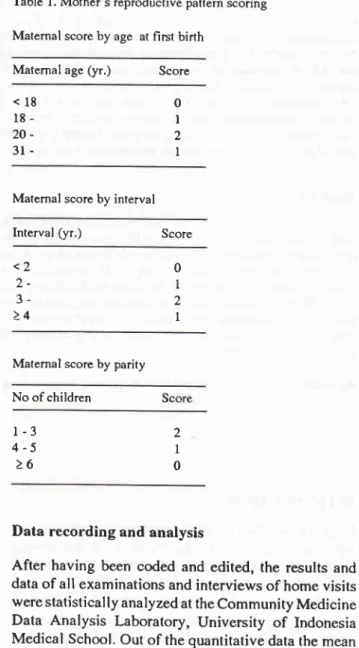
age curve was graphically plotted on the weight chart of the KMS, Mother's reproductive pattern was named as good when the reproductive score was 5-6, and poor when it was(
4.Table l. Mother's reproductive pattern scoring Matemal score by age at first birth
Maternal age
(yr.)
Score<18 18-
20-
3l-Matemal score by interval
Interval (yr.) Score <2
)_ 3->4
Maternal score by parity No of children
l-3
4-5
>62 I 0
Data recording and analysis
After having been coded and edited, the results and data of all examinations and interviews of home visits were statistically analyzed at the Community Medicine Data Analysis Laboratory, University
of
Indonesia Medical School. Out of the quantitative data the mean values and standard deviations weregiven.
Sig-nificance tests were also made to compare the groups, by the chi-square, Fisher, and Kolmogorov-Smirnov tests with a p value of 0,05 (5%) for being significant and 0,01(l
%) for being very significant. For analyz-ing the multiple influences of various independent onthe
dependentvariables the
multiple
regression analyses were made by the stepwise approachof
the standard statistical formula.0 I 2 I
RESULTS AND DISCUSSION
Marunda was a rural coastal area about 30 km away from Jakarta. The total population was 50OO people, 40% were.under the age
of 15 years
with 500 under-fives. Thetotal area was 7.46 km
square thus the population density was 760 people/km square. There were many fish ponds found owned by the so called "juragans" or landlords who lived in Jakarta city.Most of the mothers under study were housewives, 88.2% of them had low education.
While most
of the fathers were fishermen working as laborers at the fish ponds they did not own themselves. The family income was low, to wit the average income to be Rp. l3,ZB7 .OOper capita per month.
The number of the children included in this study was 102 underfives, out of which 43 were girls and 59 boys. The ages ranged
from
6
months to < 60 months. See Table 2.Table 2. Distribution of Children by Age Group
Age (months) Number Percentage
nourished, So the figure
of
malnourishmentin
this study (35.3 %) was more than three times higher than the general figureof
malnutritionin
underfives in Indonesia, i.e.,1l.l
%.Theproportionof severe mal-nutrition was also much higher than- that in general in Indonesia, namely 8.8 % vs 1.7 %.rt)Growth status
I
(body weightfor age parameter)
Table 4 reveals that 57 children (55.9 To) had a good growth status (growth statusI)
and 45 (44.1 % ) had a poor growth status.Table 4. Distribution of Studied Children by Growth status
I*
Growth Status
I
No
percentageGood
Poor 55.944.1
57 45
Total 100.0
* Growth Status I : body weight for age parameter
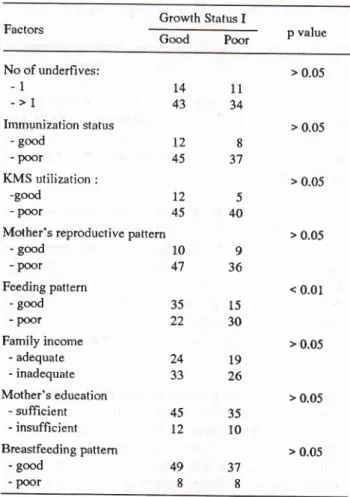
Table 5. Distribution
of Growth
StatusI
by Influencing
FactorsGtowth Status
I
FactorsPoor p value
Good t02
6- 12- 24- 36-48-<60
l9 24 l6 29 t4
18.6 23.5 15.8 28.4
13.7
Total 100.0
The mean
age of
the children under study was 31.8 (SD 16,3) months. Thus it belonged to the ideal age as was stated by Pechevis that the ideal age for underfivesto be
investigated gn their growth and development was 12-36 months.4Table 3. Distribution of Children by Nutritional Status
Nutritional Status Percentage
r02
No of underfives: -1
->1
Immunization status - good
- poor
KMS utilization :
-god - poor
Mother's reproductive pa ttern - good
- POor Feeding pattern
- good - poor Family income
- adequate - inadequate Mother's education
- sufficient - insufficient Breastfeeding pattem
- good - Poor
t4 43
T2
45
t2 45
l0 47
ll 34
8
37
5
40
9 36
l5 30
19 26
35 t0
37
8
> 0.05
> 0.05
> 0.05
> 0.05
< 0.01
> 0.05
> 0.05
> 0.05 No
Well-nourished Undernourished Severely undernurished
57 36 9
55.9 35.3 8.8
35 22
45 12 24 33
Total t02 100.0
Table 3 shows that from all the 102 children,5T (55.9 %) werc in good nutritional states, 36 (35.3 %) were malnourished and
9
(8.8 %) were severely
mal-49
Table 5 indicates that the child's growth status I, also meaning the
child's nutritional
status, was very sig-nificantly related to the child's feeding pattern (p < 0.01). This finding was also supported by the resultsof
the multiple regression analysis of the growth statusI
by those confounding factors resulting in the fact that the growth statusI comprised partially
28%of
the feeding pattern when the other factors were held con-stant.All
these seem to be very logical, and similar findings were also reported Uy other investigators.3'4Growth
statusII
(linear growth, stature, body
lengthor height
for
age parameter)From table 6 it is clear that 60 children (58.8 %) were in a good growth status
II
and 42 (41.2 %) were in a poor growth status II.Table 6. Distribution of Children by Growth status II*
Growth Status II Percentage
58.8 41.2
Total 100.0
* Growth Status II : body length or height for age parameter
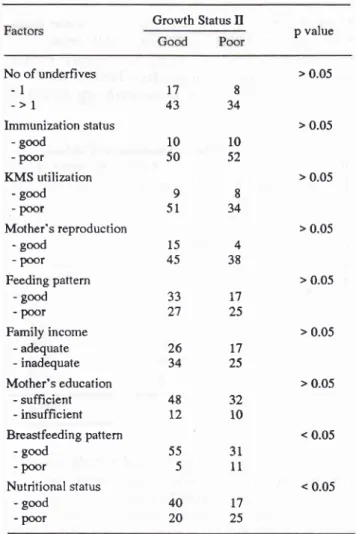
Table
7
shows that factors significantly related to growth statusII
were the child's breastfeeding pattern and nutritional status (p < 0.05). The multiple regres-sion analysisof
growth statusII
also revealed thatgrowth
statusII
comprised partially36
%of
the breastfeedingpattern,
and partially26
%
of
the mother's reproductive pattern respectively, when the other factors were held constant.Table 8 shows that the breastfeeding pattern was also significantly related (p < 0.05) to the feeding pattern. Thus from Table
7,
the above multiple regression analysis and Table 8 one could conclude that when the child's nutritional status was good and the child got exclusive breastfeeding followed by a good feeding pattern the child would grow, per se linearly (stature),well,
as
h-adalso
been
put forward by
other authors.l I'12That the mother's reproductive pattern played a role in constituting the growth status
II
(linear growth,stat-ure) can be explained as follows:
havinga
good reproductive pattern the motherwill
for a long time be healthy so that she will be able to create a stable rearing practicefor her children which
will
in turn give
thechildren a long lasting positive effect on the growth especially the linear growth. This is rather different withgrowth status I which is made of the body weight and thus be very sensitive and dynamic to go up or down acutely depending upon the child's condition and health at any one time.e'll
Table 7. Distribution of Growth Status
II
by Influencing factorsGrowth Status
Il
p value
No of underfives
-l
->l
Immtrnization status
- good - Poor
KMS utilization - good - Poor
Mother's reproduction - good
- poor Feeding pattern
- good - poor Family income
- adequate
- inadequate
Mother's education - sufficient
- insufficient Breastfeeding pattern
- good - poor
Nutritional status
- good - poor
178
43
34l0
l050
5298
51
34> 0.05
> 0.05
> 0.05
> 0.05
> 0.05
> 0.05
> 0.05
< 0.05
< 0.05
60
42
Good
Poor
45
154
3833
r72'7
2526
t734
25ro2
48
32t2
1055
315
1140
l720
25Table 8. Distribution Pattern
of Feeding Pattem by Breast-feeding
Feeding Pattem
p value Good
Breastfeeding pattem
good Poor
< 0.05 48
4 38
t2
Development status
Normal Abnormal
Table 9. Distribution of Studied Children by Developmental
Status
Development
Status
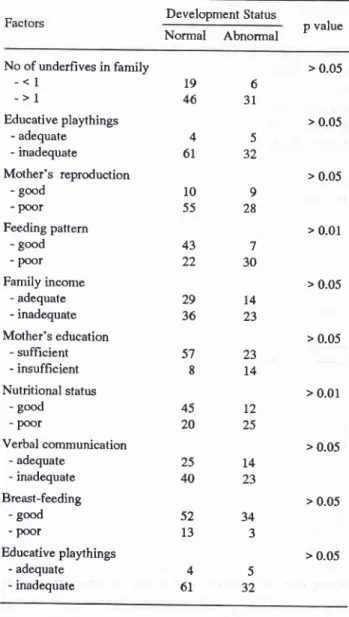
No Percentagestatus (p < 0.01), and feeding paftern (p < O.0l). The multiple regression analysis supported also the above
mentioned finding as it revealed that the development
status comprised
of
partially 33% the feeding pattern, partially 27% ahe nutritional sratus and partially 26% mother's education when the other factors were heldconstant.
It
was reasonable that the development status wasdetermined
by
the
feeding pattern, the nutritionalstatus and the rnother's education.
A
good feedingpattern promotes a good nutritional status which in turn leads
to
a secure prepared constitution thatis
con-ducive to receive and digest the mental stimulation given from the environment.
A mother with a proper, sufficient education
will
make herself competentto
createa rearing practice with
early, abundant stimulation (rich verbal communica-tion, the presence of proper educative playthings etc.)needed
by
the childto
develop optimally. Such amother has also a positive role in promoting the child's nutritional status as she knows to select a variable but nutritious menu
for
herchild that
will
enhance the child's nutritional status in a positive way.Table I l. Relationship between Growth Status I and Growth
Status II of Srudied Children
Growth Status
II
good p value
65 37
63.7 36.3
Total 100.0
There were 65 children (63.7 %) who had normal
development status while 37 (36.3 7o) were abnormal.
Table 10. Distribution of Developmental Status by Influencing
Factors
Development Status
Normal
Abnormal p valuer02
No of underfives in family
-< I
->1
Educative playthings - adequate - inadequate
Mother's reproduction - good
- poor Feeding pattern
- good - poor Family income
- adequate - inadequate
Mother's education - sufficient
- insufficient Nutritional status
- good
- poor
Verbal communication - adequate
- inadequate
Breast-feeding - good - poor
Educative playthings - adequate - inadequate
196
46
3145
61
32109
55
28437
22
3025
L440
2334
3
45
6t
3257
23814
2936
45 20
t4
23
> 0.05
> 0.05
> 0.05
> 0.01
> 0.05
> 0.05
> 0.01
> 0.05
> 0.05
> 0.05
Growth status I :
- good
- poor
40
20
25L7 P < 0.05t2
25
Table 1l indicates that the growth status I (body weight
for
age parameter) was significantly relatedto
thegrowth status
II
(the linear growth or body length forage parameter, p < 0.05). So either the body weight for
age parameter (growth status tr) or the body length for age parameter (growth status
II,
per se the lineargrowth, stature) both reflected
well
enoughin
this study the growth of the child.Table 12. Relationship between Growth Status
II
andDevelopment Status of Studied Children
Development Status
Normal
Abnormal p value52
l3
From Table 10 it seems that factors which were statis-tically significantly related to the child's development
status were mother's education (p < 0.05), nutritional
Growth Status II :
- Good
- Poor
43 22
l7
20
Table 13. Relationship between Growth Status I and Develop-ment Status of Studied Children
Development Status
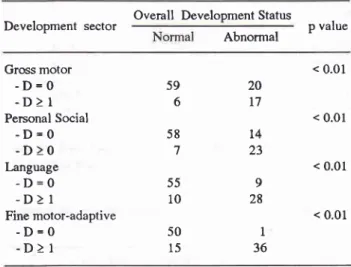
Table 15. Distribution
of
Overall Development Status by Development Sectorp value Development sector Overall Development Status p value Abnormal
Normal
AbnormalGrowth Status I
- Good
- Poor
< 0.01
As
there wasno
significant relationship(p
>
0.05)between the growth status
II
and the developmentstatus (Table 12) while Table 13 reveals contrariwise
that there was a very significant relationship (p < 0.01)
between
the
growth statusI
and the developmentstatus, it was only reasonable to say that though growth
status I as well as growth status II both were reflection
of
the child's growth status, the body weight for age parameter (growth statusI)
wasin
this study more sensitive for predicting the child's development. Mor-ley and Lovel(9)
also stated the underfive's weightcurve
to
bea
very sensitive instrumentto
be usedprospectively to evaluate the child's growth and health.
Detailed analyses of the development status
In order to have more detailed information of the four
sectors or areas of function of development (to wit the
gross motor, language, fine motor-adaptive, and the personal social sector), their relationship with the
over-all development status, and the intersectoral relation-ships, a sensitization of the DDST had been made for
each sectorby raising the cut offpoint from the original DDST to become no delay (D= 0) and the existence
of
one or more delays (D > 1) in each sector.Table 14. Distribution of Development Sector by Delay in Each Sector
Sector Percentage
From Tables 14 and
l5 it
is
clear that the easiest development sector to be accomplished was the grossmotor sector, followed respectively
by
the personalsocial sector, then the language sector and the last and
so most
difficult
sectorto
be reached was the finemotor-adaptive sector.
As mentioned before (see Table 9) out of the total
of
102 underfives 37 (36.3 %)had development distur-bances. Furthermore (see Tablel6)
50.0 % of childrenhad delays in the fine motor-adaptive sector, 37.3 % in
the language sector, 29.4 %
in
the personal socialsector and 22.5 % in the gross motor sector.
Table 16.Distributionof Children by Development Delay in the Four Sectors
Sector with delay No Percentage of
studied children
Gross motor
Personal social Language
Fine motor- adaptive
As mentioned before the order of accompiishment
of
the development sectors was respectively the gross
motor, the personal social, the language and last the
fine motor-adaptive sector (Table 16). This all can be
explained as follows: The gross motor development sector (supine to prone position, creeping, crawling,
sitting, standing, walking etc.) was in its earliest stages
for a great part determined by the child's own instinct, drive or inner motivation for exploration and widening
the world around without needing the environment to
t2
25 45
20
Gross motor
-D=0
-D>1
Personal Social
-D=0
-D>0
I-anguage-D=0
-D>l
Fine motor-adaptive-D=0
-D>l
59 6 58 7 55 10 20 t7 t4 23 9 28 1 36 < 0.01 < 0.01 < 0.01 < 0.01 50 l5 No 23 30 38 51 22.5 29.4 37.3 50.0Gross motor
-D=0
-D>1
- Total
Personal social
-D=0
-D>1
- Total Language
-D=0
-D>1
- Total
Fine motor-adaptive
-D=0
-D>1
- Total
stimulate her/him specially on purpose. 13'14 Thus in
this study this sector was easiest to be accomplished.
The personal social development sector depends much
on the fulfillment of the emotional needs and affection which in very young children is easily met as they look
cute, are cuddlesome, are
for
the parentsit is
theirtaneity
to
be close and young. l3 So this developm be reached.The language development sector depends on the rich_ ness of the language and verbal communication used
to or around the child, whether or not the child is, so
as
to
say, bathedin
language (9).In
this study theproper verbal communication occurred
only in
3gchildren (38,2 %),so this sector was reached in a more
difficult order
of
accomplishment.The fine motor-adaptive development sector was the
most
difficult
to reach asit
depends on the provision of stimulation, usually on purpose, from theenviron-ment,
playth
things
lyin9
the reason why this sector was accomplished last.
To enhance the achievements in the language and fine
motor-adap
an important role inlater on
dev
es of good qualityit
is very
obvi
stimulation in thesetoo sectors a.o. provision
of
proper to age educativeplaythings and the use of abundant verbal communica_
tion, is mandatory. For this self same reason also was the Bina Keluarga Balita program (program BKB,
Underfive Family Promotion program) formed in 19g0
in Indonesia with the aim to train mothers to create a
rearing practice for their underfives where the mother_
child interaction is enhanced, their child's stimulation
enriched and where the mother/family is able to detect
early growth and development abnormalities
of
their child.This program is coordinated by the office of theMinister of
Vy'omen'sAffair
while
the operationalional Coordinating
at present widely
the country with
In this
studyit
was also revealed that the overalldevelopment status was statistically very significantly
related
to
eachof its four
developmentiectors
(p5), while the
four
development sectorsre also very significantly related (p <
ther,
A
multiple regression analysis was also performed tofind out the roles
of
the development,""tor.
in con_tor
respectively,. when the other factors were heldconstant, This finding once again supported the fact
of how important it is to enhance stimulation in the fine
ive,
lan
social personal sectorsent.
Thi
n justifies the importantthe BK
In conclusion, our data indicate the followings:
(l)
Thegrowth as well as the development states of children
under study were
all still
unsatisfactory;(2)
Thefigures
for
undernutrition and severe undernutrition were much higher than the general figuresfor
In_donesia; (3) The growth and development states were
motor, personal social, language and the most difficult
sector was the fine motor-adaptive.
REFERENCES
l.
Grant IP. The status of the world's children 1995, New york: Oxford University press, 1995; 12-342. Sularyo TS. Child health care with emphasis on childhood.
morbidity and mortality problem. presented at the XIth
Asian Me
3
uNrcEF
ij:iiiÏ;jiiî
the 1990s
4. Pechevis
M.
Determinants for optimal child growth anddevelopment. Presented at Kongres Nasional Ilmu
Kesehatan Anak V (5th National Congress of pediatrics), Medan, 1981.
5. Frankernburg WK, Dodds JB, Fandal AW et al. DDST (Denver Developmental Screening Test): Reference manual revised 1975 Edition, University of Colorado Medical
Cen-ter, 1975
6. Frankenburg WK. The Denver approach to early identifica_ tion of children at risk,
lst
Ed. plenum New york, 19g5, p135-56
7. Frankenburg WK, Dodd J, Archer p, Shapiro H. The Denver
8. Soetjiningsih. Evaluation of the child's Development' In :
IGN Gde Ranuh, Ed. Tumbuh kembang anak; 1st ed. Iakarta
: Penerbit Buku Kedokteran EGC, 1995;65-78
9. Morley D, Lovel M. My name is today; lst ed. London-Basingstoke: Mc Millan, 1986: 46-57, 84-93, 308-11 10. Leimena SL. Policy of the Ministry of Health in Promoting
the Health
of
Underfives. Presented at the Sarasehan"Perkembangan Anak Menuju Peningkatan Kualitas Hidup Manusia" Jakarta, March 26, 1990.
11. Tanner JM. Foetus into man: Physical growth from
concep-tion to maturity. London: Open Book, 1981 : 6-51.
12, Sudiyanto, Physicobiopsychosocial environmental factors influencing the child's growth and development. In: Gizi dan
tumbuh kembang. Jakarta: Bagian IKA FKUI, 1985; 56-61.
13. Pechevis M. Supervision of early childhood development
(ages 0-6) in the frame ofbasic health services, Children in
the Tropics 1914;95 :3-24.
14. Wall WD. Development of intelligence in early childhood. Children in the tropics 1973; 86: 3-11
15. Sularyo TS. Monitoring of the underfive's growth and
development with special reference to the Bina Keluarga Balita Program. In: Samsudin, Sri S Nasar, Damayanti R Syarif (Eds). Masalah gizi ganda dan tumbuh kembang anak.