VELOCITY MEASUREMENT OF FLOWING PARTICLE USING LED AND PHOTODIODE SENSOR
MOHD HANAFE BIN MOHD SANI
This report in partial fulfilment of the requirements for the award of Bachelor of Electronic Engineering (Computer Engineering) With Honours
Faculty of Electronic and Computer Engineering Universiti Teknikal Malaysia Melaka
ii
“I hereby declare that this report is the result of my own work except for the quotes as cited in the references.”
Signature :………..
iii
“I hereby declare that I have read this report and in my opinion this report is sufficient in terms of the scope and quality for the award of Bachelor of Electronic Engineering
(Computer Engineering) With Honours.”
Signature :………
iv
v
ACKNOWLEDGEMENT
First and foremost, a special thanks, appreciation and deep gratitude to my project supervisor, En Adie Bin Mohd Khafe, who has been there to provide continuous guidance, advice, encouragement, support and generous amount of time in helping me to complete this project. It has been a great pleasure and privilege to learn from someone who is professional and charisma like him.
Sincere appreciation of course goes to my friends who give me unselfish support and my family for their support and encouragement throughout in the completion of this project. Without their endless sacrifices, constant love and steadfast support, I would never have reach this level.
vi
ABSTRACT
vii
ABSTRAK
viii
LIST OF CONTENTS
CHAPTER TITLE PAGE
PAGE TITLE i
DECLARATION ii
DEDICATION iv
ACKNOWLEDGEMENT v
ABSTRACT vi
ABSTRAK vii
CONTENTS viii
LIST OF TABLES xi
LIST OF FIGURES xii
I. INTRODUCTION 1.1 Project Background 1
ix
II. LITERITURE REVIEW
2.1 Velocity 7
2.2 Relative velocity 8
2.3 Flow measurement 8
2.4 Type of flow meter 9
2.5 Sensor Type 10
2.6 Light Emitted Diode 11
2.6.1 History of LED 13
2.6.2 Physical Principle 14
2.6.3 Power Sources 15
2.6.4 Advantages of using LED 15
2.7 Photodiode 16
2.7.1 Principle of Operation 16
2.7.2 Advantages of Photodiode 17
2.8 IC TL084 18
III. METHODOLOGY
3.1 Basic Structure of Velocity Measurement Process 19
3.2 Optical sensors 21
3.3 Signal Conditional Circuit 22
3.3.1 Low Pass Filter and Voltage Converter 24
3.4 Sensor Fixtures and Jig 25
3.5 Jig Design 26
3.6 Velocity Measurement 27
x
3.7 Data Acquisition System 29
3.8 Software Development 31
3.8.1 Cross Correlation Algorithm in Visual Basic 32
IV. RESULTS AND DISCUSSIONS
4.1 Circuit Simulation 34
4.2 Circuit Prototype 36
4.3 Preliminary Result 37
4.4 Velocity Measurement 38
4.5 Data Acquisition Result 38
4.6 MS Access Database 40
4.7 Experiment of Velocity Measurement 41
4.7.1 Experiment 1 41
4.7.2 Experiment 2 43
4.7.3 Experiment 3 45
4.8 Theoretical Calculation 47
V. CONCLUSIONS AND SUGGESTIONS
5.1 Conclusions 50
5.2 Suggestions 51
REFERENCES 52
APPENDICES 53
xi
LIST OF TABLES
NO TITLE PAGE
2.1 Sensor Grouping 10
2.2 LED colour chart 12
4.1 Preliminary result 37
xii
LIST OF FIGURES
NO TITLE PAGE
1.0 Model of basic operation 2
1.1 Block diagram of project methodology 5
2.1 Magnetic flow meter 8
2.2 Turbine flow meter 9
2.3 Type of LED 12
2.4 Relative Intensity versus wavelength 12
2.5 The Inner working of LED 14
2.6 Relative spectral sensitivity of SFH203 17
2.7 TL084 layout diagram 18
3.1 Diagram of velocity measuring process 20
3.2 Complete hardware installation 20
3.3 LED transmitter circuit 21
3.4 Signal conditional circuit 22
3.5 Signal conditional circuits on PCB 23
xiii
3.7 Low Pass Filter 24
3.8 Current to voltage converter 25
3.9 Position of transmitter and receiver 25
3.10 Diagram of jig design 26
3.11 Complete sensor installation 26
3.12 Concept of cross correlation technique 27
3.13 Data acquisition system block diagram 29
3.14 Wiring figure to DAS figure 30
3.15 Flowchart for Velocity Measurement 31
3.16 Visual Basic main window 33
3.17 Visual Basic measurement window 33
4.1 Initial Condition of the circuit 35
4.2 Output at low pass filter stage 35
4.3 Output after passing the two stage of amplifier 36
4.4 LED emit light to the photodiode 36
4.5 No object present at sensing area 37
4.6 Object present at sensing area 37
4.7 Chart viewer show the voltage drop (upstream) 38
4.8 Chart viewer show the voltage drop (downstream) 39
4.9 Example of MS Access show the voltage drop 40
xiv
4.11 Data scattered from sensor 12 & 4 42
4.12 Velocity measurement at a distance of 30mm 42
4.13 Sensors arrangement for experiment 2 43
4.14 Data scattered from sensor 13 & 5 44
4.15 Velocity measurement at a distance of 90mm 44
4.16 Sensors arrangement for experiment 3 45
4.17 Data scattered from sensor 14 & 6 46
CHAPTER I
INTRODUCTION
This chapter will discuss the overview of project background, scope of project, problems statement, the aims and specific objectives of the project. The end of this chapter will list the thesis outline.
1.1 Project Background
2
[image:17.595.154.510.284.571.2]a pipeline that produces random disturbance signal. Two pairs of sensors positioned upstream and downstream, installed in an axial distance (L) with each other in parallel beam projection. The transmit time (τ) taken from the time the particle moving from the upstream to downstream. The velocity measurement obtained by dividing the time and the distance between upstream and downstream.
Figure 1.0 Model of Basic Operation L
Particle Drop
3
1.2 Project Objectives
The aim of this project is to obtain the velocity measurement when solid particle dropped from upstream to downstream through the sensing area of pipe. That will allow us to observed and control the velocity of the particle movement. The specific objectives are to:
1. Evaluate the LED sensor and design & fabricate circuit to be used to implement in this measurement system.
2. Implement a measurement system that will provide data obtained from sensor for velocity measurement in pipeline.
3. Understand how cross correlation method can be implemented in velocity measurement of flowing particle.
4. Focus on software development using Visual Basic to determine the velocity.
1.3 Problem statement
In industry that involved conveyer pipe, the current technology use for measuring velocity is divided into several methods. The methods are:
• Mechanical flow meter • Turbine flow meter
4
The objective of this project is to overcome those disadvantages that exist in the system that had been used currently in the industry. In other word, it is hope that this project research will come out a good solution and more practical be used in the real world situation.
1.4 Scope of Project
This project is divided into two stages, which are: Stage 1: Hardware Development
Firstly, literature study on the velocity measurement technique of moving particle using optical sensor are revised. Investigate the compatible pipe, projection of transmitter and receiver. Then, the selection of transmitter and receiver of the sensor, and also the design of sensors fixture are made. After that, the signal conditioning circuit with an appropriate gain and applying suitable signal processing techniques are designed and tested. The jig or particle models suitable for the measurement testing were fabricated. Finally, the velocity of the moving particles in the pipeline in terms of dc voltage was measured.
Stage 2: Software development and Interfacing to the data acquisition system
At this stage, the utilization of DAS card in data collection is studied, so that it can collect the data from the signal conditional circuit. The data captured was stored into the database system on the Microsoft Access. Then, the graphical user interface (GUI) was developed by using the Microsoft Visual Basic 6.0. This software will performed the cross correlation method, process from the database and at the same time display the result in graphical form.
1.5 Project Methodology
5
Figure 1.1 Block diagram of project methodology Planning
In this planning section, it will focus on project title discussion. Project method & approach also will be determined.
Literature review
In Literature review section, it covers several topics of study:- • Study on sensor (LED & Photodiode sensor).
• Study about parallel beam projection. • Familiarize with cross correlation method. • Understand the conveying pipe process system. Circuit prototype and jig design
In this section, the signal conditional circuit is designed. Sensor fixture and jig design is determined.
Software part and data collection
Microsoft Access will be use to store the collected data into database. By applying cross correlation method, the velocity will be measure and the result will be display by using Visual Basic software.
Planning Literature
Review
Circuit prototype and jig design
Software part and
data collection Velocity
CHAPTER II
LITERITURE REVIEW
This chapter will review the literature regarding on the velocity measurement and flow meter theories. At the end of this chapter, the optical sensor theories, light emitted diode, photodiode and sensor arrangement are discussed.
2.1 Velocity
Velocity is defined as the rate of change of position. It can be measure indirectly by either integrating an acceleration measurement or differentiating a dynamic position measurement. It is measured in meters per second: (m/s) or ms-1 in the SI (metric) system [1]. The scalar absolute value (magnitude) of velocity is speed. The average velocity v of an object moving through a displacement ( x) during a time interval ( t) is described by the formula:
7
2.2 Relative velocity
Relative velocity is a measurement of velocity between two objects as determined in a single coordinate system. Relative velocity is fundamental in both classical and modern physics, since many systems in physics deal with the relative motion of two or more particles. In Newtonian mechanics, the relative velocity is independent of the chosen inertial reference frame. This is not the case anymore with special relativity in which velocities depend on the choice of reference frame.
If an object A is moving with velocity vector v and an object B with velocity vector w, then the velocity of object A relative to object B is defined as the difference of the two velocity vectors:
...(2.2) Similarly the relative velocity of object B moving with velocity w, relative to object A moving with velocity v is:
...(2.3) Usually the inertial frame is chosen in which the latter of the two mentioned objects is in rest.
2.3 Flow measurement
Flow measurement is the quantification of bulk fluid movement. Two types of flow measurement are:
Point Velocity measurement: for investigation purpose, limited use in industrial
environment.
Quantum flow instrumentation: can be in terms of flow rate, average velocity,
8
2.4 Type of flow meter
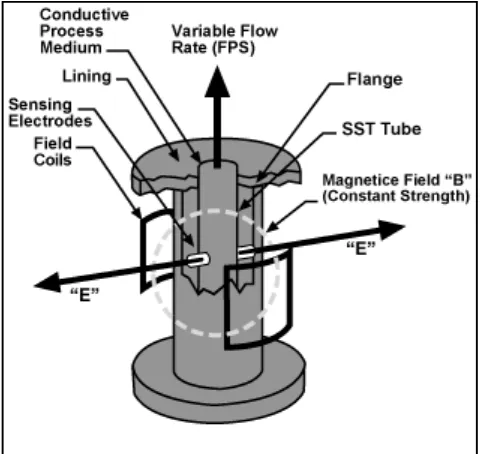
Magnetic Flow meter
[image:23.595.210.450.328.555.2]A magnetic flow meter is a volumetric flow meter which does not have any moving parts and is ideal for wastewater applications or any dirty liquid which is conductive. Magnetic flowmeters will generally not work with hydrocarbons, distilled water and many non-aqueous solutions. Magnetic flowmeters are also ideal for applications where low pressure drop and low maintenance are required.
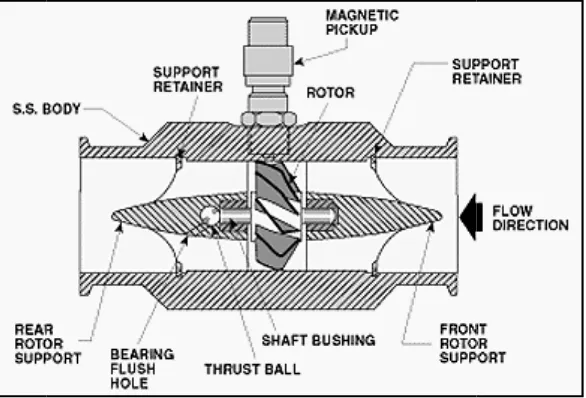
Figure 2.1 Magnetic flow meter Turbine Flow meter
The turbine w impinges on the turbine rotor in motion. Whe proportional to fluid ve Optical Flow meter
[image:24.595.192.485.141.340.2]Optical flow m accompany natural and pipe by illuminating opt The detecting optics c pulse signal. If the sam scattered light on a s second electrical puls environments which high humidity, pipe vi
Figure 2.2 Turbine flow meter wheel is set in the path of a fluid stream. urbine blades, imparting a force to the blade surf
hen a steady rotation speed has been reac d velocity.
meters use light to determine flow rate. Sm and industrial gases pass through two laser be ng optics. Light is scattered when a particle cros
s collects scattered light on a photodiode, whic same particle crosses the second beam, the dete a second photodiode, which converts the incom pulse. It deliver highly accurate flow data, eve
h may include high temperature, low flow ra vibration and acoustic noise.
9
. The flowing fluid urface and setting the eached, the speed is