A Comparative Analysis of Supplier Performance Measures for
Malaysian Aero Composite Manufacturing Companies:
Case Study
Wan Hasrulnizzam Wan Mahmood
a, b aFaculty of Manufacturing Engineering, Universiti Teknikal Malaysia Melaka, Malaysia
[email protected], [email protected]
Dr. Mohd Nizam Ab Rahman
bFaculty of Engineering & Built Environment, Universiti Kebangsaan Malaysia
Dr. Baba Md Deros
Faculty of Engineering & Built Environment, Universiti Kebangsaan Malaysia
ABSTRACT
The aim of this paper is to study how aero composite manufacturing companies in Malaysia do performance measures. The paper outlines the method of maintaining the approved suppliers and their continuous compliance to the requirement and to ensure that only approved supplier in the approval supplier list are referred to for purchasing of product manufacturing related activities. This paper provides a rational and comparative approach for findings solutions to eliminate the cause(s) of non-conformities in order to prevent recurrence or potential non-conformities in product, process, and quality system of suppliers. This is a qualitative case study, which, therefore, limits its generalisability. However, its contextualization enables insight to be applied to the wider manufacturing environment.
Keywords: Aero composite manufacturing, Supplier performance measure Innovation
1.0
Introduction
Competitiveness has enhanced organizations business efforts to increase overall operational performance. Some of them show extremely excellent result while most of them are suffered to improve the business growth with poor result in supply chain management (SCM). SCM is the oversight of materials, information, and finances as they move in a process from supplier to manufacturer to wholesaler to retailer to consumer. SCM seeks to synchronize an organization’s functions and those of its suppliers to match the flow of materials, services, and information with the customer demand (Krajewski and Ritzman, 1999). SCM involves coordinating and integrating these flows both within and among organizations. It is said that the ultimate goal of any effective SCM system is to reduce inventory (with the assumption that products are available when needed). In short, this definition is fairly complete as it indicates that it is not only the flow of goods that is important, but the flow of information and money as well (Nahmias, 2001). Most manufacturing enterprises are organized as networks of manufacturing and distribution sites that procure raw materials, transform them into intermediate and finished products, and distribute the finished products to customers (Lee et al., 2001).
In the literatures it is widely accepted that a prerequisite for a successful implementation of the corporate, business and operations strategies of an organisation and for any improvement initiative, is the use of a reliable performance measurement system (Giannakis 2007). Being such a fundamental issue of SCM, supplier performance measurement has been one of the main concerns for managers and academics. Some of the performance measurement systems were designed within the academic discipline of accounting since the main strategies of organisations for many decades was price competition and cost reduction (Hayes et al., 1988). In the early 1990s performance measurement models started emphasising the link between internal (operations) and external (operations) performance (Slack, 1991), in terms of general operational dimensions as cost, speed, quality, dependability and flexibility which customers could value. The “customer perspective” in performance measurement for example which is reflected in the marketing and relationship marketing literatures has been adopted in the operations management and service management literatures (Schonberger and Knod, 1994), with the realisation that the service provided to customers can be used to improve operations performance (Fink et al., 2007). Slack et al., (2004) suggests that performance should be always measured against benchmarks and could be historical standards, target performance standards, competitor performance standards, and absolute performance standards.
The paper is then to close up what have been done by Malaysian aero composite manufacturing organizations in order to manage approved supplier as well as strategic business partner. In the next section, research method is explained. After that, the authors describe the result obtained from the research with some discussion on the outcome before conclusion of the result.
2.0
Research Methodology
An in-depth case study was conducted in January 2011. Two major aerospace composite manufacturing companies in Malaysia were selected. The research methodology comprises semi-structured interviews for the top management, focused group discussions with several shop floor leaders in the plant and direct observation of the plant in operation to collect the primary data. In addition, the interviews that are conducted not only deal on the past implementation, but also focus on future plans and development of the company. Secondary data is obtained from company documentations including quality manual, standard operation procedure, and etc.
3.0
Findings & Discussions
3.1 Company Profile
Company A is a Joint Venture (JV) Company based in Bukit Kayu Hitam, Kedah, Malaysia, owned equally by The Boeing Company and Hexcel Corporation. The business of the JV is the manufacturer of flat and contoured primary (Aileron Skins, Spoilers & Spars) and secondary (Flat Panels, Leading Edges, Trailing Edges & MISC: Components) structure composite bond assemblies and sub-assemblies for aerospace industries.
Company B was incorporated on 16 August 1994, focusing on the manufacturing of composites components for both aerospace and non-aerospace segments, and equipped with state-of-the-art equipments and machineries situated in Composites Technology City in Batu Berendam, Melaka, Malaysia. The main customers are Spirit AeroSystems, Goodrich Aerostructures, Airbus UK, EADS CASA, SONACA SA, EADS MAS, GKN Aerospace Services and BAE Systems Land System. As Malaysian inspiration, the company is set to bring the local aerospace industry to a greater height amidst the stiff competition in the global aerospace industry.
3.2 Supplier Performance Measure
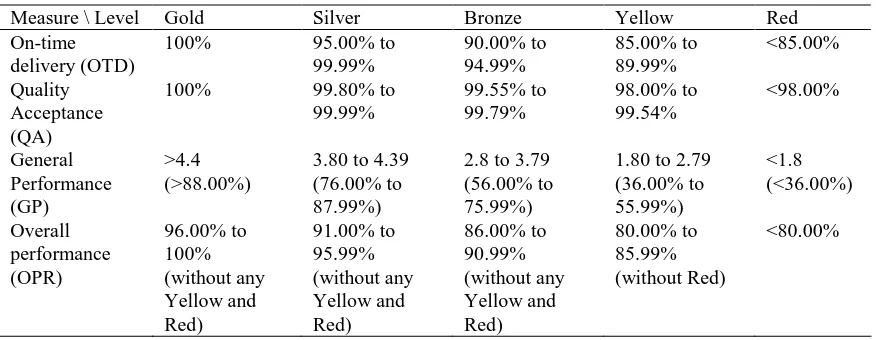
There are 3 main elements (percentage of incoming rejection, percentage of on-time delivery, general performance) that will be measured in the supplier quality and delivery rating system.
There are five colour threshold standards for overall rating as follows (see Table 1 for details);
1. Gold : exceptional supplier performance, clearly exceeding expectations no Yellow and Red rating in any of threshold standards and zero impact to production schedule and costing;
2. Silver : very supplier performance, meeting or exceeding expectations with no Yellow and Red rating in any of threshold standards and zero impact to production schedule and costing;
3. Bronze : Satisfactory supplier performance, meeting expectations with no Yellow and Red rating in any of threshold standards and zero impact to production schedule and costing;
4. Yellow : improvement needed in supplier performance to meet expectations, with no Yellow and Red rating in any of threshold standards and zero impact to production schedule and costing;
5. Red : Unsatisfactory supplier performance, clearly failing to meet expectations.
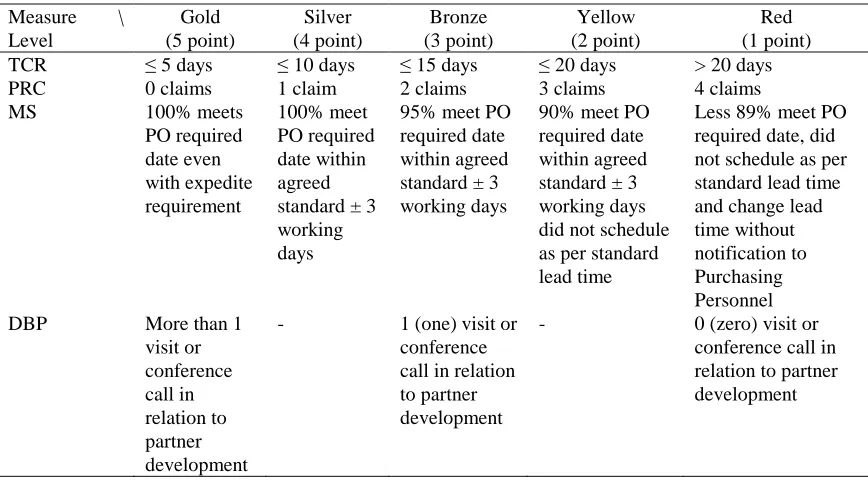
Table 1: Rating System (A) delivery percentage based on Purchase Order (PO) delivered on time over evaluation period. There are four elements that will be measured under the General Performance (GP). The score for GP is the average of the 4 elements. The elements are included timely communication and responsiveness (TCR), percentage of part rejection claim from production (PRC), management scheduling (MS), and development as business partner (DBP).
Table 2: GP Rating System honeycomb, metallic/ subcontracted parts, tooling etc.), off the shelf supplier (such as prepreg, chemical, indirect materials, AGS, gas, packaging etc.), and services suppliers (such as forwarder, testing, etc.). Supplier performance measure and rating summary and/or report is a vehicle to provide performance and rating to supplier. The summary and/or report will be issues to supplier every 1st half and 2nd half of the year. SCAR will be issued together with summary and/or report if required. Quality performance, delivery, cost of quality and service are the main element that will be measured in the supplier performance rating system. Rating scale 1 to 4 where 4 represent excellent performance, 3 for good, 2 for average and 1 for fair.
Quality performance is based on lot acceptance rate (LAR) and written report. LAR is calculated on the basis of the total amount of goods inspected in a given fiscal month. This calculation is then normalized to reflect a constant basis of the one hundred units received. Meanwhile, the written report category system rates supplier on the number of non-conformance report (NCR) issued and NCR includes Goods Discrepancy Report (GDR), Service Discrepancy Report (SDR) and SCAR. Suppliers rating for written report criteria shall be re-calculate every January to extract out any NCR raised that is decided later close as non issue or cancel after rating calculation. This is to ensure the accuracy of the supplier performance.
Delivery performance is calculated based on shipment by suppliers. Number of incident is measure as performance measure for delivery assurance with their respective score as shown in the Table 3. Incident has to be captured in service discrepancy report for record and monitoring purposes. However, when it is under supplier’s responsibility, the following criteria will be referred.
1. Late delivery : exceed agreed timeframe 2. Early deliveries : earlier than agreed timeframe
3. Over shipment of the quantity ordered : supplier supply over quantity from ordering. 4. Short shipment of the quantity ordered : supplier supply short quantity from ordering.
5. Incomplete documentation : incomplete documentation and impact to delivery activities (such as invoice, pick list, etc.).
Cost of quality is determined on the basis of the following criteria:
1. Scrap, rework, sorting and processing costs due to poor quality from supplier 2. Inventory and storage costs due to inspection failure during incoming. 3. Production shutdown attributed to poor quality from supplier
The service category is determined on the basis on time and accurate response to quality issues through NCR, external document distribution, PO acceptance and performance report. For forwarder and testing supplier, there will be addition on email response.
Table 3: Rating System (B)
Measure \ Level Excellent (4 point)
Good (3 point)
Average (2 point)
Fair (1 point)
LAR 100% 99.00% to
99.99%
98.00% to 98.99%
0% to 97.99%
NCR 0 (Zero) 1 to 5 6 to 10 > 10
Delivery (incident)
0 (Zero) 1 2 > 2
Cost of quality (incident)
0 (Zero) 1 to 2 3 to 4 > 4
Service 0 (Zero) 1 to 2 3 to 4 > 4
3.3 Action
Action is referred to the special programme that developed to enhance suppliers’ performance as mentioned in standard operation procedures. Besides, the action is crucial part for both companies in supplier performance measure. The following explain the action taken by both companies in order to enhance supplier performance and capabilities.
Firstly, Company A will email the supplier rating performance (result) to supplier quarterly. The supplier rated as Yellow or Red are required to provide an improvement plan. Supplier must meet company expectations by showing progress to the improvement plan. Plan will be monitored by Company A’s quality personnel. Besides, quality personnel are responsible to approve, coordinate and monitor the quality of the product received. In addition, they required to conduct overall supplier performance rating and display the supplier rating on company’s document control website. The delivery of the product, services and support will be monitored by purchasing and store personnel. Purchasing personnel shall review AVL (approved vendor list) and supplier performance records in document control as maintained by quality personnel prior to sending supplier a PO.
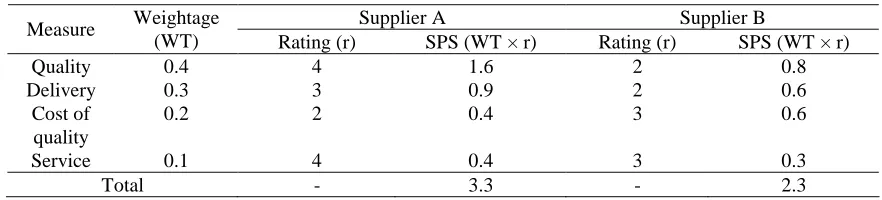
Meanwhile, Table 4 shows an example on how supplier performance is being calculated in Company B. Based on Table 4, if the supplier performance score (SPS) is above than 2.5 (> 2.5), the supplier is considered well performed and acceptable while SPS below than 2.5 (< 2.5) indicates poor performance and not acceptable. For supplier that under performed, SCAR will be issued and concerned suppliers need to submit improvement/ recovery plan. Suppliers also must deploy Continuous Improvement policy by maintaining and improving their performance. If suppliers still don’t perform well after improvement plan, propose for onsite audit. If the audit result is not satisfying, termination of supplier will be proposed top management or respected customer. In case of major deterioration of supplier performance, quality personnel shall inform the respected customer (including follow up of order, delivery, missing part, shortage, etc.). These requirements are also applicable to service subcontractors such as transportation companies.
Table 4: SPS Rating System
Supplier A Supplier B
Measure Weightage
(WT) Rating (r) SPS (WT × r) Rating (r) SPS (WT × r)
Quality 0.4 4 1.6 2 0.8
Delivery 0.3 3 0.9 2 0.6
Cost of quality
0.2 2 0.4 3 0.6
Service 0.1 4 0.4 3 0.3
4.0
Conclusion
The research has found that, quality and on-time delivery were considered compulsory element for both companies as supplier performance measures. Although, general performances such as services and etc. were contributed some pieces of overall performance rating. The companies require very excellent result of supplies from suppliers as per requested from their customers. This is because; the aerospace industry is very particular in quality of product while, on-time delivery is major concerned for lean practitioners companies which most preferred in any industries in the world. Reputation of suppliers for the both companies is needed to ensure the momentum of supplies and the survival of the industry. The companies have authority to terminate the suppliers that having bad reputation. However, both companies are not able to decide the supplier when the customers have their preferred supplier for main component of product. The authors believe that the research results may prove useful in helping manufacturing firms to develop an effective approach in supplier performance measure.
Acknowledgement
This research was co-funded by the Ministry of Higher Education Malaysia (MOHE) with partially Universiti Teknikal Malaysia Melaka (UTeM) and Universiti Kebangsaan Malaysia (UKM) under the program “Skim Latihan Akademik IPTA (SLAI)”.
References
Fink, R. C., Edelman, L. F., & Hatten, K. F. (2007). Supplier performance improvements in relational exchanges. Journal of Business & Industrial Marketing, 22 (1), 29-40
Giannakis, M. (2007), “Performance measurement of suppliers relationships, Supply Chain Management: An International Journal, Vol. 12/6, pp. 400–411.
Hayes, R., Wheelwright, S. &Clark, G. (1988), Dynamic Manufacturing: Creating the Learning Organization, The Free Press, New York, NY.
Krajewski, L. J. &Ritzman L. P., (1999). Operation Management Strategy and Analysis: Fifth Edition, United States of America, Addison Wesley Publishing.
Lee E. K., Ha S. & Kim S. K. (2001). Supplier Selection and Management System Considering Relationships in Supply Chain Management, IEEE Transactions on Engineering Management, Vol. 48 No. 3, pp. 307-318.
Matook, S., Lasch, R., & Tamaschke, R., (2009). Supplier Development With Benchmarking As Part Of A Comprehensive Supplier Risk Management Framework, International Journal of Operations and Production Management, Vol. 29, No. 3, pp. 241-267.
Nahmias S., (2001). Production and Operations Analysis: Fourth Edition. New York, McGraw-Hill Companies.
Schonberger, R.J. & Knod, E.M. (1994). Operations Management: Continuous Improvement, Irwin, Chicago, IL.
Slack, N. (1991). The Manufacturing Advantage, Mercury Books, London.
Slack, N., Chambers, S. and Johnston, R. (2004). Operations Management, 4th edition., Pearson Education, London.
Svensson G. (2004), “Supplier Segmentation in The Automotive Industry : A Dyadic Approach of a Managerial Model”, International Journal of Physical Distribution & Logistics Management, Vol. 34 No.1, pp.12-38.
Authors’ Background
Mr. Wan Hasrulnizzam Wan Mahmood is currently a postgraduate student at Mechanical and Materials Engineering, Universiti Kebangsaan Malaysia (UKM). He works as a lecturer at Faculty of Manufacturing Engineering, Universiti Teknikal Malaysia Melaka (UTeM). He also has extensive consultancy experience in empowering lean manufacturing practices. His research interests are maintenance management, supply chain management, lean manufacturing, operational research, quality and reliability.
Dr. Mohd Nizam Ab Rahman is an Associate Professor in Quality and Operations Management at the Department of Mechanical and Materials Engineering, UKM. His research interests include quality operations, modern quality management such as supply chain, BSC, Six sigma, Production SPC etc. He graduated in Industrial Physics in 1996, MSc in 1999 from Universiti Teknologi Malaysia and obtains his PhD in 2005 from University of Nottingham, United Kingdom. He has been working as an R&D Engineer with Panasonic AVC Networks, and has worked in Japan for a couple of years.