Supplementary Information
Brown and polar bear Y chromosomes reveal extensive male-biased gene
flow within brother lineages
Tobias Bidon*, Axel Janke, Steven R. Fain, Hans Geir Eiken, Snorre B. Hagen, Urmas
Saarma, Björn M. Hallström, Nicolas Lecomte, Frank Hailer*
* Corresponding authors: Tobias Bidon & Frank Hailer. Biodiversity and Climate Research
Centre (BiK-F), Senckenberg Gesellschaft für Naturforschung, Senckenberganlage 25, 60325
Frankfurt am Main, Germany. Fax: +49 6975421800; E-mails: [email protected];
Supplementary information includes
Analysis of fast evolving male-specific microsatellites ... 2
Combination of sequence data and microsatellites ... 3
Population differentiation in brown and polar bears ... 4
American black bear phylogeography ... 5
Details of laboratory methods: PCR conditions, sequencing, and fragment analysis ... 6
Details of sampling and DNA extraction ... 7
Details for divergence time estimation ... 8
Figure S1. Statistical parsimony networks of Y chromosome haplotypes in bears. ... 10
Figure S2. Allele size distribution histograms of six Y-linked microsatellite markers. ... 11
Figure S3. Median joining networks (Bandelt et al. 1999) of weighted Y haplotypes within species, inferred from the combination of 3.1 kb sequence data and six microsatellite markers. ... 12
Figure S4. Statistical parsimony network of American black bear haplotypes. ... 13
Table S1 List of individuals, their particular haplotypes, and source populations. ... 14
Table S2. Divergence time estimates of Y chromosome lineages in bears, obtained from different Beast runs. ... 19
Table S3. Localities and accession numbers of bears used in the scaffold-wide analyses... 19
Table S4. Pairwise ΦST-values among brown bear populations. ... 20
Table S5. Pairwise ΦST-values among polar bear populations. ... 20
Table S6. Segregating sites of Y-chromosome haplotypes in the 3.1 kb (A) and 5.3 kb (B) datasets. ... 21
Table S7 Primer sequences, annealing temperatures and fragment sizes of Y-chromosomal sequence fragments. ... 22
Table S8. Primer sequences, annealing temperature, and fragment size of small, overlapping Y-chromosomal sequence markers used to amplify DNA from lower-quality samples. ... 23
Table S9. Primer sequences, fluorescent dyes, and repeat unit of Y-chromosomal microsatellite markers. ... 24
Analysis of fast evolving male-specific microsatellites
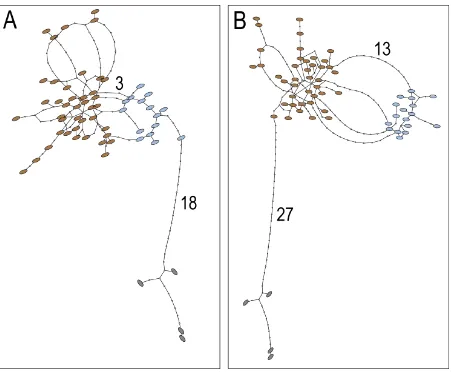
Microsatellite haplotype networks (fig. S1A) showed the three species (brown, polar and
black bears) separated from each other, but with only few mutational differences between
brown and polar bears compared to their intraspecific variability. However, as expected from
the higher mutation rate of microsatellite markers compared to point mutations (Ellegren
2004), compound haplotypes of the Y-linked microsatellites provided greatly increased
intraspecific resolution in comparison to the sequence data (fig. 2A). Combining the
microsatellite results with the sequence data from the 3.1 kb dataset (solid lines in fig. 2A; the
5.3 kb dataset includes only a subset of individuals) yielded a phylogenetic network not only
with high power to differentiate among species, but also with large intraspecific resolution
due to the microsatellite allele size polymorphism data (fig. S1B). The sequence data
therefore served as a backbone to infer phylogenetic relationships, and the addition of more
rapidly mutating microsatellite markers yielded power to resolve intraspecific structuring
(Brown et al. 2011; Sacks et al. 2013).
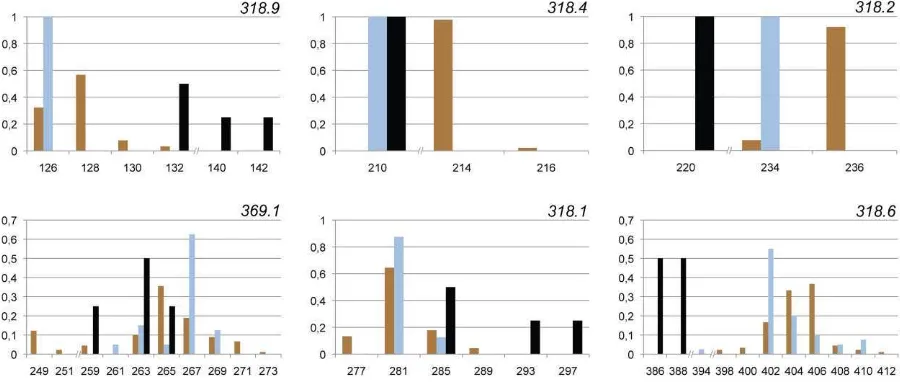
All samples were genotyped at six Y-linked microsatellite markers. Of these, 318.9
was monomorphic in polar bears, and 318.4 and 318.2 were monomorphic in both polar and
black bears (fig. S2). No marker was monomorphic in brown bears. Generally, the allele size
ranges of brown and polar bears overlapped (318.9, 369.1, 318.1, and 318.6) and brown bears
showed more alleles per marker (range: 2-9) than polar bears (range: 1-6). Differences in
allele sizes between brown and polar bears were fixed only at 318.4, rendering this marker
useful for screening purposes aiming at the discrimination between Y chromosomes of the
two species. Brown bears had unique alleles that were absent from polar and black bears at
marker 318.4, and black bears had unique alleles at 318.2 and 318.6. Despite the small sample
size, black bears exhibited a large allelic variation, e.g., four black bear males had a higher
bears carried alleles that were separated from brown/polar bears by substantial allele size
differences at several markers. Interestingly, 13 brown bears from Eastern Asia (Kamchatka)
carried divergent alleles at 369.1 (fig. 3). Sequencing of one individual from each species for
the markers (318.9, 318.2, 369.1, 318.1, 318.6), plus two additional brown bears for marker
369.1, confirmed that the substantial allele size variation indeed arose from repeat number
polymorphism within the microsatellite region and not from insertions/deletions in the
flanking regions.
Combination of sequence data and microsatellites
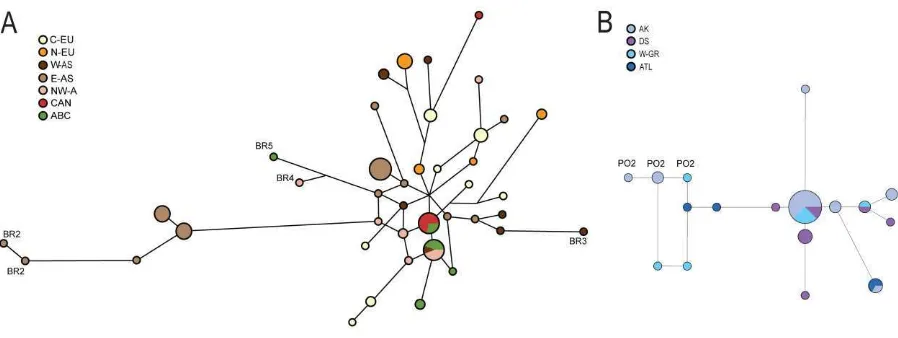
Combining Y chromosome sequences of the 3.1 kb dataset with microsatellite data provided
discrimination of 41 haplotypes in 90 brown bear individuals, and 17 haplotypes in 40 polar
bears (figs. 3A and B).
Two haplotypes were shared by brown bears from different populations (ABC-islands
and Canada; northwest America, ABC-islands and western Asia). All other haplotypes were
exclusively shared with individuals from the same population. The overall high haplotypic
variability allows detection of several geographical groupings in the network, but branches
between these groups are short. Major conclusions drawn from these unweighted networks
were not affected by weighting the six microsatellite markers inversely to their variance and,
additionally, weighting sequence markers differentially (10 times the highest microsatellite
weight) than microsatellites (Brown et al. 2011; Sacks et al. 2013) (fig. S3). The clustering of
North and Central European haplotypes as well as the clustering of East Asian (Kamchatkan)
brown bear haplotypes near the Northwest American haplotypes was more pronounced when
markers were weighted (figs. 3A and S3A), as expected given likely dispersal across the
As shown in fig. 3B,of 17 polar bear haplotypes, one was found in 15 individuals (38%) from
regions as far apart as Alaska, western Greenland and Davis Strait. All surveyed populations
contained at least three different haplotypes. No different conclusions were reached when a
weighting scheme was applied to the markers (fig. S3B), although the compound haplotypes
based on PO2 now clustered next to each other.
Population differentiation in brown and polar bears
Estimation of population differentiation within brown and polar bears (Weir and Cockerham
1984)(ΦST) was calculated in Arlequin 3.5 (Excoffier and Lischer 2010) based on a distance
matrix from combination of six microsatellites and seven sequence fragments (same as for the
networks in fig. 3, figs. S1B, S4). In brown bears ΦST–values ranged from 0.02 to 0.38 (table
S4), indicating low to moderate population differentiation. We found a stronger
differentiation between populations with larger geographic separation (fig. 1), e.g. Northern
Europe compared to Eastern Asia or Canada and less differentiation between populations that
are spatially closer, e.g. NW-America and Canada. Non-significant and low values were only
obtained for population pairs that are geographic neighbors (fig. 3), e.g. NW-America and the
ABC-Islands. The proportion of variation among all brown bear populations was 0.28, as
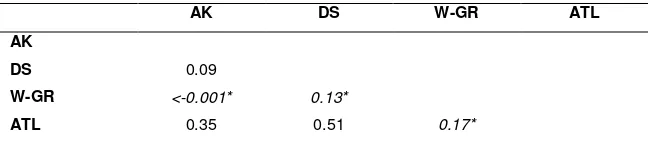
estimated by analysis of molecular variance (AMOVA) in Arlequin. In polar bears ΦST
-values ranged from <-0.001 to 0.51 (table S5), with three out of six comparisons being
non-significant. The proportion of variation among all polar bear populations was 0.16. We note
the low number of samples for some polar bear populations, rendering the obtained
American black bear phylogeography
In American black bears, two distinct mtDNA lineages have been described: a coastal lineage
that is restricted to a zone along the North American Pacific coast, and a second, more
widespread continental lineage that occurs from north and east of the Rocky Mountains to
Florida (Wooding and Ward 1997; Stone and Cook 2000). In the Y-chromosomal 5.3 kb
dataset (fig. 2A), the four male black bears showed two haplotypes, separated by two
mutations. Nucleotide diversity (π ±S.D.) was higher in black bears (0.00025±0.00008; n=4)
compared to brown (0.00007±0.00002; n=44) and polar bears (0.00003±0.00002; n=15).
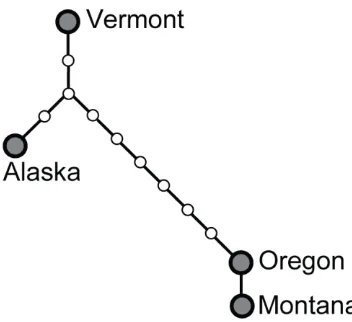
Combined Y-chromosomal data from sequences and microsatellites also showed two distinct
lineages (fig. S4), a pattern that resembles findings from mtDNA. However, discordance
between maternal and paternal lineages occurred in a black bear individual from Montana:
while its mitochondrial haplotype clustered with two other black bear individuals (Vermont
and C122), potentially representing a continental lineage, its Y-chromosomal haplotype
clustered with the individual from Oregon (which had a distinct mitochondrial haplotype
representing a coastal lineage (Wooding and Ward 1997)). Sex-biased introgression among
lineages may explain this pattern (Roca et al. 2005; Hailer and Leonard 2008). We note,
however, that many more than four individuals are needed to investigate the phylogeography
of black bears - we report these findings to demonstrate that our newly developed markers can
Details of laboratory methods: PCR conditions, sequencing, and fragment analysis
Touchdown polymerase chain reactions (PCRs) were performed to amplify all sequence
markers in 15 µl reaction volumes containing 2x Taq DNA Polymerase mix (VWR
International GmbH, BDH Prolabo, Darmstadt, Germany), 0.17 µg/µ l BSA (New England
Biolabs, Ipswich, MA, USA), 0.27 µM each of forward and reverse primers, and 10-15 ng
template DNA. Re-runs of individual failed PCRs were conducted with GoTaq Flexi DNA
Polymerase (Promega, Madison, WI, USA), using 3.2 mM MgCl2 (Promega) and 10-100 ng
of DNA template in a 20 µl volume. The amplification protocol started with 95°C for 3 min
followed by 10 cycles at 94°C for 30 s, a touchdown step starting at 69°C, 68°C, or 66°C
(marker-specific, see table S7) for 25 s, and 72°C for 75 s. This was followed by 25 cycles of
94°C for 30 s, 64°C, 58°C, or 61°C (table S7) for 25 s, and 72°C for 75 s. A final elongation
step of 10 min at 72°C followed. Each PCR setup contained no-template and female controls.
For samples with low DNA quality, amplicons were subdivided into smaller, overlapping
fragments (each 334-465 bp long; table S8). PCR products were checked on agarose gels and
sequenced in both directions with the BigDye Terminator v3.1 chemistry on an ABI 3730
(Applied Biosystems, Life Technologies GmbH, Darmstadt, Germany). Sequences were
aligned and edited in Geneious 5.6.2 (Biomatters, Auckland, New Zealand).
Insertions/deletions longer than one bp were shortened to one bp in the alignments and
regarded as a single mutational step in downstream network analyses. Two of the PCR
fragments (318.2C and 318.7C) overlap by 142 bp and were trimmed accordingly in order to
remove doubly represented sequence in the alignments.
Nine Y-linked microsatellite markers were combined in two multiplex PCRs (table
S9). Forward primers were labeled with fluorescent dyes PET, 6-FAM, VIC, or NED
(Applied Biosystems, Life Technologies GmbH) and mixed with unlabeled forward primers
(Qiagen, Hilden, Germany), 0.05 µg/µl BSA (New England Biolabs), and 10-15 ng of
template DNA. Primer concentrations are listed in table S9. Amplification started at 95°C for
3 min followed by 20 touchdown cycles of 94°C for 30 s, 68°C (decreasing by 0.5°C per
cycle) for 25 s, and 72°C for 75 s. Another 20 standard PCR cycles followed at 94°C for 30 s,
58°C for 25 s, and 72°C for 75 s, completed by a final elongation step at 72°C for 10 min.
PCR products were subjected to fragment analysis on an ABI 3730 (Applied Biosystems, Life
Technologies GmbH) instrument using the 500(-250) LIZ size standard. Negative controls
(no-template controls and DNA from females) were included. Allele sizes were determined
using Genemapper 4.0 (Applied Biosystems, Life Technologies GmbH).
Details of sampling and DNA extraction
Brown bear samples originated from Central and Northern Europe, several regions throughout
Asia as well as North America including the Alaskan Admiralty, Baranof and Chichagof
(ABC) Islands and two individuals from the adjacent mainland. Polar bears from Iceland,
Franz Josef Land (Arctic Ocean, north of Siberia), Alaska, Baffin Bay, Davis Strait, and Kane
Basin were included. Black bears were sampled from the Pacific northwest (Oregon), central
Rocky Mountains (Montana), and northeastern USA (Vermont). A fourth black bear
individual came from a zoo in Alaska with uncertain geographic origin. After extraction,
nucleic acid concentration was determined on a NanoPhotometer instrument (Implen,
München, Germany).
Sequences from a 642 bp fragment of the mitochondrial control region, amplified and
sequenced as in Hailer et al. (2012), confirmed that our samples represent major matrilineal
(mtDNA) lineages of brown and polar bears (Davison et al. 2011) (clades 1, 2A, 2B, 3A, 3B,
and 4; fig. 2C; EMBL accession numbers for newly obtained mitochondrial sequences
covers the major Eurasian and North American lineages of brown bears, and no mismatches
occurred between clade assignment and geographic/taxonomic origin.
Six brown bears from central Europe formed clade 1, 11 individuals from the
ABC-islands represented clade 2A. 59 bears from central and northern Europe, western and eastern
Asia and northwestern America belonged to clade 3A. Clade 3B was represented by five
individuals from northwestern America (including two individuals from the mainland
adjacent to the ABC-islands) and all eight bears from Canada. One individual from Idaho
represented clade 4. All 40 polar bears belonged to clade 2B, nested within the variation of
brown bears. The four black bears clustered outside the brown/polar bear variation.
Individuals from Montana and Vermont (as well as the individual with uncertain geographic
origin) clustered together, while the individual from Oregon was more distantly related.
Details for divergence time estimation
Sequence data from a male spectacled bear was included as an outgroup in the divergence
time estimation in Beast v1.7.4 (Drummond et al. 2012). The alignment contained 5,197 bp of
concatenated Y-chromosomal sequence, which is 97 bp less than in the alignment used for the
other phylogenetic analyses because of missing data for the spectacled bear. For
computational reasons, we included a maximum of ten individuals per haplotype, yielding 33
sequences from four species: six haplotypes in brown bears, two haplotypes each in polar and
black bears, and one in the spectacled bear. We used the HKY substitution model, as
indicated by the Bayesian Information Criterion procedure implemented in jModelTest 2.1.1
(Darriba et al. 2012). For time calibration, we used a divergence time prior on the spectacled
bear of 6 Ma (Wayne et al. 1991) and explored other calibration scenarios as well (scenarios
A and C in table S2), a Yule process as tree prior, empirical base frequencies, and a strict
clock with an uninformative, flat prior (substitution rate 0-0.1). Additionally, we restricted the
years (scenario D, table S2). The program was run for 2x10⁹ generations that were sampled every 100,000 generations. Tracer 1.5 (Rambaut and Drummond 2007) was used to confirm
convergence. Maximum clade credibility trees were obtained from TreeAnnotator 1.7.4,
discarding a burn-in of 10%.
Median estimates of TMRCA (B/P) for the different scenarios ranged from ca.
0.43 million years ago (Ma) assuming a fixed mutation rate of 3.0 x 10⁻⁹ mutations/site/year
to ca. 2.06 Ma, assuming a split of the spectacled bear more than 10 Ma (table S2).
For divergences within brown bears, we additionally explored the analysis of
Y-chromosomal microsatellite data alone to infer the age of the most recent common ancestor
using the Rho-statistics as implemented in Network 4.6 (Bandelt et al. 1999). By choosing
one node as ancestral and the other nodes as descendent the TMRCA can be estimated. The
outcome, however, depends directly on the assumed microsatellite mutation rate, which is
known to vary within two orders of magnitude in humans (Ellegren 2004). Unfortunately,
there is no information available on the mutation rate of the herein analyzed Y-specific
microsatellites in bears. This uncertainty regarding microsatellite mutation rates translated
directly into a wide range of conceivable TMRCA values for our data. Based on a generation
time of 10 years for brown and polar bears, and the divergence between a central, unsampled
haplotype and the most divergent haplotype (found on Kamchatka), TMRCA estimates for all
brown bear haplotypes ranged from 615,392 years ago (± 38,462), assuming a mutation rate
of 2.6 x 10⁻⁵ /site/year (Forster et al. 2000), to 12,304 years ago (± 769), assuming a 50-fold
faster rate of 1.3 x 10⁻³ /site/year.
The mtDNA control region sequences (642 bp) from all individuals were aligned and
a Bayesian maximum clade credibility tree was reconstructed with Beast using a HKY
substitution model, constant size tree prior, empirical base frequencies and sampling 500
Figure S1. Statistical parsimony networks of Y chromosome haplotypes in bears.
(A) Haplotypes inferred from six Y-linked microsatellite markers. (B) Compound haplotypes
inferred from a combination of 3.1 kb Y-chromosomal sequence data and six Y-linked
microsatellite markers. All markers were weighted equally. Numbers on branches refer to the
number of substitutions between the species. Colors: brown (brown bears), blue (polar bears),
dark gray (black bears). The connection limit was set to 50 steps. At the 95% connectivity
Figure S2. Allele size distribution histograms of six Y-linked microsatellite markers.
Genotyped individuals comprise 90 brown bears, 40 polar bears, and 4 black bears,
represented by brown, blue, and black bars, respectively. Note discontinuities in the allele size
Figure S3. Median joining networks (Bandelt et al. 1999) of weighted Y haplotypes
within species, inferred from the combination of 3.1 kb sequence data and six
microsatellite markers.
Microsatellite markers were weighted inversely to their variance and sequence markers
weighted ten times the highest microsatellite weight (Brown et al. 2011). (A) Brown bears:
318.9=6, 318.4=9, 318.2=9, 369.1=1, 318.1=6 and 318.6=2. (B) Polar bears: 318.9=9,
Figure S4. Statistical parsimony network of American black bear haplotypes.
Haplotypes were inferred from the unweighted combination of 3.1 kb Y-chromosomal
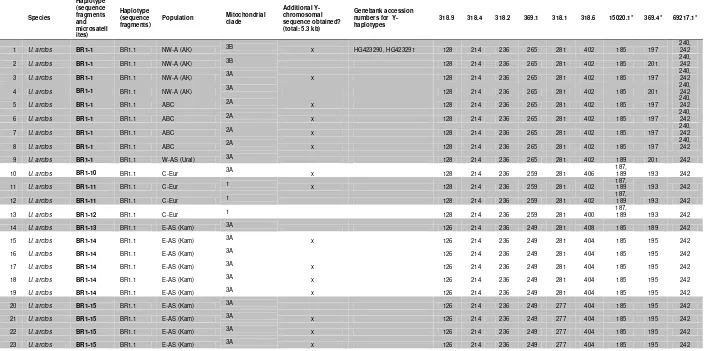
Table S1 List of individuals, their particular haplotypes, and source populations.
For a subset of individuals (indicated by “x”), additional ~2.2 kb of Y-chromosomal sequence data was obtained. Fragment sizes at 9
microsatellite markers are shown (http://doi.org/10.5061/dryad.3p21q). Asterisks indicate microsatellite markers not included in downstream analyses due to pseudoheterozygous genotypes for some individuals. Background shading (white or gray) identifies individuals that share identical haplotypes for the 3.1 kb sequence data set combined with genotypes from six microsatellite loci.
Species
Population Mitochondrial clade
125 U. maritimus PO1-8 PO1.2 ATL (E-Gr) 2B x HG423304, HG423305 126 210 234 267 281 410 185 199 242
126 U. maritimus PO1-9 PO1.1 DS 2B x 126 210 234 265 281 402 185 197 242
127 U. maritimus PO2-1 PO2 AK 2B HG423308, HG423309 126 210 234 263 281 402 185 201 242
128 U. maritimus PO2-2 PO2 AK 2B 126 210 234 263 281 404 185 201 242
129 U. maritimus PO2-2 PO2 AK 2B 126 210 234 263 281 404 185 201 242
130 U. maritimus PO2-3 PO2 W-GR (BB) 2B 126 210 234 261 281 408 185 197 242
131 U.
americanus BL1-1 BL1 Montana x HG423286, HG423287 142 210 221 263 285 386 185 195 - 132
U.
americanus BL1-2 BL1 Oregon x 140 210 221 263 285 386 185 197 -
133 U.
americanus BL2-1 BL2 Alaska zoo x HG423288, HG423289 132 210 221 259 293 388 185 189, 195 -
134 U.
americanus BL2-2 BL2 Vermont x 132 210 221 265 297 388 183
193, 201 -
135** T. ornatus SP1 Zoo Basel x HG423284, HG423285
Table S2. Divergence time estimates of Y chromosome lineages in bears, obtained from
We explored various scenarios, using a prior on the divergence time of the American black bear lineage from
brown/polar bears (BLACK; scenario A), priors on the divergence time of the spectacled bear lineage (SPECTACLED;
scenarios B and C), or a pedigree-based mutation rate estimate (per generation) from human Y chromosomes
assuming a generation time of 10 years (scenario D). Ma = million years. Fig. 2 shows scenario B.
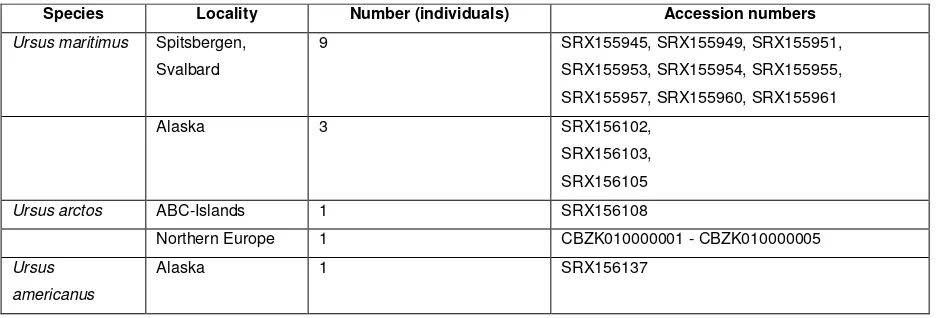
Table S3. Sample localities and accession numbers of bear genome data, used in the
scaffold-wide analyses.
Species Locality Number (individuals) Accession numbers Ursus maritimus Spitsbergen,
Svalbard
9 SRX155945, SRX155949, SRX155951,
SRX155953, SRX155954, SRX155955, SRX155957, SRX155960, SRX155961
Alaska 3 SRX156102,
SRX156103,
SRX156105
Ursus arctos ABC-Islands 1 SRX156108
Northern Europe 1 CBZK010000001 - CBZK010000005
Ursus americanus
Table S4. Pairwise ΦST-values among brown bear populations.
ABC: ABC-islands, NW-A: North-western America, CAN: Nunavut, Canada, C-EU: Central
Europe, N-EU: Northern Europe, W-AS: Western-Asia, E-AS: E-Asia (fig. 1, table 1).
ABC NW-A CAN C-EU N-EU W-AS E-AS
ABC
NW-A 0.02*
CAN 0.14 0.11
C-EU 0.24 0.15 0.23
N-EU 0.35 0.29 0.36 0.20
W-AS 0.20 0.13 0.25 0.04* 0.09*
E-AS 0.34 0.27 0.32 0.25 0.38 0.27
* not significant (p>0.05; >1,000 permutations)
Table S5. Pairwise ΦST-values among polar bear populations.
AK: Alaska, DS: Davis Strait, W-GR: Western Greenland, ATL: Atlantic (fig. 1, table 1).
AK DS W-GR ATL
AK
DS 0.09
W-GR <-0.001* 0.13*
ATL 0.35 0.51 0.17*
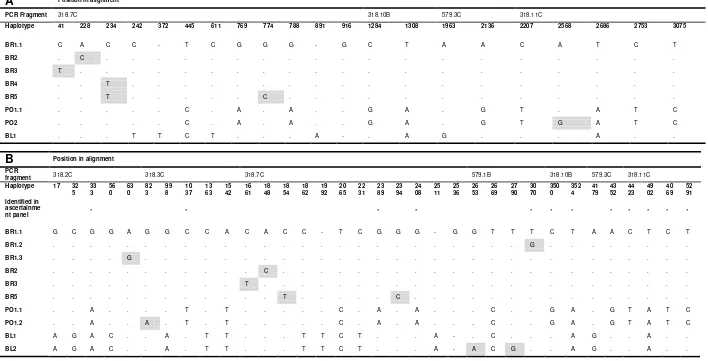
Table S6. Segregating sites of Y-chromosome haplotypes in the 3.1 kb (A) and 5.3 kb (B) datasets.
Polymorphic sites (within species variation) shown with grey background. Asterisks in (B) indicate variation that was already known from the ascertainment panel.
A Position in alignment
PCR Fragment 318.7C 318.10B 579.3C 318.11C
Haplotype 41 228 234 242 372 445 611 769 774 788 891 916 1284 1308 1963 2136 2207 2568 2686 2753 3075
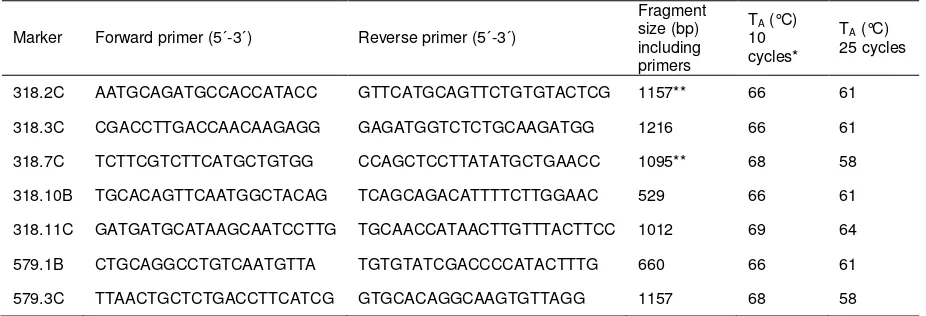
Table S7 Primer sequences, annealing temperatures and fragment sizes of
Y-chromosomal sequence fragments.
Marker Forward primer (5´-3´) Reverse primer (5´-3´)
Fragment size (bp) including primers
TA (°C)
10 cycles*
TA (°C)
25 cycles
318.2C AATGCAGATGCCACCATACC GTTCATGCAGTTCTGTGTACTCG 1157** 66 61
318.3C CGACCTTGACCAACAAGAGG GAGATGGTCTCTGCAAGATGG 1216 66 61
318.7C TCTTCGTCTTCATGCTGTGG CCAGCTCCTTATATGCTGAACC 1095** 68 58
318.10B TGCACAGTTCAATGGCTACAG TCAGCAGACATTTTCTTGGAAC 529 66 61
318.11C GATGATGCATAAGCAATCCTTG TGCAACCATAACTTGTTTACTTCC 1012 69 64
579.1B CTGCAGGCCTGTCAATGTTA TGTGTATCGACCCCATACTTTG 660 66 61
579.3C TTAACTGCTCTGACCTTCATCG GTGCACAGGCAAGTGTTAGG 1157 68 58
*decreasing by 0.5°C/1°C in order to reach the second annealing temperature after ten cycles
Table S8. Primer sequences, annealing temperature, and fragment size of small, overlapping Y-chromosomal sequence markers used to
amplify DNA from lower-quality samples.
Marker Forward primer (5´-3´) Reverse primer (5´-3´)
Fragment
318.3C_1 CGACCTTGACCAACAAGAGG ACCACCTACAGTCTGGGTTTG 372 68 61
318.3C_3 TGTCTTATTTCAAAAGCAAAATGG CTGTGTTTGAGTGCCATGAAT 365 68 61
318.3C_4 CAGGTTTCCTACAAGTCTCAGTG GAGATGGTCTCTGCAAGATGG 387 68 61
318.7C_1 TCTTCGTCTTCATGCTGTGG TTCAGTTCATGCAGTTCTGTG 368 68 61
318.7C_2 AATGAAACTGGGAACACACTTC CACAGTGGTTCACTGACATGG 391 68 61
318.7C_3 GACTTGAAGACACTTAAGTAGCATTTG AAGCATCTATACTTCATGTAGCTTGTG 341 68 58
318.7C_4 TCACTCACGTAAGCCACTCTC CCAGCTCCTTATATGCTGAACC 385 68 58
318.10B_1 TGCACAGTTCAATGGCTACAG CATGTTTACAAAGGGATCAGCA 334 72 65
318.10B_2 TTCAACTGACCCTTGAAACACT TCAGCAGACATTTTCTTGGAAC 345 72 65
318.11C_1 TGCATAAGCAATCCTTGTAATATACC TTGTTAAAGTCTCCTTTCCTTGC 378 68 61
318.11C_2 GGTTACCAGGGAACTGATGG CACAAATTCTGTGGTTTGTATAAGG 367 69 62
318.11C_3 AGACTGCACCCAAGATCTTACA AAGATTCTTCAGTCCTTAAACACTAGC 408 69 62
579.1B_1 CTGCAGGCCTGTCAATGTTA TGTTTACATGAAATATTCAGAGGAGA 335 68 61
579.1B_2 GAACCACTAATGTAGTTCCTGTCTCT TGTGTATCGACCCCATACTTTG 386 68 61
579.3C_1 TTAACTGCTCTGACCTTCATCG GCAGATATCCATTACAAAAAGCAA 395 68 61
579.3C_2 AGGGCTTTTTGGCTTTTTGT TCCTTTACTAATGCCATCCTCTG 397 69 62
579.3C_3 CCTCACTGGGATGTTGTGAG AATTAAAATATTAGAACCCTCTGTTGA 351 65 58
579.3C_4 CAGAGGATGGCATTAGTAAAGGA GTGCACAGGCAAGTGTTAGG 465 70 63
Table S9. Primer sequences, fluorescent dyes, and repeat unit of Y-chromosomal microsatellite markers.
The allele size range includes alleles from brown, polar, and American black bears.
Marker Fluorescent
Dye Forward primer (5´-3´) Reverse primer (5´-3´)
Concentration in multiplex
PCR A or B (µM) Repeat Unit
Allele size range (bp)
Y318.1 PET GGGATCAAGCCCCACATCAA ACTTGTAGATGCACATCTGTGGT 0.6 (B) AAAT 277-297
Y318.2 PET CAGGCTGACACTGGGGATTT AAGAGGGAGTCATCTGGGGT 0.7 (A) TA 221-236
Y318.4 6FAM TACCTGGCTGGCTTTCTTGG CACTGTTGGTTTTGGCTCCG 0.05 (A) GA 210-216
Y318.6 PET GCTGGCTGTCTCTCTCTCTGA AAATTCCTTTGGAAACGTCCT 0.6 (A) TG 386-412
Y318.9 VIC CACTCAGGCACCCCTCTATC TGGCCAGGATACAGAAACAAC 0.05 (B) AC 126-142
Y369.1 NED TCCCTGAATGAGCAGTAGCC GGGGTATTGCGTTGCATTGG 0.1 (A) GT 249-273
Y369.4 VIC AGGCATCCATTCTATCACCAC TGTGGATGTATCTGCCCAAC 0.1 (A) AC 187-201
Y69217.1 VIC CTCCACCTTGTCTGCCACTC TTCCCCTCCCTTTCTGTCCT 0.08 (B) TG 242
References
Bandelt HJ, Forster P, Röhl A. 1999. Median-joining networks for inferring intraspecific phylogenies. Mol. Biol. Evol. 16:37–48.
Brown SK, Pedersen NC, Jafarishorijeh S, Bannasch DL, Ahrens KD, Wu J-T, Okon M, Sacks BN. 2011. Phylogenetic distinctiveness of Middle Eastern and Southeast Asian village dog Y chromosomes illuminates dog origins. PLoS One 6:e28496.
Darriba D, Taboada GL, Doallo R, Posada D. 2012. jModelTest 2: more models, new heuristics and parallel computing. Nat. Methods 9:772.
Davison J, Ho SYW, Bray SC, et al. 2011. Late-Quaternary biogeographic scenarios for the brown bear (Ursus arctos), a wild mammal model species. Quat. Sci. Rev. 30:418–
430.
Drummond AJ, Suchard MA, Xie D, Rambaut A. 2012. Bayesian phylogenetics with BEAUti and the BEAST 1.7. Mol. Biol. Evol. 29:1969–1973.
Ellegren H. 2004. Microsatellites: simple sequences with complex evolution. Nat. Rev. Genet. 5:435–445.
Excoffier L, Lischer HEL. 2010. Arlequin suite ver 3.5: a new series of programs to
perform population genetics analyses under Linux and Windows. Mol. Ecol. Resour. 10:564–567.
Forster P, Röhl A, Lünnemann P, Brinkmann C, Zerjal T, Tyler-Smith C, Brinkmann B. 2000. A short tandem repeat-based phylogeny for the human Y chromosome. Am. J. Hum. Genet. 67:182–196.
Hailer F, Kutschera VE, Hallstrom BM, Klassert D, Fain SR, Leonard JA, Arnason U, Janke A. 2012. Nuclear Genomic Sequences Reveal that Polar Bears Are an Old and Distinct Bear Lineage. Science. 336:344–347.
Hailer F, Leonard J. 2008. Hybridization among three native North American Canis species in a region of natural sympatry. PLoS One 3:e3333.
Rambaut A, Drummond AJ. 2007. Tracer v1.4, Available from http://beast.bio.ed.ac.uk/Tracer.
Roca AL, Georgiadis N, O’Brien SJ. 5. Cytonuclear genomic dissociation in African
elephant species. Nat. Genet. 37:96–100.
Sacks BN, Brown SK, Stephens D, Pedersen NC, Wu J-T, Berry O. 2013. Y Chromosome Analysis of Dingoes and Southeast Asian Village Dogs Suggests a Neolithic
Continental Expansion from Southeast Asia Followed by Multiple Austronesian Dispersals. Mol. Biol. Evol. 30:1103–1118.
Stone KD, Cook JA. 2000. Phylogeography of black bears (Ursus americanus) of the
Pacific Northwest. Can. J. Zool. 78:1218–1223.
Wayne RK, Van Valkenburgh B, O’Brien SJ. 99 . Molecular distance and divergence time
in carnivores and primates. Mol. Biol. Evol. 8:297–319.
Weir BS, Cockerham CC. 1984. Estimating F-Statistics for the Analysis of Population Structure. Evolution. 38:1358–1370.
Wooding S, Ward R. 1997. Phylogeography and Pleistocene Evolution in the North American Black Bear. Mol. Biol. Evol. 14:1096–1105.