C
HARACTERISTICSO
FS
IGNALIZEDI
NTERSECTIONSW
HICHN
EEDA
DVANCEDT
RAFFICC
ONTROLS
YSTEMSA
PPLICATIONK
ARAKTERISTIKP
ERSIMPANGANB
ERSINYALY
ANGM
EMBUTUHKANP
ENERAPANA
dvancedT
rafficC
ontrolS
ystemA. Caroline Sutandi
Senior Lecturer in Department of Civil Engineering - Parahyangan Catholic University Ciumbuleuit 94 Bandung 40141 Indonesia. Fax: +62 22 233692
Email: [email protected]
ABSTRACT
Advanced Traffic Control Systems (ATCS) are usually used in large cities in developing countries to ease congestion pro-blems. However, the application of the systems is not to all signalized intersections in the city. Local conditions such as geo-metric conditions and traffic conditions should be taken into account seriously. The aim of this study is to identify charac-teristics of signalized intersections which need to be under ATCS. Field data were collected at 19 signalized intersections un-der ATCS surveillance and 10 streams related to the intersections, in Bandung Indonesia. Manual traffic counts, video came-ras, and floating car technique were used to collect the data during morning peak period (07:00-08:00 am), off peak periods (10:00-11:00 am), and afternoon peak period (04:30-05:30 pm). Measurements to determine the characteristics of signalized intersections are throughput per capacity at each leg intersection, number of queue at each leg intersection, and travel time at each stream. The results found that the application of ATCS is recommended to signalized intersections with characteristics of many leg intersections, located in CBD, closed distance to adjacent intersection and high side frictions. The findings of this study are very beneficial not only for Bandung but for other large cities in Indonesia that have similar local conditions. There-fore, the application of ATCS with very high cost can be implemented only to the necessary signalised intersections. Key words: characteristics of signalized intersections, ATCS, local traffic conditions
ABSTRAK
Advanced traffic control system atau sering disebut ATCS biasanya digunakan di kota besar di negara berkembang untuk mengurangi masalah kemacetan. Namun sistem ini tidak dapat diterapkan di semua persimpangan bersinyal yang ada di suatu kota. Kondisi lokal misanya kondisi geometrik dan lalu lintas harus dipertimbangkan secara matang. Tujuan studi ini adalah untuk melakukan identifikasi karakteristik persimpangan bersinyal yang harus dikendalikan menggunakan ATCS. Data lapa-ngan telah dikumpulkan dari 19 lokasi persimpalapa-ngan bersinyal yang menggunakan ATCS, dan 10 arus yang terkait delapa-ngan persimpangan tersebut di Bandung, Indonesia. Perhitungan manual lalu lintas, video kamera, dan metode floating car diguna-kan untuk mengumpuldiguna-kan data pada jam sibuk pagi (pukul 07.00-08.00), pada jam off peak (pukul 10.00-11.00), dan jam si-buk sore (16.30-17.30). Pengukuran dalam penentuan karakteristik persimpangan bersinyal dihitung per kapasitas setiap leng-an persimpleng-angleng-an, jumlah leng-antrileng-an setiap lengleng-an, dleng-an waktu tempuh pada setiap arus. Berdasarkleng-an hasil investigasi dapat di-nyatakan bahwa penerapan ATCS diekomendasikan di persimpangan bersinyal dengan karakteristik memiliki banyak lengan, berada di CBD, persimpangan yang berdekatan dan hambatan samping tinggi. Hasil studi ini sangat bermanfaat tidak hanya untuk kota Bandung tetapi juga untuk kota besar lain di Indonesia yang mempunyai kondisi sama. Sehingga penerapan ATCS dengan biaya tinggi hanya diperlukan oleh persimpangan bersinyal yang membutuhkan.
Kata-kata kunci: karakteristik persimpangan bersinyal, ATCS, kondisi lalu lintas lokal
INTRODUCTION
The application Advanced Traffic Control Systems (ATCS) in large cities in developing countries is to improve efficiency and capacity of existing road infrastructure (US DOT, 2010, ITS Australia, 2010). Since application of ATCS needs very high cost, the application of this system is not at all signalized inter-sections, but only at necessary signalized intersections. However, what characteristics of signalized intersections that need to be un-der ATCS are unknown yet.
The aim of this study is to identify characteristics of signa-lized intersection which need to be under ATCS.The characteris-tics are closed related to local conditions. Therefore, geometric conditions and traffic conditions as local conditions should be ta-ken into account.
Measurements used to determine the characteristics of sig-nalized intersections are throughput per capacity at each leg inter-section, number of queue (veh) at each leg interinter-section, and tra-vel time (hh:mm:ss) at each stream.A stream is a set of sections
Road network in Bandung, Indonesia was used as a case study. Data collection was carried out at 19 signalized intersec-tions under ATCS surveillance and 10 streams related to the in-tersections. Manual traffic counts, video cameras, and floating car technique were used to collect the data during morning peak period (07:00-08:00 am), off peak periods (10:00-11:00 am), and afternoon peak period (04:30- 05:30 pm).
By finding out the characteristics, specific signalized inter-sections can be recommended to be under ATCS. The results of this study are very beneficial to reduce high cost since applica-tion of ATCS is only to the recommended signalized intersec-tions.
RESEARCH METHOD
and Head, 2001; AWA Plessey, 1997a; AWA Plessey, 1997b; Montgomery, 1996), number of queue, and travel time (Abdel-Rahim, and Taylor, 2000; AWA Plessey, 1997a).
Throughput (veh/h) is number of vehicles pass the inter-section during green time. Throughput data is collected using ma-nual traffic counts including vehicle occupancy, turning move-ments, phases, and vehicle classifications. Video camera at each observed intersection is used to record traffic movements at each phase.
Number of queue (veh) is number of vehicles queue at leg intersection at the intersection during red time. Video camera at each observed intersection is also used to record number of queue at each leg intersection. Five surveyors needed to collect the field data at each observed intersection.
Travel time (hh:mm:ss) is defined as the time taken by a vehicle to traverse a given segment of street or highway, wherein vehicle speed is directly related to it. The measurement of travel time is along a roadway segment (Transportation Research Bo-ard, 2000; and Robertson, et al., 1994). Manual Data Collection Methods require tests vehicles, drivers, observers, stopwatch, and data collection forms. The distances between control points and the length of the total route may be obtained from accurate, drawn to scale plans or maps or from the vehicle odometer. Since the methods require test vehicles, the driver of the test vehicle proceeds along the study route in accordance with a recommend-ed technique. Technique usrecommend-ed in this study is Floating Car Tech-nique wherein driver “floats” with the traffic by attempting to safely pass as many vehicles as pass the test vehicle.
The test car begins at a short distance upstream of the begin point. As the test vehicle passes the begin point the driver starts the stopwatch. The test car proceeds through the study section being studied according to the driving technique selected. As the test car passes the end point of the study section, the driver stops and reads the stopwatch. The test car turns around and travels the same section in the opposite direction. Both directions may be studied simultaneously. Test runs should begin promptly at the beginning of the desired study period so as to complete the re-quired sample of runs before conditions along the route change (Roess, et. al., 1998 and Robertson, et al., 1994). Three surveyors needed to collect the field data at each observed stream.
Data Collection
ATCS that is implemented in Bandung is Sydney Coordi-nated Adaptive Traffic Control Systems (SCATS). Advanced tra-ffic control system SCATS currently controls 117 signalized in-tersections out of 135 inin-tersections in Bandung. Up to this mo-ment, 90 signalized intersections (48 signalized intersections in North Bandung and 42 signalized intersections in South Ban-dung) connected to SCATS, wherein the other 27 signalized in-tersections were under flashing yellow signal because of changes to the direction of traffic (Sutandi, 2006).
More than one hundred surveyors collected the field data at observed intersections and streams, in August 2009. Financial support is granted by Directorate of Higher Education, Depart-ment of National Education, Republic of Indonesia, 2009.
The observed intersections in this study were 19 signalized intersections under ATCS surveillance and 10 streams related to the intersections in Bandung Indonesia. Manual traffic counts, video cameras, and floating car technique were used to collect throughput, queue length, and travel time data during morning peak period (07:00-08:00 am), off peak periods (10:00-11:00 am), and afternoon peak period (04:30-05:30 pm).
Criteria used to choose signalized intersections as samples are as follow.
- Based on typology, in a proportional method (Sutandi and Santosa, 2007).
- Based on location of signalized intersection in the typology. - Based on road detectors that work well at the intersection. - Signalized intersection chosen is intersection with high level
of congested intersection.
Criteria used to choose streams as samples areas follow.
- Based on road hierarchy (arterial roads, collector roads, local roads).
- Streams wherein chosen signalized intersection lied.
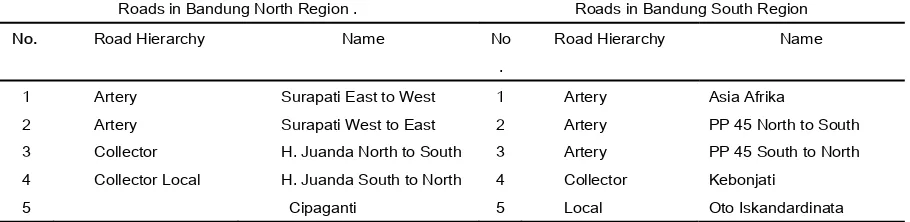
Typology of all signalized intersections under SCATS is presented in Table 1. Table 2 presents observed signalized inter-sections in this study, and Table 3 presents detail observed strea-ms in this study.
RESULTS AND DISCUSSION
In order to determine characteristics of signalized intersect-ions need to be under ATCS, the following steps have to be ta-ken.
a. Determine signalized intersections with high level of conges-tion including have high level of v/c ratio (AWA Plessey, 1997a; AWA Plessey, 1997b). In case of Bandung, 90 signa-lized intersections have been determined to be under ATCS and in this study 19 signalized intersections are the observed intersections
b. Classified the intersections based on existing geometric and traffic conditions.
c. Determine measurements i.e. throughput per capacity, num-ber of queue, and travel time based on classification. d. Determine characteristics of signalized intersections that need
to be under ATCS
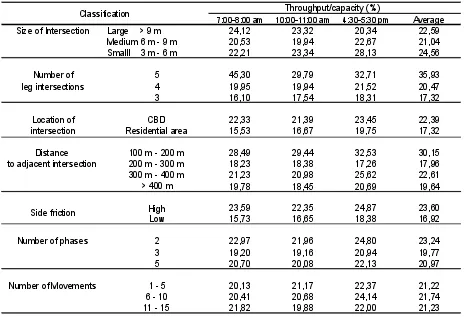
Throughput alone cannot be used to compare how high the traffic flow at intersections with various numbers of phases and move-ments, since traffic flow at each intersection depends on number of leg intersections, number of lanes, and lane width at the inter-section. Therefore, capacity in each leg is used to divide through-put at the leg.Throughput per capacity is one of indicators to de-termine traffic congestion.
Observed intersections are classified based on geometric and traffic conditions i.e. size of intersection, number of leg inter-sections, location of intersection, distance to adjacent intersect-ion, level of side frictintersect-ion, number of phase, and number of move-ments. Whereas CCTV surveillance, existence of police officers at intersection, road hierarchy, and v/c ratio of roads are not used to classify the observed intersections based on a number of rea-sons as follow.
- Only a few of CCTV at 12 signalized intersections in Ban-dung are working well.
- Police officers do not always presence at specific intersect-ions.
- Road hierarchy and v/c ratio of roads are used to determine observed streams.
Classification of the intersections based on geometric and tra-ffic conditions are presented in Table 4 and Table 5. Whereas Ta-ble 6 presents travel time and speed in the observed streams. Table 4 shows the following results.
- based on size of intersections, throughput per capacity at leg intersections seems similar.
Table 1. Typology of all signalized intersection under SCATS in Bandung, Indonesia (Sutandi and Santosa, 2007)
No. I II III IV
(36) (19) (14) (21) 1 number of leg intersections 3-4 3-4 3-4 3-5 2 number of medians 0-2 0-2 0-4 0-4 3 number of splitter islands 0 0 2-3 0
4 number of phases 2-3 2 2-5 2-4
5 number of movements 4-9 3-9 5-12 12-15 6 the size of intersection medium small-medium medium-large small-medium 7 the existence of CCTV yes no no no 8 the existence of policemen at intersection yes no yes no 9 the location of intersection 91.7% in CBD 73.7% in CBD 92.9% in CBD 66.7% in CBD 10 8.3% in RES 26.3% in RES 7.1% in RES 33.3% in RES the distance to the closest intersection 200-400m 200-400m 300-400m 300-400m 11 road hierarchy 39% arterial roads 11% arterial roads 86% arterial roads 19% arterial roads 12 28% collector roads 42% collector roads 14% collector roads 29% collector roads 33% local roads 47% local roads 52% local roads the longest width of leg intersection 12-16.8m 8-13.5m 12-21m 10-18m 13 the shortest width of leg intersection 6.15-12m 4-10m 6-12m 5-12m 14 volume capacity ratio of major road 0.615 0.567 0.744 0.751 15 volume capacity ratio of minor road 0.553 0.457 0.79 0.735 16 level of side friction H=61%; L=39% H=58%; L=42% H=71%; L=29% H=48%; L=52%
Typology
(number of intersections in typology)
Table 2. Observed signalized intersections
Typology Number of
Signalized Intersections
Name of Signalized Intersections
I 8 Lingkar Selatan – Jendral Sudirman
Lingkar Selatan – M Ramdan Jendral Sudirman – Gardujati Oto Iskandardinata – Asia Afrika Asia Afrika – Tamblong Cihampelas – Abdul Rivai Merdeka – RE Martadinata Aceh – Merdeka
II 4 Cipaganti – Sampurna
Martadinata – Trunojoyo Aceh – R.E. Martadinata Moh Ramdan – Pungkur
III 3 A Yani – RE Martadinata
Pasirkoja – Jamika Pajajaran – Pasirkaliki
IV 4 Dipatiukur – Siliwangi
Pahlawan – Surapati
Abdulrahman Saleh – Pajajaran Talagabodas – Burangrang
Table 3. Observed streams
Roads in Bandung North Region . Roads in Bandung South Region
No. Road Hierarchy Name No
.
Road Hierarchy Name
1 2 3 4 5
Artery Artery Collector Collector Local
Surapati East to West Surapati West to East H. Juanda North to South H. Juanda South to North
Cipaganti
1 2 3 4 5
Artery Artery Artery Collector Local
Asia Afrika
PP 45 North to South PP 45 South to North Kebonjati
Oto Iskandardinata
- based on location of observed intersections, application of ATCS is more effective at intersections lie in CBD. This means that areas with high congested traffic need ATCS more than area with lower congested traffic such as
far distance to adjacent intersection is not effective because long stream between intersections can better accommodate number of vehicles, number of traffic movements at stre-ams with the same capacity, higher speed, higher number of queue vehicles, without direct impact to adjacent inter-sections. In this condition, implementation of ATCS cannot increase traffic performance significantly.
- based on side frictions, application of ATCS is more effect-ive at intersections with high level of side frictions. This means that the intersections lie in the congested area. This result consistence with the previous result, that application of ATCS is more effective in CBD area.
- based on number of phases and number of movements at intersections, throughput per capacity at leg intersections seems similar.
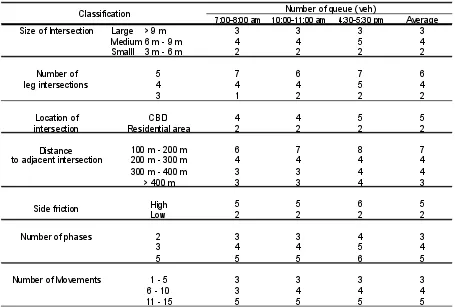
Table 5 shows the following results.
- based on size of intersections, number of phases, and number of movements, number of queue (veh) at leg intersections seems similar.
- number of queue is higher at the intersections with higher number of leg intersections, located in CBD, close distance to adjacent intersection, and higher level of side frictions. This condition occurs since the intersection tent to have traffic congestion.
Table 6 shows that travel time is lower and speed is higher in local roads than those in roads with higher hierarchies (collector roads and arterial roads). This condition occurs since local roads usually have less traffic congestion than roads with higher hierar-chies.
Therefore, it is recommended that ATCS is implemented at signalised intersections with the following characteristics. - higher number of leg intersection.
- located in CBD.
- have closed distance to adjacent intersection. - have high level of side friction.
The recommendation is very beneficial since implementati-on of advanced technology ATCS with high cost is implementati-only at neces-sary signalised intersections. The implementation of ATCS is al-so needs support from road users including drivers and pedes-trians to adhere to the traffic regulations, so that good traffic performance can be reached.
Table 4. Throughput per capacity based on classification of signalized intersections
7:00-8:00 am 10:00-11:00 am 4:30-5:30 pm Average
Size of Intersection Large > 9 m 24,12 23,32 20,34 22,59
Medium 6 m - 9 m 20,53 19,94 22,67 21,04
Smalll 3 m - 6 m 22,21 23,34 28,13 24,56
Number of 5 45,30 29,79 32,71 35,93
leg intersections 4 19,95 19,94 21,52 20,47
3 16,10 17,54 18,31 17,32
Location of CBD 22,33 21,39 23,45 22,39
intersection Residential area 15,53 16,67 19,75 17,32
Distance 100 m - 200 m 28,49 29,44 32,53 30,15
to adjacent intersection 200 m - 300 m 18,23 18,38 17,26 17,96
300 m - 400 m 21,23 20,98 25,62 22,61
> 400 m 19,78 18,45 20,69 19,64
High 23,59 22,35 24,87 23,60
Low 15,73 16,65 18,38 16,92
Number of phases 2 22,97 21,96 24,80 23,24
3 19,20 19,16 20,94 19,77
5 20,70 20,08 22,13 20,97
Number of Movements 1 - 5 20,13 21,17 22,37 21,22
6 - 10 20,41 20,68 24,14 21,74
11 - 15 21,82 19,88 22,00 21,23
Classification Throughput/capacity (%)
Table 5. Number of queue based on classification of signalized intersections
7:00-8:00 am 10:00-11:00 am 4:30-5:30 pm Average
Size of Intersection Large > 9 m 3 3 3 3
Medium 6 m - 9 m 4 4 5 4
Smalll 3 m - 6 m 2 2 2 2
Number of 5 7 6 7 6
leg intersections 4 4 4 5 4
3 1 2 2 2
Location of CBD 4 4 5 5
intersection Residential area 2 2 2 2
Distance 100 m - 200 m 6 7 8 7
to adjacent intersection 200 m - 300 m 4 4 4 4
300 m - 400 m 3 3 4 4
> 400 m 3 3 4 3
High 5 5 6 5
Low 2 2 2 2
Number of phases 2 3 3 4 3
3 4 4 5 4
5 5 5 6 5
Number of Movements 1 - 5 3 3 3 3
6 - 10 3 4 4 4
11 - 15 5 5 5 5
Classification Number of queue (veh)
Side friction
Table 6. Travel time based on road hierarchy
7:00-8:00 am 10:00-11:00 am 4:30-5:30 pm Average 7:00-8:00 am 10:00-11:00 am 4:30-5:30 pm Average
Artery 0:06:19 0:06:19 0:07:19 0:06:39 19,49 19,10 15,91 18,17
Collector 0:07:08 0:05:41 0:07:25 0:06:45 15,18 19,92 13,77 16,29
Local 0:04:34 0:04:49 0:07:48 0:05:44 23,83 22,67 14,20 20,23
Average 0:06:13 0:05:50 0:07:26 0:06:30 19,07 20,06 14,93 18,02
Road hierarchy Travel Time (hh:mm:ss) Speed (km/h)
CONCLUSIONS
This study evaluated characteristics of signalized intersection which need to be under ATCS. Data collection was carried out at 19 signalized intersections under ATCS surveillance and 10 streams related to the intersections. Manual traffic counts, video cameras, and floating car technique were used to collect the data during morning peak period (07:00-08:00 am), off peak periods (10:00-11:00 am), and afternoon peak period (04:30- 05:30 pm). Observed intersections are classified based on existing geometric and traffic conditions.
The results show that ATCS implementation are recom-mended to signalised intersections with the characteristics of hig-her number of leg intersection, located in CBD, have closed dis-tance to adjacent intersection, and have high level of side friction.
The recommendation is very beneficial since implementa-tion of advanced technology ATCS with high cost is only at ne-cessary signalised intersections needed. The implementation of ATCS is also needs support from road users including drivers and pedestrians to adhere to the traffic regulations, so that good traffic performance can be reached. The findings of this study are very beneficial not only for Bandung but also for other large
ci-ACKNOWLEDGEMENT
This study is a part of research (Hibah Kompetensi Bidang Infrastruktur, Transportasi dan Industri Pertahanan) that is granted by Directorate of Higher Education, Department of Na-tional Education, Republic of Indonesia, 2009.
REFERENCES
Abdel-Rahim, Ahmed and Taylor, W. C. (2000). “Potential Tra-vel Time and Delay Benefits of Using Adaptive Signals.” Transportation Research Board, Washington DC Remarks: Presentation at the 79th annual meeting of the Transportation Research Board, Washington, D.C., Michigan State University, Dept. of Civil and Environmental Engineering. AWA Plessey. (1997a), Bandung "After" Traffic Study, Supply
and Installation of An Area Traffic Control (ATC) System Bandung, Volume I.
AWA Plessey. (1997b), Bandung "After" Traffic Study, Supply and Installation of An Area Traffic Control (ATC) System Bandung, Volume II.
Se-tion Research.” Part C, Emerging Technologies, journal, vol. 11, issue 6, pp. 439 – 462, December 2003.
Clement, Stuart J., Taylor, Michael A.P., Yue, Wen Long. (2004). “Simple Platoon Advancement A Model of Automa-ted Vehicle Movement at Signalised Intersections.” Trans-portation Research Part C, Emerging Technologies, journal, volume 12, issue 3 - 4, pp. 293 – 320.
ITS Australia (2010), Intelligent Transportation System Australia
[online] Available from http://www.its-australia.com.au/ Liu, Ronghui, van Vliet, Dirck, Watling, David. (2005),
Micro-simulation Models Incorporating Both Deman and Supply Dinamics, Institute for Transport Studies, Univ. of Leeds, Leeds LS2 9JT, UK.
Mirchandani, Pitu and Head, Larry. (2001). “A Real-time Traffic Signal Control System: Architecture, Algorithm, and Analy-sis.”Transportation Research Part C, Emerging Technolo-gies, journal, volume 9, issue 16, pp. 415 – 432, December 2001.
Montgomery, Jeff. (1996). “Aussie Device Should Improve Tra-ffic Flow.” News-Journal (Wilmington, Del.), p. D9, Univ. of Calif., Berkeley, Inst. Transp Studies.
Nigarnjanagool, Suphasawas and Dia, H. (2005). “Evaluation of A Coordinated and Real time Signal Optimisation Modelling Using Traffic Simulation.” Proceedings of the 27th Conferen-ce of the Australian Institutes of Transport Research, De-cember 2005, Queensland University of Technology, Brisbane, Australia.
Robertson, H. Douglas, Hummer, Joseph E., Nelson, Donna G. (1994). Manual of Transportation Engineering Studies,
Insti-tute of Transportation Engineers, Prentice Hall, Englewood Cliff, New Jersey 07632.
Roess, Roger P., Mc Shane, William R., Prassas, Elena S. (1998),
Traffic Engineering, Second Edition, Prentice Hall, Upper Saddle River, New Jersey 07458.
Sutandi, A. Caroline. (2006). “Performance Evaluation of Advanced Traffic Control Systems In A Developing Country.” Ph.D Dissertation (Univ. of Queensland, Bris-bane, Australia).
Sutandi., A. Caroline and Santosa, Wimpy. (2007). “Performance Evaluation of Advanced Traffic Control Systems in Different Road Network Typologies.” Proceedings of the 7th Eastern Asia Society for Transportation Studies International Confe-rence, Volume 6, Dalian, China, September 2007.
Transportation Research Board. (2000). Highway Capacity Ma-nual, available from National Research Council, Washington D.C.TSS (2004), Transport Simulation Systems, available from http://www.tss-bcn.com
TSS. (2010). Transport Simulation Systems, available from http: //www.tss-bcn.com
U.S. Department of Transportation. (2010). Benefit of Integrated Technologies and The National ITS Architecture [online] Available from http://www.its.dot.gov/its_overview/htm. Xia, Yiping and Shao, Yaping. (2005). “Modelling of Traffic