Wa1tar
En'lflrcanJ1nerlt
Elnglln.~lrl
~·AJ:.~ricultILlrallAr~tlAl'
r
Ien"ironm,ent
gin
(PAVWEES)
F
)
lnls ry
f culture:,F,ood a
d Rura'l AHar
(MAF
A)
Kore
ura.
Community Cor,poratl,on(KRC)
HOlilea,n
Fedlerail'J'
on of
,Se e
ca,
nd 1i
tsrqponmlkjihgfedcbaZYXWVUTSRQPONMLKJIHGFEDCBACAlo
,So~letle(KOFST)
[
Conte
ts
]
Session 1
A-02rqponmlkjihgfedcbaZYXWVUTSRQPONMLKJIHGFEDCBAImpact of Average Elevation of Basins on Earlier Snowmelt Caused by Climate Change
ITO Nobuo, SUTO Yuji, NAKAMURA Kazumasa 1
A-03 Assessment of Climate Change Impact on Crop Yields in Northern Taiwan by Using Principal Component Analysis
RAY-SHYANWU, MING-HSU U, JI-TANG FANG, CHI-MEI WANG 9
A-06 Climate Change Action Plan for Water Resources in Taiwan
Wei-Fu Yang, Chi-Ming Chen, Pei-Jung Wu 21
Session 2
8-04 Water-saving Effect of Simplify Surge Flow Method ADF Method in Uzbekistan
Junya Onishi, Paluashova Ghavharay, Hiroshi Ikeura 31
8-07 Expansion of Leased Paddy Land and Crisis of Sustainability of Water User Associations in Japan
Hajime Tanji, Katsuhiro Sakurai, Ataru Nakamura, Hirohide Kiri, Tetsuo Nakaya 43
Session 3
C-01 Water Management at Large-Sized, Sub-Irrigation-Installed Paddy Fields
Nakamura Kazumasa, Kohiyama Masayuki, Unoki Keiji 53
C-03 Development of a Simple Method of Discrimination between the Dojo and Kara-dojo Loaches
for the Conservation of Japan's Rural Ecosystem
Noriyuki Koizumi, Kazuya Nishid, Atsushi Mori, Keiji Watabe, Takeshi Takemura 67
C-07Determining Optimal Soil Moisture for Irrigated Rice in Indonesia with System of
RiceIntensification
Chusnul Arif, Masaru Mizoguchi, Budi Indra Setiawan, Tsugihiro Watanabe 75
Session 4
0-01rqponmlkjihgfedcbaZYXWVUTSRQPONMLKJIHGFEDCBADecrease of Egg-masses for the Japanese Brown Frog (Rana japonica) after Land Consolidation Project in Paddy Field Area, Japan
Keiji Watabe, Atsushi Mori, Noriyuki Koizumi, Takeshi Takemura, Kazuya Nishida 87
0-02 Applicability Study of Ecological Impact Assessment Using AQUATOX Model in Paldang Reservoir, South Korea
Chun Gyeong Yoona, Han-Pil Rheeb, YeongKwon Sonc 93
0-05 Feasibility Analysis of Nitrogen Balance in Paddy Fields toward New Irrigation Service for
Rice Quality
Tasuku Kato, Toshiaki Iida 111
0-07 Relational Analysis between Yield and Planting Condition of Rainy Seaso Rice in Low
Productive Fields:a Case Study in Lao PDR
Hiroshi Ikeura, Phetyasone Xaypanya, Sengthong Phongchanmixay, Somphone Inkhamseng, Somnuck Sou bat, Salermphon Phonangeone, Soulintha Chanthabuly 115
0-08 Investigation of Organic Fertilizer to Reduce Insecticide - Assessment of Paddy Ecosystem using Emergence Husks of Red-Dragonflies
-Aoda Tadao, Katano Kai, Toyama Kazunari, Jinguji Hiroshi 123
Session 5
E-Ol Screening Rice (Oryza sativa L.) Varieties Suitable for System of Rice Intensification (SRI) K. Noborio, J. Lanceras-Siangliw, K. Katano, M. Mizoguchi, T. Toojinda 129
E-02 Effect of SRI Methods on Water Use, NPS Pollution Discharge, and GHG Emission in Korean Trials Joongdae Choi, Gunyeob Kim, Woonji Park, Suin Lee, Deogbae Lee, Dongkoun Yun 133
E-04 The Impact of Agriculture Policy to Rural Water Management in Northern Taiwan
Ray-Shyan Wu, Chia-Chi Ma : 145
E-05 Irrigation Practice and Irrigation Management Improvement in Baingda Irrigation Project Maung Maung Naing, Thiha Aung, Zaw Min Htut, Yutaka Matsuno, Haruhiko Horino 155
E-06 Nitrogen and Weed Management in No-tilled Transplanted Rice on No-tilled Transplanted
Rice- Surface Seeded Wheat Cropping System under Conservation Agriculture
Pijush K Mukherjee, Biswapati Sinha 163
Session 6
F-02rqponmlkjihgfedcbaZYXWVUTSRQPONMLKJIHGFEDCBAModeling the Future Water Footprint of Paddy Rice in the Republic of Korea
Temba Nkomozepi, Sang-Ok Chung 175
F-03Effect of Return Flow on Water Temperature in Irrigation-Drainage Canal Under Spill-over
Paddy Irrigation
Masaomi KIMURA, Kouki KASAI, Toshiaki IIDA, MARIE Mitsuyasu, Naritaka KUBO 187
F-OS The Suitability Evaluation of Dredged Soil from Reservoir as Embankment Materials
Jaesung Park, Younghwan Son, Sookack Noh, Taeho Bong 199
F-08Analysis of Irrigation Service Needs by Rice Farming Families in Japan
Toshiaki IIDA, Masaomi KIMURA, Koshi YOSHIDA, Naritaka KUBO, Takahiro YOKOI 211
F-lO Runoff Characteristics of Non-point Source Pollution from Reclaimed Paddy
Yujin Lee, Chun Gyeong Yoon, Joon-Sik Kim, Moonsoo Cho, Seungil Lee 219
F-lS Evaluation of Effects on Baseflow of Using Measured Field Slope Length and Slope using SWAT Ji Min Lee, Younghun Jung, Gwan Jae Lee, Seong Joon Kim, Joong Dae Choi, Kyoung Jae Lim
...229
F-16Assessment of Paddy Field Runoff on Water Quality of Yeongsan River Basin by Load
Duration Curve
Dongho Choi, Jaewoon Jung, Kwangsik Yoon, Woojung Choi, Hana Park 235
Poster Session
P-03 An Analysis of Runoff Characteristics of Hosan Stream Using Rainfall-Runoff Model
Seung J. Maeng, Ji H. Shim, Gil S. Hwang, Dong O. Kim, Ji H. Jeong 243
P-04 Development of Irrigation Management Method for Reducing Inflow of Radioactive
Substances in Japan
Moono Shin, Tornijiro Kubota, Koji Hamada, Tadayoshi Hitomi 249
P-06 National Risk Assessment of Irrigation on the Farmland near Wastewater Treatment Plants in Korea
Jae-Ho Choi, Chun Gyeong Yoon, Han-Pil Rhee, Moonsoo Cho, Je ha Ryu 255
PA
WEES
2013 (12TH) INTERNATIONAL
CONFERENCE ON AGRICULTURAL
WATER AND RURAL ENVIRONMENT FOR
THE FUTURE
RAMADA PLAZA HOTEL, Cheongju, KOREA
Wednesday, Oct. 30 - Friday, Nov. 1,2013
Determining Optimal Soil Moisture for Irrigated
Rice in
Indonesia with System of Rice Intensification
Chusnul Arif*, Masaru Mizoguchi**,Budi Indra Setiawan*, Tsugihiro Watanabe*** *Department of Civil and Environmental Engineering, Bogor Agricultural University (lPB),
Bogor, Indonesia Email: [email protected]@ipb.ac.id **Department of Global Agricultural Sciences, The University of Tokyo, Japan
***Research Institute for Humanity and Nature, Kyoto, Japan.LKJIHGFEDCBA
I n t h i s s t u d y , a n o p t i m a l c o m b i n a t i o n o f s o i l m o i s t u r e f o r i r r i g a t e d r i c e i n I n d o n e s i a t h a t m a x i m i z e s b o t h y i e l d a n d w a t e r p r o d u c t i v i t y o f s y s t e m o f r i c e i n t e n s i f i c a t i o n ( S R I ) p a d d y f i e l d w a s d e t e r m i n e d b y g e n e t i c a l g o r i t h m ( G A ) m o d e l - b a s e d o p t i m i z a t i o n . B e f o r e p e r f o r m i n g o p t i m i z a t i o n , a f o r m u l a t o d e s c r i b e y i e l d b y s o i l m o i s t u r e a n d m e t e o r o l o g i c a l p a r a m e t e r s w a s i d e n t i f i e d u s i n g m u l t i p l e n o n - l i n e a r r e g r e s s i o n a n a l y s i s . T h e G A m o d e l w a s performed b a s e d o n t h e i d e n t i f i c a t i o n p r o c e s s a c c o r d i n g t o t h e e m p i r i c a l d a t a d u r i n g t h r e e c r o p p i n g s e a s o n s . H e r e , w e c l a s s i f i e d s o i l m o i s t u r e l e v e l i n t o t h r e e l e v e l s i .e . w e t ( W ) , m e d i u m ( M ) o r d r y ( D ) b a s e d o n t h e s o i l w a t e r r e t e n t i o n c u r v e . A s t h e r e s u l t s , t h e o p t i m a l s o i l m o i s t u r e w a s a c o m b i n a t i o n o f w e t , w e t , m e d i u m , a n d d r y l e v e l s f o r i n i t i a l , c r o p d e v e l o p m e n t , m i d - s e a s o n a n d l a t e s e a s o n g r o w t h s t a g e s , r e s p e c t i v e l y . W e c a l l e d t h i s r e g i m e a s W - W - M - D r e g i m e . T h e w e t l e v e l i n t h e i n i t i a l a n d c r o p d e v e l o p m e n t g r o w t h s t a g e s s h o u l d b e a c h i e v e d p r o v i d i n g e n o u g h w a t e r f o r t h e p l a n t t o d e v e l o p r o o t , s t e m a n d t i l l e r , a n d t h e n t h e f i e l d c a n b e d r a i n e d i n t o t h e m e d i u m l e v e l w i t h t h e i r r i g a t i o n t h r e s h o l d o f f i e l d c a p a c i t y t o a v o i d s p i k e l e t s t e r i l i t y i n m i d - s e a s o n s t a g e a n d f i n a l l y , l e t t h e f i e l d i n t h e d r y l e v e l t o s a v e m o r e w a t e r i n t h e l a t e s e a s o n s t a g e w h e n p l a n t w a t e r r e q u i r e m e n t i s m i n i m u m . B y t h i s s c e n a r i o , i t w a s s i m u l a t e d t h a t t h e y i e l d c a n b e i n c r e a s e d u p t orqponmlkjihgfedcbaZYXWVUTSRQPONMLKJIHGFEDCBA8.35% a n d w a t e r p r o d u c t i v i t y u p t o 13.49% w i t h s a v i n g w a t e r u p t o 12.28% c o m p a r e d t o t h e e m p i r i c a l d a t a .
K e y w o r d s : s y s t e m o f r i c e i n t e n s i f i c a t i o n ( S R I ) , n o n - f l o o d e d i r r i g a t i o n , w a t e r p r o d u c t i v i t y , w a t e r s a v i n g , g e n e t i c a l g o r i t h m
1. Introduction
Recently, the scarcities of water resources and competition for their use have made water saving the main challenge in maintaining the sustainability of rice farming. Therefore, water saving technology becomes one of the priorities in rice research (Barker et aI., 2000). Rice is highly possible
produced under water saving technology with system of rice intensification (SRI) in which continuous flooded irrigation is not essential anymore to gain high yield and biomass production (Lin et al., 2011; Sato et aI., 2011; Zhao et al., 2011).
SRI is well-known as a set crop management practices for raising the productivity of irrigated rice by changing the management of plants, soil, water and nutrients. Although some critics were dismissed to the SRI (Dobermann, 2004; Sheehy et al., 2004; Sinclair and Cassman, 2004), however, its benefits have been validated in 42 countries of Asia, Africa and Latin America (Uphoff et aI., 2011). In the SRI paddy field, non-flooding irrigation is applied in which the field is allowed dry during particular time instead of keeping them continuously t1ooded, a practice called alternate wetting and drying irrigation (Van de Hoek et aI., 2001).
Many experiments have been conducted by comparing continuous flooding and non-flooding regimes under SRI (Barison and Uphoff, 2011; Chapagain and Yamaji, 2010; Choi et aI., 2012; Hameed et aI., 2011; Sato et aI., 2011; Zhao et aI., 2011). Water productivity can be raised and water can be saved significantly, as reported in studies that provide data for different countries, e.g., 28% in Japan (Chapagain and Yamaji, 2010), 40% in Eastern Indonesia (Sato et aI., 2011), and 38.5% in Iraq (Hameed et al., 2011). Also by SRI, the land productivity raised more than double in Madagascar (Barison and Uphoff, 2011), 78% in Eastern Indonesia (Sato et aI., 2011), 65% in Afghanistan (Thomas and Ramzi, 2011), 42% in Iraq (Hameed et aI., 2011), and 11.3% in China (Lin et aI., 2011). However, the optimal wet and dry levels (represented by soil moisture) in each growth stage is still unclear because there is lack information study on optimizing water management of SRI paddy field. Thus, the current study was undertaken to find optimal soil moisture level in each growth stage to maximize both yield and water productivity during cultivation period.
In the irrigation planning model, there are many factors to be considered, such as crop water requirement, production function, precipitation, soil water balance including irrigation water, plant growth stage, etc (Zhang et aI., 2008). It is difficult problem to find the optimal or near optimal solution with traditional optimization methods because the limitations in integrating of multi-factors in the model. Thus, genetic algorithm (GA) proposes global optimization search with many remarkable characteristics by searching the entire population instead of moving from one point to the next as the traditional methods (Kuo et aI., 2000).
GA has the ability to rapidly search a global optimal value of a complex objective function using a multi-point search procedure involving crossover and mutation processes (Goldberg, 1989). GA differs from the traditional optimization and other search methods in the following ways: (1) GA works with a coding of the parameter set, not the parameters themselves, (2) GA searches from population of points, not a single point, (3) GA uses objective function, not derivatives or other auxiliary knowledge, and (4) GA uses probabilistic transition rules, not deterministic rules (Goldberg, 1989). GA has been applied to several irrigation planning applications (Kuo et aI., 2000; Raju and
Kumar, 2004; Wardlaw and Bhaktikul, 2004; Zhang et aI., 2008). However, optimizing water
management in any SRI paddy fields have not yet been achieved by finding the optimal soil moisture in each growth stage.
Therefore, the main objectives of this study was to find the optimal water management by determining optimal combination of soil moisture levels using GA model in maximizing both yield and water productivity.
2. Materials and Methods
2.1 Field Experiments
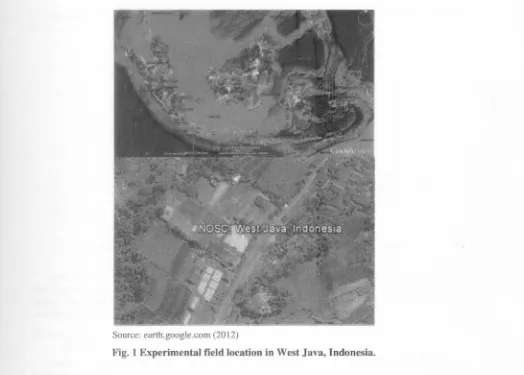
The optimization process was carried out based on the field experiments in the experimental paddy tield in the Nusantara Organics SRI Center (NOSC), Sukabumi, West Java, Indonesia located at 06°50'43"S and 106°48'20"E, at an altitude of 536 m above mean sea level (Fig. 1) during three
cropping seasons (Table 1).rqponmlkjihgfedcbaZYXWVUTSRQPONMLKJIHGFEDCBA
Source: earth.google.com (2012)
Fig. 1 Experimental field location in West Java, Indonesia.
There were four plots and each plot was planted with the variety of rice (Oryza sativa L), Sintanur using the following SRI elements: single planting of young seedlings spaced at 30 cm x 30 cm, applying an organic fertilizer atrqponmlkjihgfedcbaZYXWVUTSRQPONMLKJIHGFEDCBA1 kg/m2 in the land preparation, but no chemical fertilizer. The weeding was performed every 10 days in the period between 10 and 40 days after transplantation supplying local indigenous microorganism to enhance biological activity in the soils (Uphoff et aI., 2011).
Table 1 Cultivation eriod of each cro in season
Period Planting date Harvesting date
Rainy First 14 October 2010
Season
8 February 2011
Second 20 August 2011 15 December 2011 Dry - Rainy
Third 22 March 2012 5 July 2012 Rainy - Dry
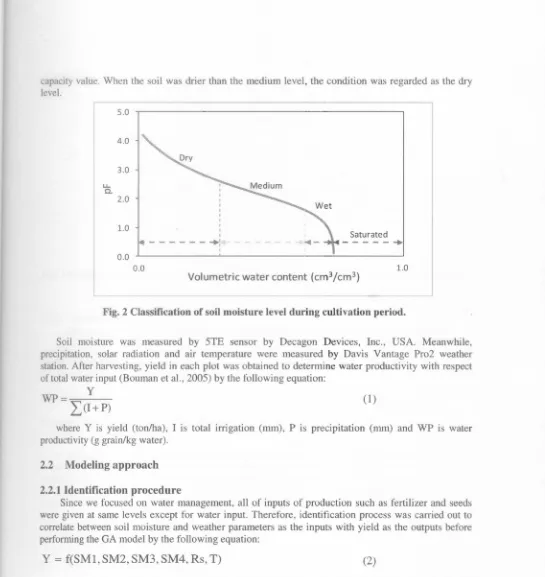
Each plot was irrigated under non-flooded condition with different soil moisture level in each growth stage. Here, during cultivation period, growth stage was divided into four stages, i.e., initial, crop development, mid-season and late season stages (AlIen et aI., 1998; Mohan and Arumugam, 1994; Tyagi et aI., 2000; Vu et aI., 2005). Also, soil moisture level was classified into three levels i.e. wet (W), medium (M) or dry (D) based on the soil water retention curve as presented in Fig. 2. The wet level was achieved when pF value was between 0 and 1.6 which was the air entry value for this soil. The medium level was achieved when pF value was between 1.6 and 2.54 which was the field
capacity value. When the soil was drier than the medium level, the condition was regarded as the dry level.
5.0
4.0
3.0rqponmlkjihgfedcbaZYXWVUTSRQPONMLKJIHGFEDCBA
LI.. C.
2.0
1.0
0.0 0.0
I I I I
I I I
I I I
I
- - - +:
I
Saturated
[image:8.571.14.559.28.605.2]Volumetric water content (cm3/cm3)
Fig. 2 Classification of soil moisture level during cultivation period.
1.0
Soil moisture was measured by 5TE sensor by Decagon Devices, Inc., USA. Meanwhile,
precipitation, solar radiation and air temperature were measured by Davis Vantage Pr02 weather station. After harvesting, yield in each plot was obtained to determine water productivity with respect of total water input (Bouman et al., 2005) by the following equation:
WP= Y (1)
I(I+P)
where Y is yield (ton/ha), I is total irrigation (mm), P is precipitation (mm) and WP is water productivity (g grain/kg water).
2.2 Modeling approach
2.2.1 Identification procedure
Since we focused on water management, all of inputs of production such as fertilizer and seeds were given at same levels except for water input. Therefore, identification process was carried out to correlate between soil moisture and weather parameters as the inputs with yield as the outputs before performing the GA model by the following equation:
Y
=
f(SMl, SM2, SM3, SM4, Rs, T) (2)where, Y is yield (ton/ha), Rs is total solar radiation (Ml/mvseason), T is average air temperature ("C), SM1, SM2, SM3, SM4 are the average soil moisture for initial, crop development, mid-season, and late season stages (cm3/cm3). Since there is no mathematical equation from previous research because of the complexity of this relationship, we implemented neural networks model to show its correlation because neural networks model deals with complex system such as in agricultural system (Hashimoto, 1997). The model consisted three layers, i.e. input, hidden and output layers as presented in Fig.3.
vu
rqponmlkjihgfedcbaZYXWVUTSRQPONMLKJIHGFEDCBADu laMl
C)
0
.s
20
· 0
S 3
0
-0
V
a.
0
5
T
0
0
Fig. 3 Structure of neural networks model to estimate yield based on environmental parameters.
2.2.2 Optimization procedure
Optimization process was carried out by the GA model by the following objective function:
(3)
Maximize F, subject to:
SlvlminS SMl,SM2,SM3,SM4::; SMmax
(4)
where, a, and b, are weights for yield and water productivity and their values are 0.5 and 0.5, respectively. SMmin and SMmax are the minimum and maximum soil moisture levels from the empirical data during three cropping seasons (cnr'zcrrr'). Since both yield and water productivity have different units, their values were normalized using the maximum and minimum values based on empirical data.
3. Results and Discussion
3.1 Meteorological conditions
Table 2 summarizes the climatic data during the experiments in three seasons. There are two seasons in Indonesia classified based on the pattern of precipitation. Here, precipitation among seasons was quite different in which the highest intensity occurred in the first season with total precipitation of l332 mm in rainy season. Consequently, different pattern in precipitation corresponded to the different pattern of solar radiation. The lowest solar radiation occurred in the first season with total values of
1464 MJ/m2/season. Meanwhile, temperatures among the seasons were quite same in which maximum temperature was 32.8°C and minimum temperature was 16.2°C in the second season.
a e eteororqponmlkjihgfedcbaZYXWVUTSRQPONMLKJIHGFEDCBA0211 ata urmg experiments
Precipitation Temperature CC) Solar radiation
Seasons (mm) Minimum Average Maximum (MJ/m2/season)
I (Rainy) 1332 19.5 23.5 31.9 1464
IT (Dry-Rainy) 626 16.2 24.0 32.8 1827
ill(Rainy-Dry) 551 17.4 24.3 32.3 1829
T bl 2M ical d d
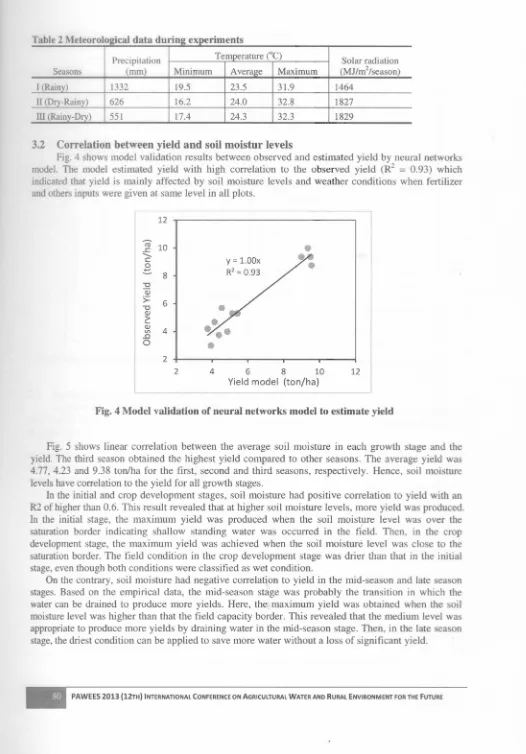
[image:10.574.27.553.71.825.2]3.2 Correlation between yield and soil moistur levels
Fig. 4 shows model validation results between observed and estimated yield by neural networks model. The model estimated yield with high correlation to the observed yield (R2
= 0.93) which indicated that yield is mainly affected by soil moisture levels and weather conditions when fertilizer and others inputs were given at same level in all plots.
12
ro
10
..c
-
c0 .::.
8
"0 W I
>=
6
"0 W
>
•....
w
4
Vl
.!l
0 2
2
y
=
1.00x R2=0.934 6 8 10 12
Yield model (ton/ha)
Fig. 4 Model validation of neural networks model to estimate yield
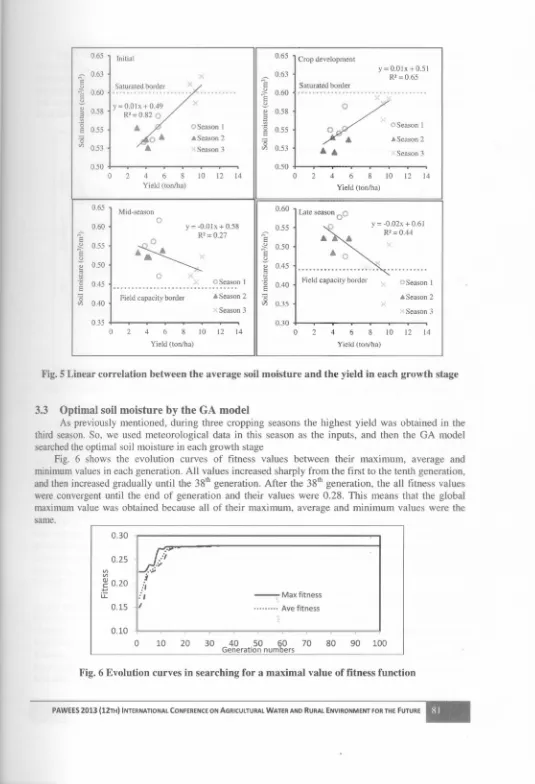
Fig. 5 shows linear correlation between the average soil moisture in each growth stage and the yield. The third season obtained the highest yield compared to other seasons. The average yield was 4.77, 4.23 and 9.38 ton/ha for the first, second and third seasons, respectively. Hence, soil moisture levels have correlation to the yield for all growth stages.
In the initial and crop development stages, soil moisture had positive correlation to yield with an R2 of higher than 0.6. This result revealed that at higher soil moisture levels, more yield was produced. In the initial stage, the maximum yield was produced when the soil moisture level was over the saturation border indicating shallow standing water was occurred in the field. Then, in the crop development stage, the maximum yield was achieved when the soil moisture level was close to the saturation border. The field condition in the crop development stage was drier than that in the initial stage, even though both conditions were classified as wet condition.
On the contrary, soil moisture had negative correlation to yield in the mid-season and late season stages. Based on the empirical data, the mid-season stage was probably the transition in which the water can be drained to produce more yields. Here, the maximum yield was obtained when the soil moisture level was higher than that the field capacity border. This revealed that the medium level was appropriate to produce more yields by draining water in the mid-season stage. Then, in the late season stage, the driest condition can be applied to save more water without a loss of significant yield.
0.65 Initial 0.65 Crop development
0.63 0.63 Y = O.OlxrqponmlkjihgfedcbaZYXWVUTSRQPONMLKJIHGFEDCBA+0.51
~ ~ R2=0.65
~ 0.60 Saturated border
...
~ 0.60... ...
Saturated border.
..
.
e s
~ y = O.Olx+0.49LKJIHGFEDCBA e .
/
i!! 0.58 0.58
~ R2=0.820 ~i!!
'0
0.55
•
Season I '0 0.55 o OSeason Ie a
'0
o·
.• Season 2 '0 • ..Season 2VI
0.53
•
Season 3 VI 0.53••
Season 30.50 0.50
0 2 4 6 8 10 12 14 0 2 4 6 8 10 12 14
Yield (ton/ha) Yield (ton/ha)
0.65
Mid-season 0.60
0 y = -0.02x +0.61
0.60 y = -O.Olx+0.58 0.55
~ R2=0.27 ~ R2=0.44
~ 0.55 (J 0.50 n-e 0 ~ ~
i!! 0.50 i!! 0.45
...
...
~ 0 ~ Field capacity border
'0 0.45 OSeason I '0 0.40 OSeason I
e
...
s'0 Field capacity border .• Season 2
~ "Season 2
VI 0.40 0.35
Season 3 Season 3
0.35 0.30
0 2 4 6 8 10 12 14 0 2 4 6 8 10 12 14
[image:11.564.15.550.54.838.2]Yield (ton/ha) Yield (ton/ha)
Fig. 5 Linear correlation between the average soil moisture and the yield in each growth stage
3.3 Optimal soil moisture by the GA model
As previously mentioned, during three cropping seasons the highest yield was obtained in the third season. So, we used meteorological data in this season as the inputs, and then the GA model searched the optimal soil moisture in each growth stage
Fig. 6 shows the evolution curves of fitness values between their maximum, average and
minimum values in each generation. All values increased sharply from the first to the tenth generation, and then increased gradually until the 38th generation. After the 38th
generation, the all fitness values were convergent until the end of generation and their values were 0.28. This means that the global maximum value was obtained because all of their maximum, average and minimum values were the same.
0.30
-- Max fitness
..•.••••• Ave fitness
0.25
-d?
,..
.
.,
-.~
.';;' i/,
I t I VI VI:g
0.20 .•... u:: 0.15 0.10o
10 20 30 40 50 60 70Generation numbers 80 90 100
Fig. 6 Evolution curves in searching for a maximal value of fitness function
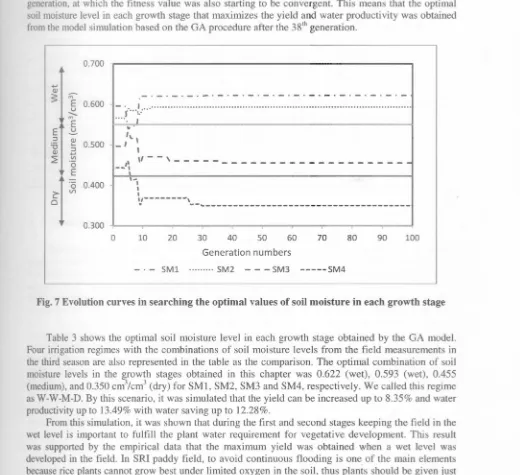
Fig. 7 shows the evolution curves of soil moisture level in each growth stage in obtaining fitness values in Fig. 6. SMl and SM2 converged faster than the other growth stages; their values reached the asymptote before the tenth generation. Meanwhile, SM3 became convergent most slowly; in the 38th
generation, at which the fitness value was also starting to be convergent. This means that the optimal soil moisture level in each growth stage that maximizes the yield and water productivity was obtained from the model simulation based on the GA procedure after the 38th
generation.
0.700 -rqponmlkjihgfedcbaZYXWVUTSRQPONMLKJIHGFEDCBA
•..
<11LKJIHGFEDCBA s : ~ E 0.600 u <, m E E u ::J <11"tl
•..
::J 0.500<11
•..
~ VI ·0 E{··t:···
.
4-L
'\.-,
\ \ I',,--,---
,
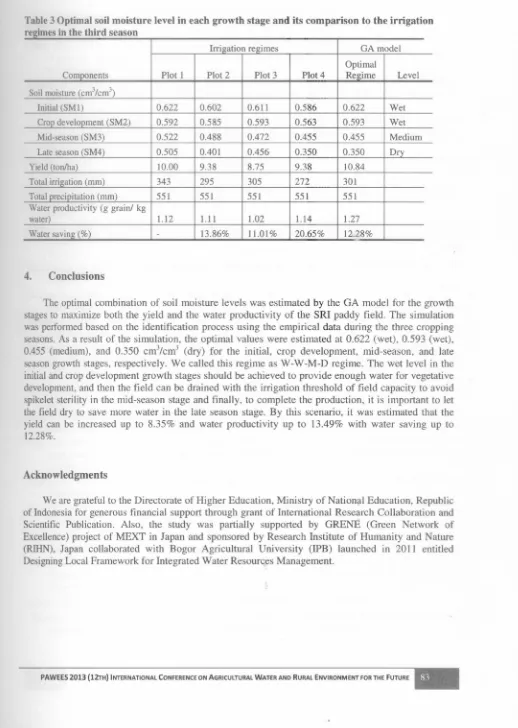
Table 3 shows the optimal soil moisture level in each growth stage obtained by the GA model. Four irrigation regimes with the combinations of soil moisture levels from the field measurements in the third season are also represented in the table as the comparison. The optimal combination of soil moisture levels in the growth stages obtained in this chapter was 0.622 (wet), 0.593 (wet), 0.455 (medium), and 0.350cm3
/cm3
(dry) for SM1, SM2, SM3 and SM4, respectively. We called this regime as W-W-M-D. By this scenario, it was simulated that the yield can be increased up to 8.35% and water productivity up to 13.49% with water saving up to 12.28%.
From this simulation, it was shown that during the first and second stages keeping the field in the wet level is important to fulfill the plant water requirement for vegetative development. This result was supported by the empirical data that the maximum yield was obtained when a wet level was developed in the field. In SRI paddy field, to avoid continuous flooding is one of the main elements because rice plants cannot grow best under limited oxygen in the soil, thus plants should be given just enough water at saturated condition to meet their requirement for root, stem and tiller development (Uphoff et al., 2011).
Then, the field can be drained into the medium level in the third stage when the plants focusing on the reproductive stage (flowering and panicle development). The medium level is important in developing aerobic condition to avoid spikelet sterility particularly around the flowering time (Bouman et aI., 2005). Finally, the field should be drained into dry level in the last stage when plant water requirement is minimum to save water as reported in the previous studies (Doorenbos and Kassam, 1979; Uphoff et aI., 2011; Zawawi et al., 2010). This recommendation was also supported by the empirical data that medium and dry levels in the mid-season and late season stages resulted in the maximumyield. ,~
,
,
,
,,---I
.
--~---o 0.400 ~ Vl Cl 0.30020 30 40 50 60 70 80 90
o
10Generation numbers
[image:12.563.23.543.141.616.2]-. - SM1 SM2 - - - SM3 ---SM4
Fig. 7 Evolution curves in searching the optimal values of soil moisture in each growth stage
100
Table 3 Optimal soil moisture level in each growth stage and its comparison to the irrigation
. . th thi d
reznnesID e If season
Irrigation regimes GA model
Optimal
Components Plot 1 Plot 2 Plot 3 Plot 4 Regime Level
Soil moisture (cm3!cm3)
Initial (SM1) 0.622 0.602 0.611 0.586 0.622 Wet
Crop development (SM2) 0.592 0.585 0.593 0.563 0.593 Wet
Mid-season (SM3) 0.522 0.488 0.472 0.455 0.455 Medium
Late season (SM4) 0.505 0.401 0.456 0.350 0.350 Dry
Yield (ton/ha) 10.00 9.38 8.75 9.38 10.84
Total irrigation (mm) 343 295 305 272 301
Total precipitation (mm) 551 551 551 551 551
Water productivity (g grain! kg
water) 1.12 1.11 1.02 1.14 1.27
Water saving (%)rqponmlkjihgfedcbaZYXWVUTSRQPONMLKJIHGFEDCBA- 13.86% 11.01 % 20.65% 12.28%
4. Conclusions
The optimal combination of soil moisture levels was estimated by the GA model for the growth stages to maximize both the yield and the water productivity of the SRI paddy field. The simulation was performed based on the identification process using the empirical data during the three cropping seasons. As a result of the simulation, the optimal values were estimated at 0.622 (wet), 0.593 (wet), 0.455 (medium), and 0.350 cmLKJIHGFEDCBA3
/cm3
(dry) for the initial, crop development, mid-season, and late season growth stages, respectively. We called this regime as W-W-M-D regime. The wet level in the initial and crop development growth stages should be achieved to provide enough water for vegetative development, and then the field can be drained with the irrigation threshold of field capacity to avoid spikelet sterility in the mid-season stage and finally, to complete the production, it is important to let the field dry to save more water in the late season stage. By this scenario, it was estimated that the yield can be increased up to 8.35% and water productivity up to 13.49% with water saving up to 12.28%.
Acknowledgments
We are grateful to the Directorate of Higher Education, Ministry of National Education, Republic of Indonesia for generous financial support through grant of International Research Collaboration and Scientific Publication. Also, the study was partially supported by GRENE (Green Network of Excellence) project of MEXT in Japan and sponsored by Research Institute of Humanity and Nature (RIHN), Japan collaborated with Bogor Agricultural University (IPB) launched in 2011 entitled Designing Local Framework for Integrated Water Resources Management.
References
Alien, R.G., Pareira, L.S., Raes, D., Smith, M., 1998, Crop Evapotranspiration Guidelines for computing crop water requirements. FAO - Food and Agriculture Organization of the United Nations, Rome.
Banson, 1., Uphoff, N., 2011, Rice yield and its relation to root growth and nutrient-use efficiency under SRI and conventional cultivation: an evaluation in Madagascar. Paddy Water Environ 9, 65-78.
Barker, R., Dawe, D., Tuong, T.P., Bhuiyan, S.L, Guerra, L.c., 2000, The outlook for water resources in the year 2020: challenges for research on water management in rice production. International Rice Commission Newsletter 49, 7-21.
Bouman, B.A.M., S.Peng., Castaneda, A.R., Visperas, R.M., 2005, Yield and water use of irrigated tropical aerobic rice systems. Agr Water Manage 74, 87-105.
Chapagain,T., Yamaji, E., 2010, The effects of irrigation method, age of seedling and spacing on crop performance, productivity and water-wise rice production in Japan. Paddy Water Environ 8, 81-90.
Choi, J.D., Park, WJ., Park, K.W., Lim, K.J., 2012, Feasibility of SRI methods for reduction of irrigation and NPS pollution in Korea. Paddy Water Environ published online by Springerlink Feb. 9.
Dobermann, A., 2004, A critical assessment of the system of rice intensification (SRI). Agr Syst 79, 261-281.
Doorenbos, J., Kassam, A.H., 1979, Yield response to water. FAO Irrigation and Drainage Paper 33. FAO, Rome.
Goldberg, D.E., 1989, Genetic algorithms in search optimization and machine learning.
Addison-Wesley, Reading, Massachusetts.
Hameed, K.A., Mosa, A.K.J., Jaber, F.A., 2011, Irrigation water reduction using System of Rice Intensification compared with conventional cultivation methods in Iraq. Paddy Water Environ 9, 121-127.
Hashimoto, Y., 1997, Applications of artificial neural networks and genetic algorithms to agricultural systems. Comput Electron Agr 18, 71-72.
Kuo, S.F., Merkley, G.P., Liu, C.W., 2000, Decision support for irrigation project planning using a genetic algorithm. Agr Water Manage 45,243-266.
Lin, X.Q., Zhu, D.F., Lin, X.J., 2011, Effects of water management and organic fertilization with SRI crop practices on hybrid rice performance and rhizosphere dynamics. Paddy Water Environ 9, 33-39.
Mohan, S., Arumugam, N., 1994, Irrigation crop coefficient for lowland rice. Irrigation and Drainage Systems 8,159-176.
Raju, K.S., Kumar, D.N., 2004, Irrigation planning using Genetic Algorithms. Water Resour Manag 18,163-176.
Sato, S., Yamaji, E., Kuroda, T., 2011, Strategies and engineering adaptions to disseminate SRI methods in large-scale irrigation systems in Eastern Indonesia. Paddy Water Environ 9, 79-88. Sheehy,J.E., Peng, S., Dobermann, A., Mitchell, P.L., Ferrer, A., Yang, J.c., Zou, Y.B., Zhong, X.H.,
Huang, J.L., 2004, Fantastic yields in the system of rice intensification: fact or fallacy? Field Crop Res 88, 1-8.
Sinclair,T.R., Cassman, K.G., 2004, Agronomic UFOs. Field Crop Res 88, 9-10.
Thomas, V., Ramzi, A.M., 2011, SRI contributions to rice production dealing with water management
constraints in northeastern Afghanistan. Paddy Water Environ 9, 101-109.rqponmlkjihgfedcbaZYXWVUTSRQPONMLKJIHGFEDCBA
Tyagi, N.K., Sharma, D.K., Luthra, S.K., 2000, Determination of evapotranspiration and crop coefficients of rice and sunflower with lysimeter. Agr Water Manage 45, 41-54.
Uphoff, N., Kassarn, A., Harwood, R., 2011, SRI as a methodology for raising crop and water productivity: productive adaptations in rice agronomy and irrigation water management. Paddy Water Environ 9, 3-1l.
Van der Hoek, W., Sakthivadivel, R., Renshaw, M., Silver, J.B., Birley, M.H., Konradsen, F., 2001, Alternate wet/dry irrigation in rice cultivation: a pratical way to save water and control malaria and Japanese encephalitis?, Research Report 47. International Water Management Institute, Colombo, Sri Lanka.
Vu, S.H., Watanabe, H., Takagi, K., 2005, Application of FAO-56 for evaluating evapotranspiration in simulation of pollutant runoff from paddy rice field in Japan. Agr Water Manage 76, 195-210. Wardlaw, R., Bhaktikul, K., 2004, Application of genetic algorithms for irrigation water scheduling.
Irrig Drain 53, 397-414.
Zawawi, M.A.M., Mustapha, S., Puasa, Z., 2010, Determination of water requirement in a paddy field at seberang perak rice cultivation area. Journal - The institution of Engineers 71, 32-4l.
Zhang, B., Yuan, S.Q., Zhang, J.S., Li, H., 2008, Study of corn optimization irrigation model by genetic algorithms, IFIP International Federation for Information Processing. Springer, pp. 121-132.
Zhao, L.M., Wu, L.H., Wu, M.Y., Li, Y.S., 2011, Nutrient uptake and water use efficiency as affecte
by modified rice cultivation methods with reduced irrigation. Paddy Water Environ 9, 25-32.rqponmlkjihgfedcbaZYXWVUTSRQPONMLKJIHGFEDCBA