UNIVERSITI TEKNIKAL MALAYSIA MELAKA
PRODUCTION LOSSES ANALYSIS OF AN AUTOMOTIVE
COMPONENT USING GENERAL LINEAR MODEL
This report submitted in accordance with requirement of the Universiti Teknikal Malaysia Melaka (UTeM) for the Bachelor Degree of Manufacturing Engineering
(Manufacturing Management) with Honours.
by
ZAREN MUKRISH BIN ZAINAL ARIFFIN
DECLARATION
I hereby declare that this report entitled “PRODUCTION LOSSES ANALYSIS OF AN AUTOMOTIVE COMPONENT USING GENERAL LINEAR MODEL” is the
result of my own research except as cited in the references.
Signature :
Author’s name : Zaren Mukrish Bin Zainal Ariffin
APPROVAL
This report is submitted to the Faculty of Manufacturing Engineering of UTeM as a partial fulfillment of the requirements for the degree of Bachelor of Manufacturing Engineering (Manufacturing Management). The members of the supervisory committee are as follow:
En. Abdul Rahman B. Mahmood (PSM Supervisor)
i ABSTRACT
ii ABSTRAK
iii
ACKNOWLEDGEMENT
Assalamualaikum Warahmatullahi Wabarakatuh.
By the name of Allah, the Most Gracious and the Most Merciful, many thanks for His blessing in giving me the opportunity to finish my industrial training and the report successfully.
First, a lot of thanks to En. Abdul Rahman B. Mahmood for his supervision during this project phase starting from day one. His guidance and support throughout the project had helped a lot, especially being a great mentor for me, keeping all the technical facts and information straights. Thanks also to my friends that are under En. Abdul Rahman supervision as well for their contribution by assisting me in the early stages of this project, sharing ideas and insight on the project.
I would also want to show my deepest thanks to beloved my parent whom had given me moral, guidance and financial support throughout the project. I hope that with the knowledge and experienced that I gain from this project will be useful when I work at relevant work place in future.
iv
v
2.4.2 Setup and Adjustments 15
2.4.3 Idling 16
2.4.4 Scrap and Rework 16
2.4.5 Reduced Speed Operation 16
2.4.6 Performance Rate 17
2.5 Analysis of Variance (ANOVA) 18
2.5.1 General Linear Model 18
vi
3.4.1.3 General Linear Model 27
3.4.2 Tools / Techniques / Resources 28
4.2.1 General Linear Model: Losses versus 37 Month, Week, Shift, Hour
4.2.1.1 S, R-Sq and R-Sq(adj) Values 38 4.2.1.2 Unusual Observation Table 39 4.2.1.3 Least Squares Means for Losses 40
4.2.2 Tukey Method Pairwise Comparisons 42
4.2.2.1 Confidence Interval Month 42
4.2.2.2 Confidence Interval Week 44
4.2.2.3 Confidence Interval Shift 45
4.2.2.4 Confidence Interval Hour 45
vii
4.2.3.1 Month 48
4.2.3.2 Week 50
4.2.3.3 Shift 51
4.2.3.4 Hour 51
4.2.4 Normal Probability Plot of Residuals for Losses Graph 57 4.2.5 Histogram of Residuals for Losses Graph 58 4.2.6 Residuals versus Fitted Values Graph 59 4.2.7 Residuals versus order for Losses Graph 60 4.2.8 Main Effects Plot (fitted means) for Losses Graph 61 4.2.9 Interaction Plot (fitted means) for Losses Graph 62 4.2.9.1 Interaction Plot Graph (Month vs. Week) 64 4.2.9.2 Interaction Plot Graph (Month vs. Shift) 65 4.2.9.3 Interaction Plot Graph (Month vs. Hour) 66 4.2.9.4 Interaction Plot Graph (Week vs. Shift) 67 4.2.9.5 Interaction Plot Graph (Week vs. Hour) 68 4.2.9.6 Interaction Plot Graph (Shift vs. Hour) 69
4.3 Discussion 70
4.3.1 Significant Factors 70
4.3.2 Highest and Lowest Average Production Losses 71
viii
5. RESULT AND ANALYSIS 75
5.0 Conclusion 75
5.1 Recommendation for further study 76
ix
LIST OF TABLES
2.1 Major Losses Classification (Nachiappan et al 2005) 17
3.1 Gantt Chart PSM I 25
3.2 Gantt Chart PSM II 26
3.3 Possible parameters that selected as factors 31
4.1 Example of sorted data table 36
4.2 General Linear Model Data Table 37
4.3 Analysis of Variance for Losses, using Adjusted SS for Tests 37
x
LIST OF FIGURES
2.1 External effect of the five performance objectives 7 2.2 Precedence Diagram of the Semiautomatic Line Model 12
3.1 Procedure flow chart 22
3.2 Full factorial design method process flow 30
4.1 Sample of Production Shift Productivity Control 34
4.2 Unusual Observation for Losses 39
4.3 Least Squares Means for Losses (%) 40
xi
4.13 Tukey 95.0% Simultaneous Hypothesis Test for Hour 3 53 4.14 Tukey 95.0% Simultaneous Hypothesis Test for Hour 4 53 4.15 Tukey 95.0% Simultaneous Hypothesis Test for Hour 5 54 4.16 Tukey 95.0% Simultaneous Hypothesis Test for Hour 6 54 4.17 Tukey 95.0% Simultaneous Hypothesis Test for Hour 7 55 4.18 Tukey 95.0% Simultaneous Hypothesis Test for Hour 8 55 4.19 Tukey 95.0% Simultaneous Hypothesis Test for Hour 9 56 4.20 Normal Probability Plot of the Residual Graph 57
4.21 Histogram of the Residuals for Losses Graph 58
4.22 Residuals vs. the Fitted Values Graph 59
4.23 Residual vs. Order for Losses Graph 60
4.24 Main Effect Plot for Losses 61
4.25 Interaction Plot for Losses Graph 63
xii
LIST OF ABBREVIATIONS
UTEM - Universiti Teknikal Malaysia FKP - Fakulti Kejuruteraan Pembuatan GLM - General Linear Model
AFTA - ASEAN Free Trade Area ANOVA - Analysis of Variance SMI - Small Medium Industries MPS - Master Production Schedule CRP - Capacity Requirement Planning MRP - Manufacturing Resource Planning
WIP - Work-in-progress
PFD - Process Flow Diagram
PSPC - Production Shift Productivity Control
1 Manufacturing companies must not only compete locally but also on a global basis. Reducing manufacturing costs without sacrificing product quality is vital for the survival of manufacturing companies in a global market. The automotive industry is not spared from the effects of globalization. The local Malaysian automotive manufacturers are faced with this tough competition as the selling price is not much different from foreign brands especially with the implementation of the ASEAN Free Trade Area (AFTA). Demand for foreign cars will probably soar; more so for cars that are assembled locally as the price becomes cheaper.
2
productivity is through Industrial Engineering (IE). Industrial Engineering is concerned with the design, improvement, and installation of integrated systems of people, materials, information, equipment, and energy. It draws upon specialized knowledge and skill in the mathematical, physical, and social sciences together with the principles and methods of engineering analysis and design to specify, predict, and evaluate the results to be obtained from such systems. Some of the commonly used tools to solve productivity problems in IE include work study, line-balancing, quality control, production planning and control, simulation, facility planning, and others. These techniques are aimed at achieving smooth and undisrupted factory operation, increasing efficiency and effectiveness through better utilization of resources.
The processing capability of computers has increased by leaps and bounds over the past decades. Together with the improved visualization capabilities of graphic processing units, complex computer generated graphics, more and more software applications dedicated for solving industrial problems are available in the market. The use of statistical software to analyze problems as well as to generate complete analysis has risen significantly. Realizing the potential benefits of computer software in a manufacturing environment, statistical software called Minitab is used in this study to conduct analysis on the production losses.
This paper begins with a brief description of the case study company and followed by problem identification and descriptions of the problems. Based on the problems identified, the construction of the data matrix table is developed before identifying the dependent and independent variables that will be used for analyzing the losses. This is followed by discussions of the evaluation results and culminates with conclusions drawn from the findings of this study.
1.2 Problem Statement
3
The automotive component manufacture company is part of small medium industry (SMI) that produces automotive components parts to local car manufacturers. In order to establish good partnerships with the local car manufacturers, the company
needed to be able to supply and meet the customers’ demands over the years.
However based on the problem identification process, it can be seen that there is machining problems that led to productivity losses in terms of quantity units produced per hour (UPH). The machining problems affected the total units produced
which didn’t achieve the target UPH and thus led to overtime and increase costs of
operators, machines and also reworks of defects products.
4
1.3 Objectives
This project is based on the relevant SMI issues regarding the machining line for Proton BLM car components. The purpose of this study is stated as below:
a) To study the effect of experimental dependent variables (Month, Week, Shift, and Hour) over independent variables (Percentage of production losses) on the production losses.
b) To investigate the significance of dependent variables (Month, Week, Shift, and Hour) over the independent variables (Percentage of production losses) using General Linear Model approach.
1.4 Scope
5
CHAPTER 2
LITERATURE REVIEW
2.0 Introduction
In this second chapter, the report will includes details on the theories and scholarly details that had been derived from various sources such as journals, books, and case studies. The following theories that were included are related with the title of the project which is the investigation of factors influencing machining loss time in production.
The study is about the investigation of factors influencing machining loss time in production at a manufacturing company producing automotive parts. The project will cover the study of factors that influence machining by using the approach of General Linear Model (GLM) a sub component in Analysis of Variance (ANOVA) from Minitab software.
2.1 Productivity
6
The development of SMIs is top on the national development agenda, as reflected in the Ninth Malaysia Plan and the Third Industrial Master Plan.
Productivity is define as the total output over total input in the organization in which it has becomes the measurement of how well resources are combined and used to accomplish specific, desirable result. Such measurement will set that low productivity is bad while high productivity is highly valued and more sought after. However, since the term is widely used in industry, many researchers seem to be having different opinion and their own definition. Argument about productivity as one of the most important basic variables as basic variable governing economic production activities also had been addressed. More different terms can also be
referred in journal of “Demystifying productivity and performance” by Stefan Tangen (2003).
Productivity always synonym with profitability in organization, thus making it harder to be neglected as the link between productivity and profitability is significant. However due to some circumstances, profitability also can changed for reasons that have to do with productivity as for instance cost or price inflation or external condition that may bear no relationship to efficient use of resources (Stefan et al,
2005). But still, increasing productivity doesn’t necessarily lead to increased
profitability in short term but usually effective in long term (Tangen, 2002).
Other than profitability, productivity also looks after performance issues as well. The performance mentioned covers both overall economic and operational aspect in the organization.
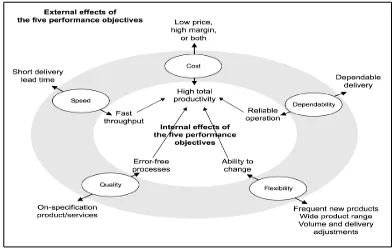
7
1) High-quality operations do not waste time or effort having to re-do things, nor are their internal customers inconvenienced by flawed service.
2) Fast operations reduce the level of in-process inventory between micro operations, as well as reducing administrative overhead.
3) Dependable operations can be relied on to deliver exactly as planned. This eliminates wasteful disruption and allows the other micro operations to operate efficiently.
4) Flexible operations adapt to changing circumstances quickly and without disrupting the rest of the operation. Flexible micro operations can also change over between tasks quickly and without wasting time and capacity.
5) Low cost operations lead to higher profits as well as allowing the company to sell their products to a competitive price.
Figure 2.1: External effect of the five performance objectives (Slack et al, 2001)
8
environment the input will comprise elements such as: materials, labour, energy, capital use and so on. The use of these items has to be established and combined in some way.
Based on the elements, labour productivity had been covered vastly throughout the years as researchers and industries had tried to maximize the labours capabilities and resources. In order to measure the reliability of the labour, hence labor productivity had been used to shows it. In its simplest form, labor productivity could be defined as the hours of work divided by the units of work accomplished (Enshassi et. al, 2006). Although it was defined like this, there are still other factors that influence it as well. Factors such as site conditions, workers’ competence, materials availability, weather,
motivation, supervision can influence the labour’s productivity. Recent studies also
indicate that job satisfaction as one of the main factors now.
Besides that, since most of recent manufacturing organization operates in globally competitive environment, be it as suppliers of parts or assembling the parts, room for improvement must be put into priority. Pressures of reducing costs while improving customer satisfaction and service as well as improving cycle time and quality improvement really create pressures in order to perform.
Thus, opportunity that comes from improving labor productivity based on line balancing to improve cycle time and outputs is regard highly by company. However, since the products also are produced by machining, reduced production losses and machining loss time are also critical in improving productivity.
All these different definitions of productivity have one thing in common: there is an input and that there is an output. The critical issue that needs to be determined is what the inputs for a specific output are. It is believed that the cause of productivity level is the direct result of factors such as:
1) Choice of technology- Firms opting for machinery with narrow product focus, high output and low manufacturing flexibility or machinery with wide product focus, reasonable output and high manufacturing flexibility.