SUPERVISOR DECLARATION
“I hereby declare that I have read this thesis and in my opinion this report is sufficient in terms of scope and quality for the award of the degree of
Bachelor of Mechanical Engineering (Plant and Maintenance)”
Signature : ...
Supervisor : Dr. Roszaidi Bin Ramlan
i
RESEARCH VIRATION ON
WIDEBAND LINEAR RESONANT GENERATOR ENERGY HARVESTING DEVICE FOR REMOTE SENSING APPLICATIONS
YONG ZI WHA
This report is submitted as to fulfill the requirement for the award of the degree of
Bachelor of Mechanical Engineering (Plant and Maintenance)
Faculty of Mechanical Engineering Universiti Teknikal Malaysia Melaka
ii
DECLARATION
“I hereby declare that the work in this report is my own except for summaries and quotations which have been duly acknowledged.”
Signature : ...
Author : Zi Wha Yong
iii
iv
ACKNOWLEDGEMENTS
First of all, I would like to thank Universiti Teknikal Malaysia Melaka (UTeM) for giving me a chance to carry out this project. In here, I would like to express my appreciation for those who have guided and supported me through my final year project.
In particular, I would like to express in depth gratitude to my project’s supervisor, Dr. Roszaidi Bin Ramlan, for his support and direction that he has provided to the project from the beginning to the end. He is also imparting his ingenious and optimistic research approach upon me.
I also greatly appreciate the help of my senior, Peising, who has been helped me to understand the mechanical side of energy harvesting device as well as helping me in conducting the experiment.
v
ABSTRACT
vii
3.4.2 Quasi-Static Experiment 28
3.4.3 Dynamic Testing of Transfer Function 31
viii
CHAPTER IV ANALYTICAL STUDY 35
4.1 Mass Excitation of Spring-Mass-Damper 35
4.2 Base Excitation of Spring-Mass-Damper 38
4.3 Analytical Research on Practical Limitations 40
4.4 Limitation of the Linear Harvesting Device 41
4.5 Damping Measurement 41
4.5.1 Time Domain 42
4.5.2 Frequency Domain 43
CHAPTER V RESULT AND ANALYSIS 44
5.1 Free Vibration 44
5.2 Quasi-Static Experiment 45
5.2.1 Matlab Simulation 47
5.3 Dynamic Testing of Transfer Function 49
5.4 Dynamic Testing For Voltage Measurement 53
5.4.1 Open Circuit 53
5.4.2 Experiment with Various Resistance 57
5.4.3 Optimum Power Harvested 60
CHAPTER V I DISCUSSION 62
CHAPTER VIII CONCLUSION AND RECOMMENDATION 66
REFERENCES 67
ix
LIST OF FIGURES
NO. TITLE PAGE
1.1 Hierarchy of main energy harvesting technologies 2
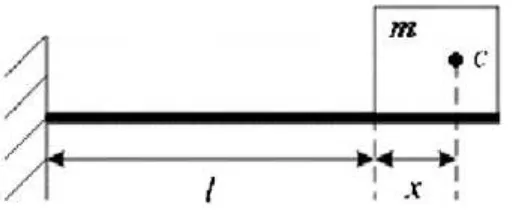
2.1 Cantilever with a mass 7
2.2 Side view of the cantilever structure 7
2.3 Axial tensile (a) and compressive (b) load on clamped-free cantilever. 8
2.4 Axial tensile (a) and compressive (b) load on clamped-clamped beam. 9
2.5 Schematic of tunable generator and experimental setup 9
2.6 Resonance curves with various press stresses 10
2.7 Modal of single magnet and coil 11
2.8 Modal of repulsive stacked multilayer magnets and independent coils 11
2.9 Photograph of the whole device 12
2.10 Experiment setup of the tunable energy harvesting system 13
2.11 Schematic of self-tuning system 13
2.12 Estimation of net power by proposed technique 14
2.13 Schematic of the piezoelectric device 14
2.14 Sari’s wideband electromagnetic generator 16
2.15 Modal of utilizing stopper to increase the bandwidth 16
x
2.17 Power spectrum for an optimized two-mass system 18
2.18 Drawing of mechanically bi-stable device 19
2.19 Picture of meso-scale prototype 19
3.1 Process Flow of the Research 22
3.2 Experimental Modal Diagram 24
3.3 Experimental Setup (Prototype) 25
3.4 Experiment Test Set-up for the Free Vibration Experiment. 27
3.5 Photograph of Actual Experiment Set up for Quasi-static Experiment 28
3.6 The Installment of the Shaker with LVDT and Force Gauge 29
3.7 Block Diagram of the Process Flow 29
3.8 The Photograph of SDOF on Steel Beam 30
3.9 Photograph of Actual Experiment Set-up for Dynamic Testing 31
3.10 The Photograph of SDOF on Steel Beam Installed on
Electromagnetic Shaker with 2 Accelerometer 32
3.11 Photograph of Actual Experiment Set-up for Dynamic Measurement
(Open Circuit) 32
3.12 Photograph of SDOF on Steel Beam with Copper Coils and Voltmeter 33
3.13 Photograph of Actual Experiment Set-up for Dynamic Measurement
(With Resistance Decade Box) 34
4.1 Spring mass damper: Force applied directly to the mass 35
4.2 Free Body Diagram 36
4.3 Spring mass damper 38
xi
4.5 Motion Decay Response 42
4.6 Half power bandwidth method response 43
5.1 Example of Raw Data for Free Vibration (38 mm) 44
5.2 Graph of Voltage Generated From the Force Gauge and LVDT 45
5.3 Graph of Force against Displacement for 36 mm 47
5.4 Graph of Force against Displacement for 38 mm 47
5.5 Graph of Force against Displacement for 40 mm 48
5.6 Graph of Tranmissibility for 36 mm 49
5.15 Graph of Voltage against Frequency with Different Length. 56
5.16 Raw Data of Dynamic Measurement with Resistor box for 36 mm 57
5.17 Graph of Voltage against Frequency Various Resistance for 36 mm 58
5.18 Graph of Voltage against Frequency Various Resistance for 38 mm 59
5.19 Graph of Voltage against Frequency Various Resistance for 40 mm 59
5.20 Graph of Maximum Power against Resistance for 36 mm 60
5.21 Graph of Maximum Power against Resistance for 38 mm 61
xii
5.23 Responds of the vibration for 15 Hz 62
5.24 Responds of the vibration for 20 Hz 63
5.25 Responds of the vibration for 27 Hz 63
xiii
LIST OF TABLES
NO. TITLE PAGE
3.1 Gantt Chart 23
3.2 Test Matrix 26
5.1 Analysis for Free Vibration 45
5.2: Dimensions and material properties of the cantilever beam 46
5.3 The Stiffness Comparison between Analytical and
Experimental Result 46
5.4 Results from Dynamic Testing 52
5.5 Natural Frequency Comparison of Experimental and
xv
LIST OF SYMBOLS
m = Mass of electromagnet
M = Mass of the beam with mass
�� = Spring system
B = Damper
c = damping coefficient
�ẋ = Damper system
l = Length of the beam
w = Width of the beam
h = Thickness of the beam
E = Young’s Modulus
L = Coil
v(t) = Load voltage
y(t) = Base excitation
xvi
Z = Displacement, amplitude of seismic mass relative to base
K = Spring
R = Resistance
Rc = Internal coil resistance
RL = Load resistance
Wc = instantaneous power
Pave = Average Power
���� = Maximum extend that mass can moved
P(W) = Power harvested from the coils
xvii
LIST OF ABBREVIATION
RMS - Root Mean Square
LVDT - Linear Variable Displacement Transducer
FFT - Fast Fourier Transform
1
CHAPTER 1
INTRODUCTION
1.0 INTRODUCTION
1.1 Background
Energy is everywhere in the environment surrounding us which is available in the form of light energy, thermal energy, wind energy, mechanical energy and so on. From these natural-occurring energy sources, energy can be harvested by the process of capturing the minute amount of energy sources, accumulate and store it, and lastly supply it in a form that can be performed. Nowadays, harvesting energy from vibrations is one of the most promising technologies. The example of vibrations source can be from the floor or wall, machine, tall buildings, ocean waves and even human motions. (Zuo & Tang 2013)
2
device operates in resonance at the excitation frequency (Challa et al. 2008).So far,
the battery is the main power source for sensor applications. But, due to its limited lifespan, expensive cost and also containing harmful chemical, the energy harvesting can become a perfect replacement for delivering power to the sensor applications. This statement is supported by Mitcheson et al. (2004) who stated that energy harvesting is a topic of substantial and increasing research attention. He has analyzed practical miniature device to substitute the batteries in medical, and many others for low power applications. On the other hand, we can also classify the main energy harvesting technologies by the hierarchy shown in Figure 1.1 below:
Figure 1.1 Hierarchy of main energy harvesting technologies (Source : Caliò et al., 2014)
3 vibration energy harvesters has become one of the critical issues before these harvesters can widely deployed.
In this project, the research of getting the maximum power of wideband linear resonant generator is investigated and hopefully more ideas can be generated to improve the research from its limitations.
1.2Problem Statement
Linear energy harvesting device is introduced to convert the vibrations to electrical energy. But, most harvesters are work efficiently only with limited bandwidth near their resonant frequencies. Thus, increasing the bandwidth of the vibration energy harvesters become one of the most critical issues before these harvesters can be widely deployed in practical. Hence, ways to enhance the performance of vibration is the main focus for this research.
1.3Objective
a) To study the characteristics of a linear resonant generator
b) To fabricate a wideband resonant generator
c) To investigate the performance of the proposed device.
1.4Scope of Project
4
CHAPTER 2
LITERATURE REVIEW
2.0 LITERATURE REVIEW
2.1 Background Study
Most vibration-based generators generated the maximum power when the resonance frequency of the generator matches the frequency of the ambient vibration. If there is difference between these two frequencies, it can directly cause in very huge decreased in power output. This issue will limit its performance in real applications.
5 bandwidth widening can be achieved by using a generator array, a mechanical stopper, nonlinear springs and bi-stable structures.
2.2 Limitations of Generator
In research showed that there are two important factors that limit its efficiency which are the narrow bandwidth and low frequency density. In addition, the design of the generator and loss of energy during damping will also affect the overall power output.
Williams & Yates (1995) stated that when the generator operates at the resonance, the power generated is inversely proportional to the transducer damping factor. In principle, when damping factor of zero would generate infinity power at resonance. But, in practical, this is impossible to happen. Thus, the damping factor must be more than zero.
They also concluded that the main limitations on the power output of the generator are its size. Size limits the magnitude of the seismic mass and the maximum distance that the mass can be travel. The greater the size, the higher the power generated. The design rules for optimum power for the design device are:
(i) The mass and extend of the mass should be as large as possible within the
available volume of the device.
(ii) The spring, k should be designed so that the resonance frequency of the
device matches the vibration frequency of the applications.
(iii) The damping factor should be design small enough to make the mass
move to the limits of its range.
(iv) The unwanted damping, 0should be minimized.
6 Thus, the coil internal resistance and mechanical damping should be minimized to harvest more energy.
2.3 Frequency Tuning
Zhu et al. (2010) defines that the tuning methods can be classified into intermittent (passive) tuning which is the power consumed periodically to tune the device. This approach only consumes power during the tuning operation and uses negligible energy once the generator is matched to the frequency of the ambient vibrations. As for the second one is called the continuous (active) tuning which defined as a tuning mechanism that is continuously applied even if the resonant frequency equals the ambient vibration frequency. As both tuning are compared, continuous tuning consumes more energy than intermittent tuning as it is applied constantly to the generator.
Roundy and Zhang (2005) also concluded that generators using a continuous tuning mechanism can never produce a net increase in the power output as the power required to tune the resonant frequency will always exceed the increase in output power resulting from the frequency tuning. On other words, the intermittent tuning consumes less energy than continuous tuning because it switched off once the device is at resonance.
2.3.1 Mechanical Tuning Methods
7
Figure 2.1: Cantilever with a mass (Source: Beeby et al., 2006)
(i) Changing the dimensions
The approach requires the cantilever base clamp be released and reclamped in new locations along the length of the beam thereby by changing the effective length. The study showed that the shorter the beam, the higher the normalized resonant frequency.
(ii) Moving the center of gravity of the proof mass