UNIVERSITI TEKNIKAL MALAYSIA MELAKA
COMPARATIVE STUDY OF EFFECTIVENESS BETWEEN
GLYCOL AND WATER AS A REFRIGERANT MEDIUM
This report submitted in accordance with requirement of the Universiti Teknikal Malaysia Melaka (UTeM) for the Bachelor Degree of Engineering Technology
(Refrigeration & Air-Conditioning System) with Honours
by
MUHAMAD AFIQRI BIN ROHMAT B071210026
870825-23-5103
UNIVERSITI TEKNIKAL MALAYSIA MELAKA
BORANG PENGESAHAN STATUS LAPORAN PROJEK SARJANA MUDA
TAJUK: COMPARATIVE STUDY OF EFFECTIVENESS BETWEEN GLYCOL AND WATER AS A REFRIGERANT MEDIUM
SESI PENGAJIAN: 2015/16 Semester 1
Saya MUHAMAD AFIQRI BIN ROHMAT
mengaku membenarkan Laporan PSM ini disimpan di Perpustakaan Universiti Teknikal Malaysia Melaka (UTeM) dengan syarat-syarat kegunaan seperti berikut:
1. Laporan PSM adalah hak milik Universiti Teknikal Malaysia Melaka dan penulis. 2. Perpustakaan Universiti Teknikal Malaysia Melaka dibenarkan membuat salinan untuk
tujuan pengajian sahaja dengan izin penulis.
3. Perpustakaan dibenarkan membuat salinan laporan PSM ini sebagai bahan pertukaran antara institusi pengajian tinggi.
4. **Sila tandakan ( )
SULIT
TERHAD
TIDAK TERHAD
(Mengandungi maklumat yang berdarjah keselamatan atau kepentingan Malaysia sebagaimana yang termaktub dalam AKTA RAHSIA RASMI 1972)
(Mengandungi maklumat TERHAD yang telah ditentukan oleh organisasi/badan di mana penyelidikan dijalankan)
_______________________
Alamat Tetap:
No.9 Jalan Mutiara, Kampung Kangkar 1 85400 Cha’ah, Segamat,
DECLARATION
I hereby, declared this report entitled “Comparative Study of Effectiveness between
Glycol and Water as a Refrigerant Medium” is the results of my own research except
as cited in references.
Signature :………
Name : Muhamad Afiqri Bin Rohmat
`
APPROVAL
This report is submitted to the Faculty of Engineering Technology of UTeM as a partial fulfillment of the requirements for the degree of Bachelor of Engineering Technology (Refrigeration & Air-Conditioning Systems) (Hons.). The member of the supervisory is as follow:
ABSTRACT
ABSTRAK
DEDICATIONS
ACKNOWLEDGMENTS
TABLE OF CONTENTS
DECLARATION
APPROVAL
ABSTRACT ... i
ABSTRAK ... ii
DEDICATIONS ... iii
ACKNOWLEDGMENTS ... iv
TABLE OF CONTENTS ... v
LIST OF FIGURES ... viii
LIST OF TABLES ... x
LIST OF SYMBOLS AND ABBREVIATIONS ... xi
CHAPTER 1 ... 1
1.1 Background of study ... 1
1.2 Problem statements ... 2
1.3 Objectives ... 2
Main objective. ... 2
Specific objectives. ... 2
1.4 Scopes ... 3
CHAPTER 2 ... 4
2.1 Freezing point and boiling point ... 5
2.2 Cooling time ... 7
2.3 Ethylene glycol and propylene glycol ... 10
2.4 Evaporative coil ... 15
2.5 Equipment’s measurement ... 17
CHAPTER 3 ... 19
3.1 Materials selection ... 21
3.2 Fabrication and assembly process ... 21
Component and function ... 22
3.3 System operation ... 23
3.4 Equipment’s setup ... 24
3.5 Dilution process ... 26
3.6 Measurement process ... 28
CHAPTER 4 ... 29
4.1 Temperature of air ... 29
Concentration of 100% water ... 30
Concentration of 100% ethylene glycol ... 31
Concentration of 70% of ethylene glycol and 30% of water ... 32
Concentration of 50% of ethylene glycol and 50% of water ... 33
Concentration of 30% of ethylene glycol and 70% of water ... 34
4.2 Temperature of coil ... 37
Concentration of 100% of water... 37
Concentration of 100% of ethylene glycol ... 38
Concentration of 70% of ethylene glycol and 30% of water ... 39
Concentration of 50% of ethylene glycol and 50% of water ... 40
Concentration of 30% of ethylene glycol and 70% of water ... 41
Discussions on coil temperature ... 42
4.3 Overall discussions ... 45
CHAPTER 5 ... 46
5.1 Conclusions ... 46
5.2 Recommendations ... 47
APPENDIX A ... 49
APPENDIX B ... 52
APPENDIX C ... 55
LIST OF FIGURES
Figure 2.1: Draft of reduction of freezing point and increment of boiling point. 6
Figure 2.2: Comparison temperatures of mold come out for each medium. 8
Figure 2.3: Comparison of time for cooling. 9
Figure 2.4: Comparison of Thermal conductivity between Ethylene glycol and Propylene glycol.
12
Figure 2.5: Comparison of required increment flow between Ethylene glycol and Propylene glycol.
13
Figure 2.6: Dimension of coil 17
Figure 2.7: 3M LEV measuring device 18
Figure 2.8: Fluke thermocouple 18
Figure 3.1: Framework of Study 20
Figure 3.2: System assembly 22
Figure 3.3: Position of LEV measuring device in the conditioned space 24
Figure 3.4: Thermocouple setup and measuring point 25
Figure 3.5: Flow chart of the dilution step 27
Figure 4.1: Graph of air temperature against time (100% of water) 30
Figure 4.3: Graph of air temperature against time (70% of ethylene glycol and 30% water)
32
Figure 4.4: Graph of air temperature against time (50% of ethylene glycol and 50% water)
33
Figure 4.5: Graph of air temperature against time (30% of ethylene glycol and 70% water)
34
Figure 4.6: Comparative result on air temperature change 35
Figure 4.7: Average change on air temperature 36
Figure 4.8: Graph of coil temperature in and out (100% water) 37
Figure 4.9: Graph of coil temperature in and out (100% ethylene glycol) 38
Figure 4.10: Graph of coil temperature in and out (70% ethylene glycol / 30% water)
39
Figure 4.11: Graph of coil temperature in and out (50% ethylene glycol / 50% water)
40
Figure 4.12: Graph of coil temperature in and out (30% ethylene glycol / 70% water)
41
Figure 4.13: Comparative result on temperature different of coil 42
Figure 4.14: Average of coil temperature different 43
LIST OF TABLES
Table 2.1 : Freezing point and boiling point against percentage 5
Table 2.2 : Relationship between cooling time and mould temperature 7
Table 2.3 : Properties of cooling medium. 9
Table 2.4 : Thermal conductivities of glycol at 30% volume. 11
Table 2.5 : The required increment of flow to achieve same heat transfer as pure water.
13
Table 2.6 : Specification of copper tube ACR 15
Table 2.7 : Dimension and physical characteristic of copper tube ACR. 15
Table 2.8 : Rated internal working pressure of copper tube ACR (coil). 15
Table 3.1 : Segregation of medium by steps 26
Table 4.1 : Result of air temperature change (100% of water) 30
Table 4.2 : Result of air temperature change (100% of ethylene glycol) 31
Table 4.3 : Result of air temperature change (70% of ethylene glycol and 30% water)
32
Table 4.4 : Result of air temperature change (50% of ethylene glycol and 50% 33
Table 4.5 : Result of air temperature change (30% of ethylene glycol and 70% water)
LIST OF SYMBOLS AND ABBREVIATIONS
ACR – Air Conditioning and Refrigeration Field Service
ASTM – American Society for Testing and Material
ASME – American Society of Mechanical Engineering
ASME B280 – Seamless Copper Tube for Air Conditioning and Refrigeration Field Service
ASME – Pressure piping
EG – Ethylene glycol
PG – Propylene glycol
OD – Outside Diameter
RH – Relative Humidity
P – Allowable pressure of the pipe internal, (psi)
S – Maximum allowable stress in tension, (psi)
Tmin – Minimum wall thickness of pipe
Dmax – Maximum outside diameter
C – corrosion resistance (constant)
CHAPTER 1
INTRODUCTION
1.1 Background of study
1.2 Problem statements
The effectiveness between glycol and water medium in producing a cooling effect is very important. Glycol and water have a different characteristics for example ability in heat absorption, and efficiency in heat transfer to create a temperature differences. How the percentage of mixture between ethylene glycol and water influencing the cooling effect was the question. In order to identify the effectiveness of the medium, several factors need to include in an account for example temperature differences, and dilution percentage of the mixture. Thus cooling efficiencies of a medium is required before the efficiency of a medium can be identified.
1.3 Objectives
Main objective
To compare the effectiveness between water and glycol medium solutions in producing cooling effect.
Specific objectives
1. To measure the temperature differences of air that flow through the cooling coil.
2. To measure the temperature differences of medium that flow in the evaporative coil.
1.4 Scopes
This study focusing on;
1. Collecting data of inlet and outlet air temperature that flow through the evaporative coil.
2. Comparing the collected data and evaluate the best medium solution which is depending on dilution percentage of the medium in order to produce a cooling effect.
1.5 Results and expectations
CHAPTER 2
LITERATURE REVIEW
Water is probably the most efficient heat transfer fluid known. If it did not freeze, water would be the ideal heat transfer fluid for cooling applications (Corning, 1985). The disadvantage of using water is its freezing point of 0⁰C (32⁰F). According to Elkins, (1964) the freezing point can be reducing by a simple method which is by adding a sodium chloride (common salt) in the water. The solution that contained with 23.6% by weight of the sodium chloride has a eutectic freezing point of -22⁰C (7.6⁰F). Even though the solution has a low freezing point, there is another problem has to solve. The solution is corrosive to the common metals and consequently requires the use of specially protected system. There is another method can be used to overcome the problem which is by adding a solution of ethylene glycol in water.
2.1 Freezing point and boiling point
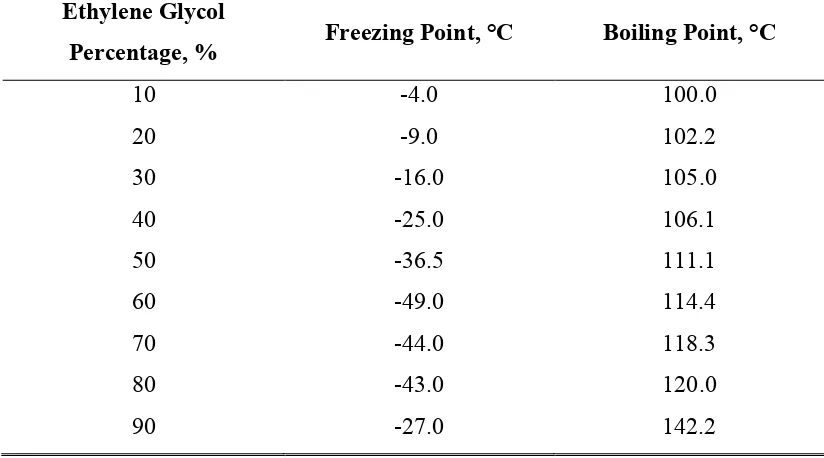
Ethylene glycol is completely miscible with water in all proportions. Mixtures of ethylene glycol and water will change water properties for example reduction on freezing point and increments of boiling point (Elkins, 1964). The effect of reduction of freezing point and increments of boiling point is depending on a percentage of ethylene glycol in water as shown in Table 2.1.
Table 2.1 : Freezing point and boiling point against percentage (Elkins, 1964) Ethylene Glycol
Percentage, % Freezing Point, °C Boiling Point, °C
10 -4.0 100.0
20 -9.0 102.2
30 -16.0 105.0
40 -25.0 106.1
50 -36.5 111.1
60 -49.0 114.4
70 -44.0 118.3
80 -43.0 120.0
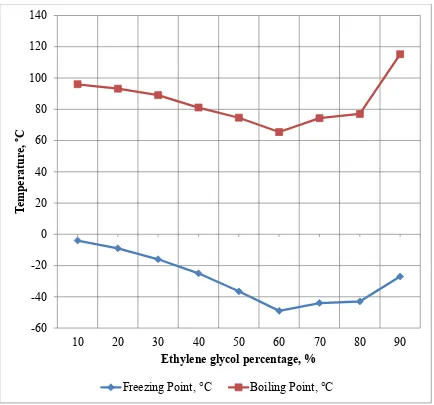
Figure 2.1 : Draft of reduction of freezing point and increment of boiling point.
For the freezing point, it is decreasing when the percentage of ethylene glycol is increasing until the freezing point reach -49°C which is when the percentage of ethylene glycol reach 60%. When the percentage of ethylene glycol is greater than 60%, the freezing point is increase with respect to the percentage of ethylene glycol until reach -12°C which is at 100% of ethylene glycol. However, the boiling point of water is directly proportional which is increasing with respect to the percentage of ethylene glycol. The draft of reduction of freezing point and increment of boiling point is shown in Figure 2.1.
-60
2.2 Cooling time
In injection molding, the cooling time takes by the mold usually up to 70% to 80% of the entire cycle time. As long as the mold cooling effect is concerned, few parameters need to take in account which is cooling channel type, length of cooling channel, flow rate of cooling medium, and cooling medium used. The cooling channel type used is serpentine coil with 6mm in diameter and extends up to 25mm length. On the other hands, the coolant parameter for cooling simulation specified are 20L/min and -25⁰C (-13⁰F) of coolant inlet temperature. (Rahul Vashisht, 2014)
Generally water is used widely for mold cooling purpose, but the major effect of the use is that it causes metal to rust. With all the salt contained like magnesium, calcium and chlorine in water, the boiling and freezing point can be reduce. For example, clean water (H2O) have a boiling point of 100⁰C (212⁰F) compared to water (in tap water) that can have it boiling point less than 58⁰C. Instead of low in boiling point, after long use of this water, the salt deposits can be seen as a whitish stuff for example at the bottom of kettles. The deposits cause clog in the cooling channel and stresses the cooling channel line and pump. Thus, it leads to the failure of the cooling channel line and effect the cooling efficiency. Table 2.2 showed the relationship between mold cooling time, and mold temperature produced by several cooling medium which is water, pure ethylene glycol and oil. (Rahul Vashisht, 2014)
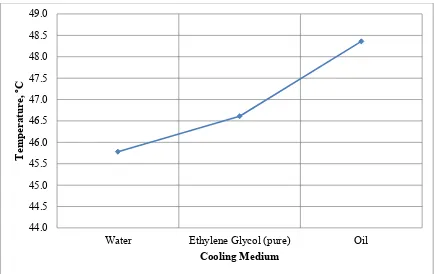
Table 2.2 : Relationship between cooling time and mold temperature
Name Cool Time
(s)
Mold Temperature (⁰C)
Water 26.8 45.8
Ethylene Glycol (pure) 26.9 46.6
Figure 2.2 : Comparison temperatures of mold come out for each medium.
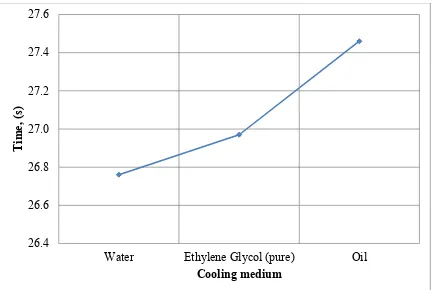
From Figure 2.2 and Figure 2.3, the plotted graph shown that the water has a lowest cooling time and mold temperature come out followed by ethylene glycol and finally oil. It is showed that water is more effective in terms of heat removal among the coolant medium compared to oil which is least effective among the coolant medium.
44.0 44.5 45.0 45.5 46.0 46.5 47.0 47.5 48.0 48.5 49.0
Water Ethylene Glycol (pure) Oil
Tem
perat
ure,
ºC
Figure 2.3 : Comparison of time for cooling.
Table 2.3 showed the different refrigerant which is used for the simulation process with properties that affects the cooling process. The properties that affect the cooling process are density, specific heat and thermal conductivity. The different of the coolant are compared in this table.
Table 2.3 : Properties of cooling medium.