Assessing local sustainability of fisheries system: a
multi-criteria participatory approach with the case of Yoron
Island, Kagoshima prefecture, Japan
Luky Adrianto, a, b, Yoshiaki Matsudaa and Yoshiaki Sakumaa
a Department of Marine Social Sciences, Faculty of Fisheries, Kagoshima University,
Shimoarata 4-50-20, Kagoshima City 890-0056, Japan b
Department of Socio-Economics, Faculty of Fisheries and Marine Sciences, Bogor Agricultural University, Lingkar Kampus 1, Darmaga Campus, Bogor City 16680, Indonesia
Accepted 23 January 2004. Available online 9 April 2004.
Abstract
In this study, we developed a framework for analyzing what we called ―local accepted‖ fishery
sustainability indicators by involving the fishery stakeholders in the Yoron Island, Japan. The results of study revealed that, from the degree of importance point of view, the security level and fishing management indicator are considered to be the most important indicators based on the
stakeholders’ value. From the results of cognitive mapping analyses, we found that there are five
indicators which have highest domain, while the succession rate indicator has the highest centrality value. It means that these indicators could be considered to have an important role for the overall sustainability of fisheries in the island.
Author Keywords: Fisheries system; Sustainability indicators; Multi-criteria participatory approach
Article Outline
1. Introduction
2. Sustainability in fisheries system 3. Methodology
3.1. Assessing the importance of sustainability indicators 3.2. Analysis of indicator linkages
4. Results and discussions
4.1. Importance of sustainability indicators 4.2. Indicator linkages
5. Conclusions and potential policy implications Acknowledgements
1. Introduction
Fisheries have been known to be an important activity throughout the world, and produce more than 100 million tons of fish and fishery products and contribute to human welfare by providing a livelihood to about 200 million people, and protein supply for a billion people. However, with declining stocks as well as several evidences related to fisheries, sustainability issue became very important and has been discussed as the central topic in fishery sciences and industries. This condition is mainly encouraged by the unfortunate reality that many fisheries are in a state of crisis, and some of them demanding urgent attention [1, 2, 3 and 4]. At global levels, fishing industry is a highly adaptive, market-driven and dynamically internationalized sector within the world economy. Its pressure on resources is still increasing, owing to a persistent worldwide upward trend in fish consumption, in concert with human population growth, especially in coastal zones. Global efforts are increasing and have limited the capacity of individual governments to control the pressure over fishing. This problem was associated with a variety of environmental and ecosystem problems including wastage from discards, loss of critical habitats, impact on endangered species, etc. [4].
From this point, fishery sciences itself are progressively switching their attention from single species to ecosystem approach, from micro to macro perspectives, increasing the need for measuring the impact of fishing on natural and man-made systems [3 and 5]. Consequently, Cochrane argued that the problems currently experienced in fishery management throughout the world occur in four realms, namely biological, ecological, economic and social crises [4].
Biological crisis of fishery management started during the last decade after awareness grew about the alarming status of fishery resources. Ludwig for example, drew attention to collapses of fish stocks such as those of the Pacific salmon, the Californian sardine, and the Peruvian anchovy [6]. In 1994, FAO showed, in an analysis, of global fish landings, that there had been reduction in the annual growth in landings in 1980s, and that in 1990 there had been 3% reduction in the global annual catch from the previous year [7]. Garcia and Newton analyzed that this trend continued over the next few years and in between 1990 and 1992, global landings fell by an average of 1.5% per year [8].
their global operation. Out of 108 types of vessels from 15 countries throughout the world, 97% had a positive gross cash flow and fully recovered their operating costs. When also considering the annual cost of capital, 85% showed a net profit after deducting the cost of depreciation and interests [12]. However, in terms of sustainability issues, some symptoms of economic crisis in some fisheries described above should be considered in order to come up with the solution for economic sustainability in the system [13].
From a social point of view, fisheries are rarely seen as simple tools for generating economic returns. The role of fisheries as a source of employment, particularly in rural or more remote areas, has also widely been given high priority [4]. Moreover, McGoodwin elaborated that fisheries actually are a human phenomenon which essentially are places where human activities are linked with marine ecosystems and renewable resources. Human fishing activities defined the attribute of fishery, since without it there would only be an aquatic realm where various marine species live. Therefore, it has been strongly argued that clearly the fisheries are much more than geographic regions, fishing methods, types of fishing gear, fish species, or economic-domains— it is something more human [14].
In this regard, social aspects in fisheries would be very important to be understood. One of the major features of fisheries in recent decades, related to the social crisis, has been the introduction of modern fishing technologies and also the increasing globalization of trade affecting the fishing communities. Modernization in fisheries has two faces of which actually one contributed to the welfare of fishing communities, while the other has led to the social problem related to the depletion of fishery resources [15]. According to Crean and Symes, in the North Atlantic and Mediterranean, there has been a decline in the quality of life and standard of living among many fishing communities [16], as also experienced in some parts of South East Asia [17]. This symptom of social crisis in fisheries should seriously be taken up when we consider the sustainability in this sector.
From the perspectives described above, we argue that the need for measuring and evaluating the sustainability of fishery activities in a system perspective has acquired its highest importance and should be undertaken at various levels involving all aspects in the fishery system. As also strongly argued by Charles that critical concern about sustainability arises not only in terms of catch level or even biomass level, but in all aspects of the fishery: from the ecosystem, to the social and economic structure, to the fishing communities and management institutions, as well as fish stocks themselves [1]. Moreover, the pursuit of sustainable fisheries is best seen as requiring, more than keeping the catch of fish, to keep a level that is not too large. Instead, sustainability can be viewed comprehensively as the maintaining or enhancing of four key components, namely ecological, socioeconomic, community and institutional sustainability indicators [1].
sustainability of fisheries. RapFish relies on a defined-scoring of a number of attributes in five dimensions, namely of ecological, economic, social, technological and ethical. As its characteristics of a rapid appraisal, this method has a slightly top-down approach by employing the defined-score and criteria for the fishery system evaluation. The application of RapFish can be seen, for example, in the Gulf of Maine fisheries [19], in the North Atlantic Fisheries [18] and recently in the case of Jakarta coastal fisheries, Indonesia [23].
Similar to RapFish, compliance with the FAO Code of Conduct required multidimensional scaling approach. In this case, four different sets of attributes articulate the clauses in the Code [21]. This evaluation method reflects national management intentions and management practices for each fishery system that is assessed. The application of this method has been carried out in Australian fisheries [21], Australian multi-species trawl fishery [24], and Gulf of Maine fisheries [18].
International Instrument Compliance method focuses on measuring either qualitatively or quantitatively the level of compliance with the fisheries management provisions contained within an instrument [18]. In this method, criterion scores ranged from 0 (low compliance) to 3 (high compliance) and the total criteria were limited to approximately six per instrument. An example of this method is presented by Chuenpagdee and Alder in the case of Gulf of Maine fisheries
measurement methods previously described. We assess what we call ―local accepted‖ fishery
sustainability by examining local sustainability indicators, their importance, interactions, connections, linkages, and assess sustainable state indicators using a cognitive approach involving fishery stakeholders in the area studied. Indicators of sustainability in this case could be defined as a variable that can be used to measure the status or condition of a system [25].
In this study, we used the fishery system of Yoron Island, Kagoshima Prefecture, Japan as the case study. This island is located in the southernmost of Kagoshima Prefecture which is bordered by Okinawa Prefecture in the south, Okinoerabu Island in the north, South China Sea in the west, and Pacific Ocean in the east. Geographically, this island is included in the group of Amami Islands together with Okinerabu Island, Amami Oshima, Tanegashima, and Kikai Island. Among these islands, Yoron Island is the smallest and in terms of area as is estimated to be 20.5 and 23.7 km of coastal line. In terms of population, this island is also small with only 6210 people inhabiting in year 2000. This island is also considered to be relatively vulnerable in terms of its economy according to Adrianto and Matsuda [26].
Fishery sector in Yoron Island was considered as one of the main areas of economic activities compared to other islands in the group of Amami Islands. Using location analysis approach, fishery sector in Yoron Island has been considered to have very high representation of its economy with location quotient (LQ) value of 1.82, compared with the LQ values of other islands that have lower than 1.0 except Amami Oshima [27]. In terms of production, during the 10 years of analysis, fishery sector in Yoron Island was considerably stable and tended to be growing. In 1988, the fishery production was 321 ton and increased to 384 ton in 1998. In 2002, the total production was recorded to be 540 ton.
Beyond the statistic performance of fishery production described above, it was important to have an in-depth analysis on the importance of sustainability issues in fishery development in the island. First, as previously elaborated, fishery sector has been an important sector in Yoron Island, so that such efforts to maintain the performance of fisheries in this island are considerably important in terms of its economic function to increase the gross island products. Secondly, it is a matter of fact that fishery sector in Yoron has an important role in the food supply of the islanders. In 2003, almost a half of the fishery production was consumed locally. Out of the 540.139 ton total production, 139.638 ton went to local market as food supply for the local islanders. From these two reasons, we may argue that analysis of sustainable fishery system in Yoron Island is considerably needed from ecological, socioeconomical, and institutional point of views.
The paper is organized as follows. In Section 2, a concise description on the theoretical approach of sustainability in fishery system is provided, followed by a concise description of the material and methodological issues used in this study Section 3). Then, the analysis proceeds with the presentation of empirical results and discussions regarding the analysis ( Section 4), and then concluded with a final evaluative section in Section 5.
2. Sustainability in fisheries system
Most of sustainability definitions originate from the relationship between humans and natural resources system. Wimberly states that ―to be sustainable is to provide for food, fiber and other natural and social resources needed for the survival of a group—such as a national or international society, an economic sector, or residential category—and to provide in a manner that maintains the essential resources for present and future generations‖ [30]. Norton argues that
―sustainability is a relationship between dynamic human economic systems and larger, dynamic, but normally slower changing ecological systems, such that human life can continue indefinitely, human individuals can flourish, and human cultures can develop—but also a relationship in which the effects of human activities remain within bounds so as not to destroy the health and integrity of self-organizing systems that provide the environmental context for these activities‖ [31].
Constanza, in line with the above definitions, defines sustainability in systems properties,
stressing that ―sustainability…implies the system's ability to maintain its structure (organization) and function (vigor) over time in the face of external stress (resilience)‖ [32]. Moreover, more on economic dimension, Solow argues that the system is to be said sustainable as long as the total capital of the system is equal or greater in every next generation [33]. Constanza and Daly mentioned that sustainability only occurs when there is no decline in natural capital [34].
From several definitions of sustainability described above, there is one common component in all of them. There is something about maintenance, sustenance, continuity of a certain resource, system, condition, relationship between components of the system, in keeping something in a certain level, and of avoiding decline [29].
In fishery sciences, the sustainability has long been in discussions and debates on the concept of sustainable yield [35 and 36]. Sustainability in fishery has been determined predominantly by the level of sustainable catch which Charles called as the conservation paradigm of sustainable fisheries [36]. Furthermore, it was elaborated that the conservation paradigm in sustainable fisheries makes the definition of sustainability as one of long-term conservation, so that any
activity is judged ―sustainable‖ if it protects the fish stocks without considering much on human-oriented fishery objectives. The icon of MSY (maximum sustainable yield) is one of the very well-known parameter that has been emphasized by the conservation paradigm.
Another perspective, called the rationalization paradigm, has challenged the dominancy of conservation paradigm by inserting the concept of resources rent, the return to resources owners from the fishery [37 and 38]. In this paradigm, fisheries should be run rationally and economically efficient [39]. This rationalization paradigm focuses on the achievement of an
economically ―rational‖ or ―efficient‖ fishery.
not achieved by only focusing on the conservation of the fish nor maximizing the economic rents but rather by preserving the way of life in fishing communities.
By the above visions, it is argued that sustainable fisheries should be defined widely. While there is general agreement that resource conservation is necessary for fishery sustainability, the concept of fishery sustainability must involve more options and objectives, including other human concerns instead of rational objectives such as MEY and OSY. Pitcher and Preikshot have also mentioned that conventional stock assessment (conservation paradigm) relates to the ecological, or occasionally the economic rationale paradigm [19], and yet fisheries in reality are a multi-disciplinary human endeavor that has social and ethical implications [14], besides policy implications [1]. Evaluation of sustainability in all of these disciplines is required for objective decision-making. In other words, while the balancing of present and future catches is important, there is more to a healthy future than simply a large fish stock. It is also important to pay attention to sustaining the process underlying the fishery. Moreover, Charles mentioned that what is sometimes missing from the discussions of fisheries sustainability is the attention to the state of human system. This is where the concept of sustainable development becomes important [1].
As mentioned in the beginning of this section, a well-known definition of sustainable development is the one given by WCED as the development that meets the needs of present generation without compromising the ability of future generations to meet their own needs [28]. Following this definition, there is wide recognition of the need to view sustainability broadly, in an integrated manner that includes ecological, economic, social and institutional aspects of the full system (i.e. fishery system).
Ecological sustainability incorporates firstly, the long standing concern for ensuring that harvests are sustainable, by avoiding depletion of the fish stocks. Secondly, ecological sustainability also incorporates the broader concern of maintaining the resource base and related specie at levels that do not foreclose future options [1 and 36].
Socio-economic sustainability focuses on the macro level, that is, on maintaining or enhancing overall long-term socio-economic welfare. This socio-economic welfare is based on the blend of relevant economic and social indicators, focusing essentially on the generation of sustainable net benefits, a reasonable distribution of those benefits among the fishery participants, and maintenance of the system's overall viability within local and global economies. The socio-economic sustainability blends together socio-economic criteria (such as the level of resources rent) and social criteria (such as overall distributional equity), recognizing that these are inseparable at the policy level.
Finally, institutional sustainability involves maintaining suitable financial, administrative, and organizational capability in the long term, as a prerequisite for three components of sustainability described previously. Institutional sustainability refers in particular to the sets of management rules and policy by which fisheries are governed. A key requirement in the pursuit of institutional sustainability is likely to be the manageability and enforceability of resource-use regulations [1].
As elaborated by Charles, the first three sustainability components can be viewed as the fundamental points of a Sustainable Triangle. The fourth, institutional sustainability, interacts among these potentially affected positively or negatively by any policy measure focused on ecological, socio-economic and/or community sustainability [36]. If each of the components is viewed as crucial to overall sustainability, it follows that sustainable development policy must serve to maintain reasonable levels of each. In the other words, system sustainability would decline through a policy seeking to increase one element at the expense of excessive reductions in any other. The concept of inseparable elements of sustainability in fisheries could be seen as the sustainability triangle as shown in Fig. 1.
Full-size image (28K)
Fig. 1. Location of the case study (not to scale—Inset: map of Japan).
3. Methodology
3.1. Assessing the importance of sustainability indicators
In this study, a formal methodology called multi-criteria analysis (MCA) is used. According to Mendoza and Prabhu, MCA is a general approach that can be used to analyze complex problems involving multiple criteria, and also have advantages when applied in a complex and stochastic system like fisheries. At least there are three advantages of this method for fishery sustainability assessment. First, it can deal with mixed sets of data, quantitative or qualitative, including
Secondly, the MCA approach also can be conveniently structured in order to enable a collaborative planning and decision-making environment. This environment provides an opportunity to develop such an accommodation for the involvement and participation of stakeholders in the sustainability assessment process. Finally, the MCA methodology is also still simple, intuitive, and transparent while it has strong technical and theoretical support in its procedure.
In this study, MCA approach was used to (1) generate a set of sustainability indicators of fisheries based on several appropriate references; and (2) assess and evaluate the indicators in terms of their degree of importance and condition with respect to some desired future condition or target. For the first part of analysis, the methods used to identify and monitor sustainability indicators are quite diverse, but they frequently fall within a range from expert driven and top-down to bottom up, and locally defined [40]. In this study, we developed a mixed-method approach suggested by Parkins et al. [40] i.e. by combining expert-driven fisheries sustainability indicators [1 and 41] and then they are confirmed to the local stakeholders in order to generate a
―local accepted‖ fishery sustainability indicators. It can be presumed that by using this
combination approach, the sustainability indicators will be more directly suitable to the community goals and objectives.
In the second part of analysis, we evaluated the sustainability indicators in terms of their degree of importance by simply ranking each indicators following a modified semantic scale (weight) of Saaty [42]. This semantic scale employs a 7-point scale namely 1—less important, 3— moderately important, 5—more important, 7—extremely important, and 2, 4, 6—intermediate value. Based of these rankings, relative weight of an indicator can be estimated using the formula as follows [25]:
(1)
where aj is the average weight of indicator j and wj is the relative weight of indicator j.
Following Mendoza and Prabhu, in the next analysis we examined each indicator, judging their current condition relative to their perceived target or desired condition [25]. The desired condition was used to reflect or represent a sustainable state of fishery sustainability indicators. For doing this, again we used MCA approach following a 5-point scale adopted and modified from Mendoza and Macoun with values—1: extremely weak performance, strongly unfavorable, 2: poor performance, unfavorable, may be the norm of region, but major improvement needed, 3: acceptable, or at above the norm for good operations in the region, 4: very favorable performance, well above the norm for the region, and 5: state of the art in the region, clearly understanding performance that is way above the norm for the region [43]. The sustainability indicator score (SIC) then is calculated by using the formula
where SIC is sustainability index of criteria i (ecology, economy, community and policy), Sj is the score of indicator j and Wj is the relative weight of indicator j (Eq. (1)).
3.2. Analysis of indicator linkages
In the previous section, we have described the methodology of static and individual behavior of
each indicator from the stakeholders’ perceived importance and conditions. However, it can be
also argued that each indicator seldom affects the dynamics of fishery system and their sustainability individually. They are intricately linked and connected among them and consequently will affect the sustainability directly or indirectly. Their impacts are tied through a web of complex relationship which is difficult to extract on an individual indicator basis [25]. Moreover, Prabhu et al. also mentioned that sustainability of a natural system can be compromised due to cross-criterion or cross-indicator interactions. In the other words, it would arguably be meaningful if analysis can be extended into behavior assessment among indicators using system approach [44].
According to Mendoza and Prabhu, cross-indicator interactions can be analyzed at different levels depending on the amount of information and knowledge about dynamic interactions between indicators [25]. It can be analyzed using quantitative system dynamics [45] if sufficient information about each indicator can be identified. On the other hand, qualitative analysis and assessment of indicator linkages also can be more suitable in the case of lack of functional relationship between indicators. In this study, we used one qualitative method, that follows an approach with regard to problems of indicator linkages, called cognitive mapping [25 and 46].
Cognitive mapping is included in the soft methodology category and differs from traditional formal methodologies in terms of the type of analysis and results generated. Generally, soft methodology results are descriptive rather than prescriptive. Cognitive mapping is a casually based mapping technique where concepts representing elements of a complex problem are organized and structured using arrow diagram. Arrows represent the connections and relationships among the indicators [46].
In this study, we defined two variables which Eden and Akermann considered as the essential variables of cognitive mapping method, i.e. domain and centrality [47]. Domain is an important factor of cognitive mapping because it reflects the density or the number of indicators directly linked to a particular indicator regardless of direction. That is, higher domain values of an indicator reflect a larger number of indicators directly affecting, or affected by, the indicator ( Fig. 2). Centrality is another essential concept in cognitive mapping. It reflects indicator's downstream effect that is not only in direct connection with other indicators but also in indirect linkages. Meaning that centrality can be viewed as the strategic significance because it represent cumulative impact of indicators beyond its direct impact [25]. The concept of centrality in cognitive mapping is depicted in a diagram as presented in Fig. 3. The centrality of an indicator is reflected by its central score which is defined in the following formula:
where Cj is the central score of indicator j considering m levels of interactions and Sj is the
number of indicator at level m. Higher the centrality score of an indicator, more significant the indicators for overall sustainability of a system [25].
Full-size image (14K)
Fig. 2. Sustainability triangle for sustainability of fishery system [1].
Full-size image (14K)
Fig. 3. Concept of domain indicators in cognitive mapping.
4. Results and discussions
4.1. Importance of sustainability indicators
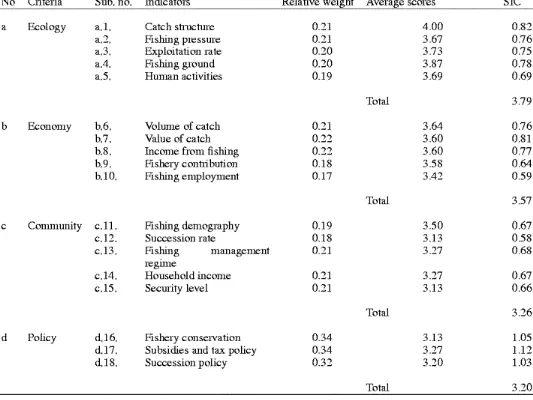
As mentioned in the previous section, the first analysis for sustainability indicators is to generate a set of indicators in terms of their importance judged by a group of stakeholders. In this study, we used a set of sustainability indicators which is composed of four variable criteria of sustainability indicators, namely ecological-criterion indicators (5 indicators), economic-criterion indicators (5 indicators), community-criterion indicators (5 indicators) and policy-criterion indicators (3 indicators) (Table 1). A group of stakeholders that consists of three types of stakeholders was involved in this analysis, i.e. fishers community (10 persons), fishery-related decision-makers (3 persons) and fish market-related stakeholders (2 persons). By using participatory assessment method, we discussed the indicators set and asked the stakeholders to define their value on indicator importance as well as their perceived target of indicators.
Source: Modified from [1] and [41].
Full-size image (5K)
Fig. 4. Concept of indicators centrality in cognitive mapping (ex. 3 levels).
The following results show the importance of degree of indicators which are judged using a 7-point scale of values by the stakeholders. The results are presented in Table 2. It is clear that according to stakeholder values, almost all the indicators are rated moderately to highly important. It can be seen from the average weight value, which is calculated in a range from 5.15 to 6.73, showing that almost of all the indicators are important. Furthermore, from the calculation of relative weights, we can clearly see that some indicators are rated lower than others. For example, under the ecological sustainability indicators, indicator a.5 (effect of human activities on the marine ecosystem) is rated lower than other indicators under the same variable (ecological sustainability). Similarly, indicator c.11 (demographic indicator) and c.12 (succession rate) under the community sustainability has low relative weight as compared with the other three indicators in the same variable. Moreover, we also reveal that among all of indicators, indicator c.15 (security level) under the community indicators variable has the highest value of importance, while indicator b.10 (fisheries employment/proportion of labor) under the economic sustainability variables has the lowest value of importance degree.
Full-size table (31K)
Note : S.D.=standard of deviation.
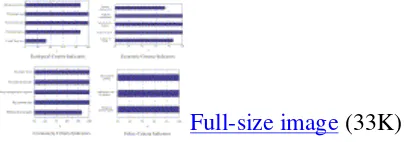
variables are important, while policy makers emphasize on ecology and policy sustainability variables, and market-related persons considered economic sustainability variables as more important variables. These comparative analyses can be used as guides in making decision as to what indicators are important and need to be monitored site-specifically. Fig. 5 shows the degree of importance of sustainability indicators by each group interests.
Full-size image (33K)
Fig. 5. Participation rate on indicators by the stakeholders.
From the calculation of standard deviation in Table 2, we also reveal that there is no complete agreement or consensus among stakeholders due to the standard deviation value of more than zero. In the other words, the opinions and judgments are more varied among the stakeholders. Higher standard deviation indicates diverging opinions; the larger the standard deviation, the more varied the opinions. Among fisheries sustainability indicators examined, ecological sustainability indicators has the highest average of standard deviation (1.09), meaning that the judgment or opinions of the stakeholders for the ecological sustainability indicators are divergent and varied among others. On the other hand, due to its average standard deviation value (0.75), it can be said that there is a ―degree of consensus‖ among the stakeholders when making a judgement for the community sustainability indicators. The economic and policy sustainability indicators have average standard deviation value between those values. According to Mendoza and Prabhu [25], it would ideally be desirable to have some way of ―improving‖ the consistency of the judgments (minimum standard deviation).
In addition to estimating the relative weights of indicators, the next part of analysis is to estimate
the ―sustainable state‖ elaborated from the perceived targets or conditions judged by the
stakeholders. This analysis is also started by judgements of the stakeholders to score the perceived targets of each indicator followed by the calculation of sustainability index of criteria (SIC). The results are presented in Table 3. We can see that sustainability index for the ecological indicators is the highest among other sustainability variables (SIC=3.79). It is followed by the economy indicators (SIC=3.57), community indicators (SIC=3.26), and policy indicators (SIC=3.20). Graphically, the sustainability index of criteria for fishery system in Yoron Island can be seen in Fig. 6.
Note : n=15.
Full-size image (9K)
The results of SIC mean that based on their perceived value of condition for each indicator, the stakeholders judged that ecological indicator variable has a relatively best condition (acceptable, above the norm of good operations in the region) compared with other variables. This result can be complementarily discussed with the results of important judgment of indicators. Although, according to the stakeholders, policy and community indicator variables are the most important for fishery system in Yoron Island, they also judged that ecologically and economically, the fishery system in Yoron Island is relatively ―sustainable‖.
4.2. Indicator linkages
As previously mentioned, the indicator of fishery sustainability seldom affect the dynamic of ecosystem or sustainability on its own. Therefore, a holistic assessment is done to identify the relationship among indicators including their collective impact on the fishery sustainability.
Using cognitive mapping technique, a causality map was generated based on the indicators assessed earlier and presented in Fig. 7. Table 4 and Fig. 8 show the information of two important values, domain and centrality, which reflect the indicator density and downstream. In terms of domain, the results show that only 5 from total 18 indicators have a density of at least 5 indicators (d-max) directly linked to them (d=5). Those indicators are distributed in the economic sustainability variable, 2 indicators (b.7 and b.8), and then the community sustainability variable, 3 indicators (c.11, c.12, c.14). The maximum indicator domain in the other two sustainability variables is 4 indicators (d=4) for the ecological sustainability variable and 3 (d=3) for the policy sustainability variable.
Full-size image (12K)
Fig. 7. Sustainability index of criteria of fishery system in Yoron Island.
Full-size image (13K)
Fig. 8. Cognitive map of sustainability indicators linkages.
In terms of centrality score, we also found that indicator c.12 (succession rate) under the community sustainability variable has the highest value (CS=27.17), meaning that arguably this indicator can be perceived as the central of sustainability issues for the fishery system in the case of Yoron Island, Japan.
5. Conclusions and potential policy implications
the stakeholder analysis. In addition, indicators were set up using a modified fishery indicator list provided by FAO (2000) and Charles (2001), and then evaluated by estimating their degree of importance of values by the stakeholders. Subsequent to estimating their relative weights, indicators are also evaluated by giving them scores that reflect their perceived target or condition of each indicator.
In addition to systematically assessing locally relevant sustainability indicators, this study has also presented a qualitative methodology for examining the interactions, connections and linkages of indicators. By this examination, it becomes more meaningful and insightful to know the indicators overall cumulative dynamic effects on the fishery sustainability.
In terms of local fisheries policy, it can be argued that the importance and linkages of sustainability indicators should be incorporated into the decision making process when a policy will be set-up in order to increase the sustainability of a fishery system in small islands. This policy should be site-specifically made because of the nature of sustainability (Nijkamp, 1999). For example, regarding the stakeholder opinion in Yoron Island, although all the sustainability variables are important, policy and community sustainability variables are considered more important than the ecological and economic variables. In this case, fishery development policy in Yoron Island should pay more attention on the community and policy sustainability. Actually, this kind of policy has been implemented by the local government by providing several schemes such as subsidy and security improvement in fishing activities (Fig. 9).
Full-size image (27K)
Fig. 9. Domain and centrality score of sustainability indicators.
Acknowledgements
We especially acknowledge the Marine Social Sciences group of Kagoshima University which contributed to this paper by reading and commenting on earlier drafts in the Graduate Seminar held weekly in our Faculty. This work was made possible largely through the generous support of the Japan Ministry of Education, Culture, Sports, Sciences and Technology and the authors relay their heartfelt gratitude to this organization. However, responsibility for the content rests solely with the authors.
1. A.T. Charles. Sustainable fisheries system, Blackwell Sciences, London, UK (2001).
2. S.M. Garcia, D.J. Staples and J. Chesson, The FAO guidelines for the development and use of indicators for sustainable development of marine capture fisheries and an Australian example of their application. Ocean and Coastal Management (2000), pp. 537–556. Abstract | Article |
PDF (335 K) | View Record in Scopus | Cited By in Scopus (32)
3. D. Pauly, V. Christensen, S. Guenette, T.J. Pitcher, U. Rashid Sumaila, C.J. Walters, R. Watson and D. Zeller, Towards sustainability in World fisheries. Nature (2002), pp. 689–695.
Full Text via CrossRef | View Record in Scopus | Cited By in Scopus (519)
4. K.L. Cochrane, Reconciling sustainability, economic efficiency and equity in fisheries: the one that got away?. Fish and Fisheries (2000), pp. 3–21. Full Text via CrossRef
5. A.T. Charles, Living with uncertainty in fisheries: analytical methods, management priorities and the canadian groundfishery experience. Fisheries Research (1998), pp. 37–50. Article |
PDF (153 K) | View Record in Scopus | Cited By in Scopus (20)
6. Ludwig DE, Hilborn R, Walters C. Uncertainty, resources exploitation, and conservation: lessons from history. Science 1993;(260):17, 36.
7. FAO. Review of the state of World marine fishery resources. FAO Fisheries Technical Paper 335, 1994. 136pp.
8. Garcia SM, Newton C. Current situation, trends and prospects in World capture fisheries. In: Pikitch EK, Huppert DD, Sissenwine MP, editors. Global trends: fisheries management. Proceedings of the American Fisheries Society Symposium 14–16 June 1994;1997.
9. Christy F. Economic waste in fisheries: impediments to change and conditions for improvement. In: Pikitch EK, Huppert DD, Sissenwine MP, editors. Global trends: fisheries management. Proceedings of the American Fisheries Society Symposium 14–16 June, 1994;1997.
10. Zulbainarni N, Matsuda Y, Adrianto L. Poverty in large catch: an evaluation of purse seine fisheries in Kagoshima Prefecture, Japan. Working Paper, Department of Marine Social Sciences, Faculty of Fisheries, Kagoshima University, 2003.
11. Matsuda Y. The Japanese Sardines, Pilchard Fishery. Selected Papers Commentaries, Comments Presented to the SEAPOL Inter Regional Conference, Bangkok on March 21–23, 2001.
12. Tietze U, Prado J, Le Ry JM, Lasch R. Techo-economic performance of marine capture fisheries. FAO Fisheries Technical Paper 421, FAO, Rome, 2001.
13. D. Whitmarsh, C. Pipitone, F. Badalamenti and G. D’Anna, The economic sustainability of artisanal Fisheries: The case of the trawl ban in the Gulf of Castellamare, NW Sicily. Marine
Policy (2003), pp. 489–497. Article | PDF (428 K) | View Record in Scopus | Cited By in
Scopus (7)
14. Mc. Goodwin J. Crisis in the World’s fisheries: people, problems, and policies. Standford, USA: Standford University Press; 1990. 235pp.
15. Maiolo JR, Orbach MK. Modernization and marine fisheries policy. Michigan, US: Ann Arbor Science; 1982. 330pp.
16. K. Crean and D. Symes, Sailing into calmer waters?. In: K. Crean and D. Symes, Editors,
Fisheries management in crisis, Fishing News Books, Oxford, UK (1996).
18. Chuenpagdee R, Alder J. Sustainability ranking of North Atlantic fisheries. sea around us: North Atlantic. Fisheries Center, University of British Colombia, Canada, 1999.
19. T.J. Pitcher and D. Preikshot, RAPFISH: a rapid appraisal technique to evaluate the sustainability status of fisheries. Fisheries Research (2001), pp. 255–270. Article | PDF (505 K) | View Record in Scopus | Cited By in Scopus (36)
20. Pitcher TJ. Rapfish; a rapid appraisal technique for fisheries and its application to the code of conduct for responsible fisheries. FAO Fisheries Circular No. 947. 1999. 49pp.
21. S.M. Garcia, K. Cochrane, G. Van Santen and F. Christy, Towards sustainable fisheries: a strategy for FAO and the World Bank. Ocean and Coastal Management (1999), pp. 369–398. Abstract | PDF (213 K) | View Record in Scopus | Cited By in Scopus (13)
22. Alder J, Lugten G, Kay R, Ferriss B. Compliance with international fisheries instruments. In: Pitcher TJ, Sumaila UR, Pauly D, editors. Fisheries impacts on North Atlantic ecosystems. Evaluations and policy exploration. Fisheries Centre Research Reports 2001;9(5):94.
23. Fauzi A, Anna S. Evaluation on sustainability status of fisheries using rapfish approach: the case study of Jakarta coastal fisheries. Indonesian Journal of Coastal and Marine Resources 2002;(4)3:43–55 [in Bahasa Indonesia].
24. J. Chesson, H. Clayton and B. Whitworth, Evaluation of fisheries-management systems with respect to sustainable development. ICES Journal of Marine Science 56 6 (1999), pp. 980–984. View Record in Scopus | Cited By in Scopus (12)
25. Mendoza GA, Prabhu R. Qualitative multi-criteria approaches to assessing indicators of sustainable forest resources management. Forest Ecology and Management 2002.
26. Adrianto L, Matsuda Y. Developing economic vulnerability indices of environmental disasters in small island regions. Environmental Impact Assessment Review 2002;(22):393–414 27. L. Adrianto and Y. Matsuda, A comparative analysis on the role of fisheries producers in small island regions: the case of Amami Islands, Kagoshima prefecture, Japan. Journal of
Regional Fisheries (2003), pp. 29–43.
28. WCED. Our Common Future. World Conference on Environment and Development. Oxford: Oxford University Press; 1987. 400pp.
29. Voinov A. Paradoxes of sustainability. Institute of Ecological Economics. Maryland, USA. Available Online at: http://www.uvm.edu/giee/AV/PUBS/Sustainability.html, 2000.
30. R.C. Wimberly, Policy perspectives on social, agricultural, and rural sustainability. Rural
Sociology (1993), pp. 1–29.
31. B.G. Norton, A new paradigm for environmental management. In: R. Constanza, B.D. Haskell and B.G. Norton, Editors, Ecosystem health: new goals for environmental management, Island Press, Washington, DC (1992).
32. R. Constanza, Toward an operational definition of ecosystem health. In: R. Constanza, B.D. Haskell and B.G. Norton, Editors, Ecosystem health: new goals for environmental management, Island Press, Washington, DC (1992).
33. Solow RM, Sustainability: an economist’s perspective. Marine Policy Center, WHOI, Woods Hole, Massachusetts, USA, 1991.
34. Constanza R, Daly HE. Natural capital and sustainable development. Conservation Biology 1992;(6):37–46.
36. Charles AT. Toward sustainability: the fishery experience. Ecological Economics 1994;(11):201–11.
37. Anderson LG. The economics of fisheries management. Baltimore: John Hopkins Press; 1986. 296pp.
38. L.G. Anderson, The economics of multi-purpose fleet behavior. In: L.J. Mirman and D.F. Spulber, Editors, Essays in the economics of renewable resources, North-Holland, Amsterdam (1982).
39. C.W. Clark. Bioeconomic modeling and fisheries management, Wiley, New York (1985). 40. J.R. Parkins, C.S. Richard and J. Varghese, Moving towards local-level indicators of sustainability of forest-based communities: a mixed-method approach. Social Indicators
Research (2001), pp. 43–72. Full Text via CrossRef | View Record in Scopus | Cited By in
Scopus (16)
41. FAO. World fisheries and aquaculture. Rome: FAO; 2000.
42. R. Vreeker, P. Nijkamp and C.T. Welle, A multicriteria decision support methodology for evaluating airport expansion plans. Transportation Research Part D (2002), pp. 27–47. Article |
PDF (441 K) | View Record in Scopus | Cited By in Scopus (15)
43. Mendoza GA, Macoun P. Guidelines for applying multi-criteria analysis to the assessment of criteria and indicators. Bogor, Indonesia: CIFOR; 2000. 54pp.
44. Prabhu R, et al., Testing criteria and indicators for the sustainable management of forests. CIFOR Special Publications; 1996.
45. J.W. Forrester. World dynamics, Wrigh-Allen Press, Inc, Cambridge, MA (1973).
46. Brightman J. Maping methods for qualitative data structuring (QDS). Banxia Software Ltd, 2003.
47. Aden C, Ackermann F. Making strategy: the journey of strategic management. London: Sage Publications; 1998.