190 Journal of International Conference on Electrical Machines and Systems Vol. 3, No. 2, pp. 190~199, 2014
Open and Short Circuit Switches Fault Detection of
Voltage Source Inverter Using Spectrogram
N. S. Ahmad *, A. R. Abdullah** and N. Bahari ***
Abstract
–In the last years, fault problem in power electronics has been more and more investigated both from theoretical and practical point of view. The fault problem can cause equipment failure, data and economical losses. And the analyze system require to ensure fault problem and also rectify failures. The current errors on these faults are applied for identified type of faults. This paper presents technique to detection and identification faults in three-phase voltage source inverter (VSI) by using time-frequency distribution (TFD). TFD capable represent time frequency representation (TFR) in temporal and spectral information. Based on TFR, signal parameters are calculated such as instantaneous average current, instantaneous root mean square current, instantaneous fundamental root mean square current and, instantaneous total current waveform distortion. From on results, the detection of VSI faults could be determined based on characteristic of parameter estimation. And also concluded that the fault detection is capable of identifying the type of inverter fault and can reduce cost maintenance.Keywords:
Voltage Source Inverter (VSI), Spectrogram, Time-Frequency Distribution (TFD), Fast Fourier Transform (FFT), Open-circuit fault, Short-circuit fault.1. Introduction
In general of industrial drives and its applications, voltage source inverter (VSI) is commonly used in wide variety, including a number of critical application in which very high levels of reliability are required because of loss at VSI operation can have serious consequences. Cause of VSI faults, the effect of motor drive will stop drive running or at least it affects the drive performances. For example, in conveyor applications the drives motor has collapsed due to VSI failure. As mentioned [1] , the VSI faults have several fault can appear as open-circuit faults, short-circuit faults, and intermittent gate-misfiring faults. However, a VSI fault has certain limitations such as difficulty in detecting type of faults.
The recent research shows that the fault occurred in the power electronic are about 82.5 percent of faults occur in the VSI motor drives by Ricardo et al. [2, 3]. Also has been estimated by Diqi Zhu et al. and Shenlin et al. [2, 3] about 38 percent the fault in inverter driven industrial induction motors are due to malfunctioning of power
devices in the drive module. Then a survey was done by Thorsen and Dalva on the reliability of VSI for industrial drives. According to results of their survey, 50 percent of all failures are in the control circuit, 7.7 percent in the cooling fans, and 37.9 percent are in the power circuits. So from recent research and survey, faults in power electronics are large percentage of the VSI faults [4]. Due VSI faults is higher issues, analyze of faults is important in industrial drives, thus fault can identified early.
Different methods and analytical techniques were used to detection and identification the VSI faults. As an example, B. Raison et al [2] used Fast Fourier Transform (FFT) to analyzed current spectrum for detecting the characteristics of an open transistor [2, 5]. L. Zhang et al. [6] used time domain for analyze fault modes with characterized the patterns of the current waveform While F. Charfi et al.[7] examined information about the fault signatures for detection and classification fault using wavelet transform. But each technique has limitations and disadvantages for analyze the performance. For the FFT technique is does not appropriate for non-stationary signal and not provide temporal information [8].
Due to VSI faults signal in non-stationary pattern, this paper present time frequency distribution (TFD) which is spectrogram for analyze VSI faults. Spectrogram technique capable to represent parameter estimated in time frequency
* Dept. of Electrical Engineering, Uni.Tek.Malaysia Melaka,Malaysia ([email protected])
** Dept. of Electrical Engineering, Uni.Tek.Malaysia Melaka,Malaysia ([email protected])
*** Dept. of Electrical Engineering, Uni.Tek.Malaysia Melaka, Malaysia. ([email protected])
representation (TFR). Based on TFR, parameters of VSI current signal are estimated and used to identify open and short circuit switches fault based on current pattern then characteristic of VSI are calculated.
2. Voltage Source Inverter System
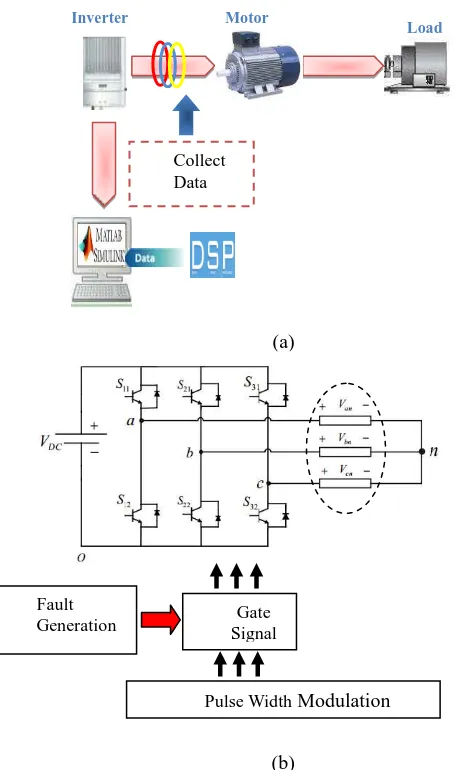
Voltage source inverter (VSI) is an electronic device which concern direct current (DC) to Alternating current (AC). VSI has advantages like higher efficiencies, minimizing installation timing, elimination interconnect power cabling costs and reducing building floor space. Fig.1 (a) shows the diagram of general system for this research and Fig.1 (b) shows the modeling of three-phase VSI with the fault generation. In the model S11 to S32 are Insulated Gate Bipolar Transistors (IGBTs) which can be on or off pulse width modulation (PWM) is a common technique for controlling the switches.
Fig. 1. (a) Diagram general of system
(b) The model of Voltage Source Inverter (VSI)
Commonly, intersective method is simplest way to generate a PWM signal, which requires a triangle waveform and a comparator. When the value of the references signal is more than the modulation waveform, the PWM signal is in the high state, otherwise it is in low state. Besides that, the module of fault generation that used for give pulse at switching gate signal means give disturbance at gate signal The switches fault VSI for open circuit fault condition, IGBT falls in the off state and remains in this situation regardless of the gate voltage value. Open circuit fault generally do not cause system shutdown, but degrade its performance. Fig. 2 show the model of circuit when VSI switches open circuit fault.
Fig. 2. The model of Voltage Source Inverter when Switches Open Circuit Fault
The short-circuit fault where this faults leads to catastrophic failure of the inverter if the other transistor of the same inverter leg is turned-on, this resulting in a direct short-circuit as show Fig.3
Fig. 3. The model of Voltage Source Inverter when Switches Short Circuit Fault
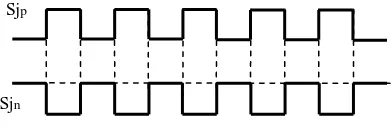
Based on modeling of three-phase VSI with the fault generation, the transistors are S11– S32 and the output stage is considered as a general R load. To control this VSI it was used the pulse width modulation (PWM) as switching to control the transistor. A switching function of the VSI is defined as Fig. 4, where j represents the phase, and variable p and n, respectively, represent the upper and lower Collect
Data Inverter Motor
Load
Gate Signal
Pulse Width Modulation Fault
Generation
(a)
(b)
IM
component of the phase leg. The switching status represent in term of “1” when the switch is closed and “0’ when open. The cause of fault in VSI for this paper depends on pulse width modulation (PWM). Such the fault is open circuit fault upper, open circuit fault lower, short circuit fault upper and short circuit fault lower [9-11].
Fig. 4. Gating signals of the inverter in an ideal case
The gate switching fault is one of cause open circuit and short circuit VSI. Based on Fig.5 and 6, gate pulse switching is one of causes fault VSI. Open circuit fault causes by gate pulse switching “0” then short circuit fault causes by gate pulse switching “1”.
Fig. 5. Gating signals of the inverter in an open-circuit fault
Fig. 6. Gating signals of the inverter in short-circuit fault
3. Result Time-Frequency Distribution
Spectrogram is one of the time-frequency representations (TFR) that represents a three-dimensional of the signal energy with respect to time and frequency. Time-frequency representations are used to analyze or characterize signals whose energy distribution varies in time and frequency. They map the one-dimensional time-domain signal into a two-dimensional function of time and frequency [12-14]. A time-frequency representation presents the variation of spectral energy over time [8-10]. In this paper, time-frequency analysis technique which is spectrogram is used to analyze the faults signal. Spectrogram is the squared magnitude of the Short Time
Fourier Transform (STFT) and can be expressed as below. Where h(t ) is the input signal while w(t) is the window function. This technique depends on window size since it results better time resolution and lower frequency resolution by using smaller window size and vice versa[12, 13, 15, 16].
2 2
( , )
( ) (
)
j fx
S t f
h
w
t e
d
(1)4. Parameter Estimation
Parameters of the faults signal are estimated from the TFR to identify the characteristics of VSI faults.
4.1 Instantaneous Average Current
0
1
( )
,
T
I
I
rms
t dt
rms ave
T
(2)4.2 Instantaneous Root Mean Square [17]
The equation below from, Sx(t,f) is the distribution and fmax is the maximum frequency of interest.
max0
( , )
frms x
I
t
S t f df
(3)4.3 Instantaneous RMS Fundamental Current
The instantaneous RMS fundamental current is as the RMS current at power system frequency [12, 15, 18] can be calculated as
1
1 1
( ) 2 ( , )
,
2 2
hi
lo f
rms x
f
hi lo
I t S t f df
f f
f f f f
(4)4.4 Instantaneous Total Waveform Distortion
The total waveform distortion consists of harmonic and non-harmonic distortion. The TWD can be defined
2 2
1
1
( )
( )
( )
rms rms
rms
V
t
V
t
TWD(t)
V
t
(5)Sjp
Sjn
Sjp
Sjn
Sjp
4.4 Instantaneous Total Harmonic Distortion
THD is commonly used to measure harmonic
distortion in signal. Harmonics have frequency that
are
integer multiples of the waveform’s fundamental
frequency [18]Such as, given a fundamental
frequency 60 Hz, the harmonics component will be
120 Hz, 180 Hz and 240 Hz.
2 , 2
1 H
h rms h
rms
V
(t)
THD(t)
V
(t)
(6)4.4 Instantaneous Total Non-Harmonic
Total non-harmonic represents total non-harmonic distortion. Non-harmonic refer are signal not integers multiples of the fundamental frequency [1212, 14, 19]. For example, the fundamental frequency given 60 Hz, the interharmonic will be 70 Hz, 85 Hz.
2 2
, 0
1
( )
( )
( )
Hrms h h rms
rms
V t
V
t
TnHD(t)
V
t
(7)5. Results
The results of analysis the VSI switches open and short fault are represented from Fig. 7 to Fig. 14. That signal consists of three-phase which is phase A, phase B and phase C. The red color represent phase A, green color represent phase B and blue color represent phase C.
Based on the shown Table 1, that considers dc supply, carrier frequency (Hz), IGBT and fundamental frequency (Hz). From simulation, the result of open-circuit and short-circuit faults for upper and lower switches has been analyze and calculate all characteristic of parameter
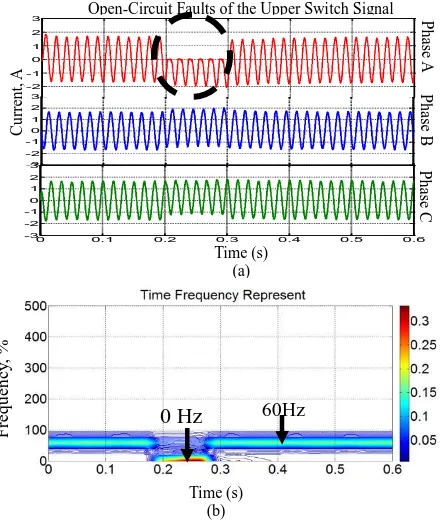
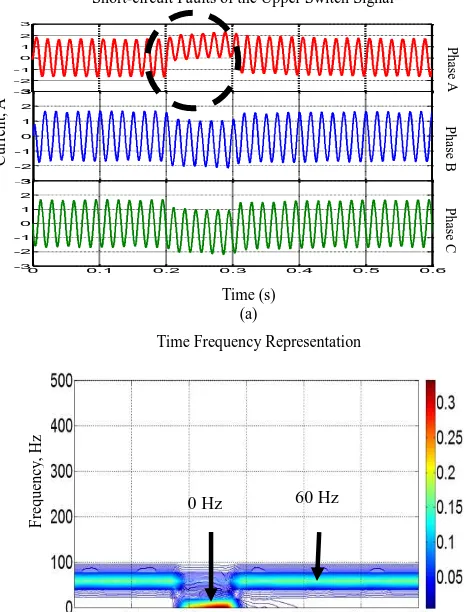
5.1 Open Circuit Switches Fault in VSI (Upper Fault)
The fault analysis done by using spectrogram technique, we can see observe from Fig.7 (a) for the fault in phase A there is discontinuity in the signal and the severity of the fault can be clearly understood by spectrogram analysis. According on signal, fault current occur at 0.2 – 0.3 s where current at phase A lower compare phase B and C. From the TFR that display time, frequency and amplitude on the same graph and as can be seen two frequency detected. Fig. 7(b) the higher power of signal in the contour plot is represented in red color, while the lowest in blue color. Based on result, TFR shows the 60 Hz for fundamental frequency and frequency of VSI fault at DC component is 0 Hz
Fig.7. (a) Signal of Open-Circuit Fault Upper (b) Spectrogram open-circuit fault upper
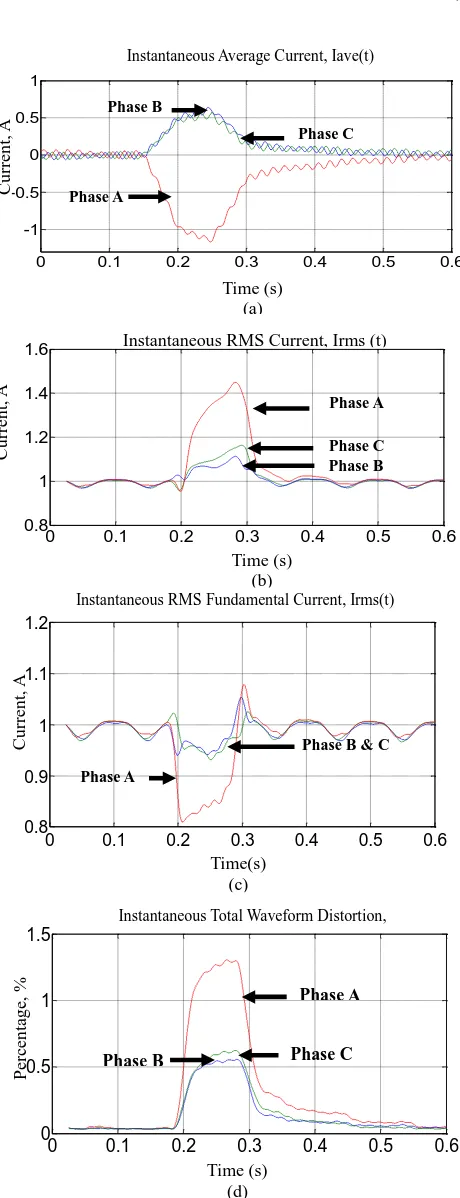
From the TFR, the parameters are estimated for all phase in per unit (pu). For Fig. 8(a), the instantaneous average current phase A is greater while phase B and C, respectively is lower than zero between 0.2 and 0.3 s. From the observed on Fig. 8(b), the RMS value of magnitude of the phase A momentary decrease at 0.2 – 0.3 s compare with phase B and C. The RMS fundamental value for phase A is lower but phase B and C is higher show as Fig. 8(c). Lastly, the value of THD is 1 percent for phase A but phase B and C is below than 0.5 percent shown in Fig.8(d) respectively.
Table 1. Voltage source inverter specifications Parameter, unit Value
DC supply, V 50
Carrier frequency, Hz 5kHz Snubber resistance 1 x 10⁵ Internal resistance 1 x 10⁶ Fundamental frequency 60Hz
P
h
ase
A
Open-Circuit Faults of the Upper Switch Signal
P
h
ase
B
P
h
ase
C
Time (s) (a)
0 0.1 0.2 0.3 0.4 0.5 0.6
-3 -2 -1 0 1 2 3
0 0.1 0.2 0.3 0.4 0.5 0.6
-3 -2 -1 0 1 2 3
-3 -2 -1 0 1 2 3
C
u
rr
en
t,
A
Time (s) (b)
F
re
q
u
en
cy
,
%
Fig.8. Parameter Estimation for open-circuit fault upper (a) Instantaneous Average Current, Iave(t) (b) Instantaneous RMS Current, Irms(t) (c) Instantaneous RMS Fundamental Current,
Irms(t)
(d) Instantaneous Total Waveform Distortion, TWD(t)
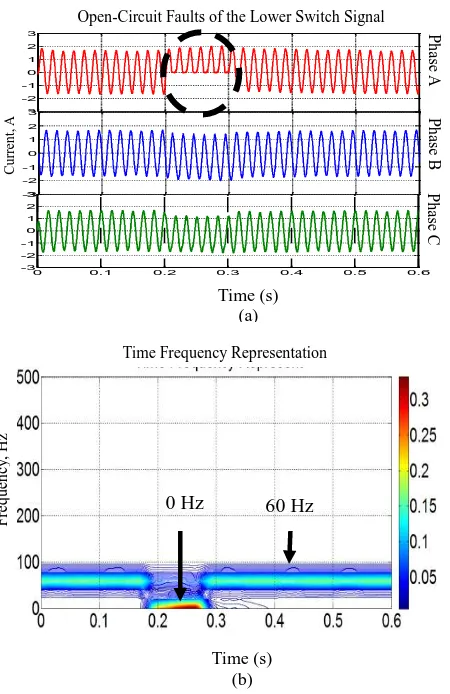
5.2 Open Circuit Switches Fault in VSI (Lower Fault)
Fig. 9(a) shows the three-phase VSI for fault at lower switches. We can see, observation from the open-circuit fault lower signal where current phase A higher than phase B and C. The current phase A increase starting from 0.2 – 0.3 s but phase B and C respectively.
Fig. 9. (a) Signal of Open-Circuit Fault Lower (b)Spectrogram Open-Circuit Fault Lower Based on result, the contour of TFR detect 60 Hz for fundamental frequency and fault current at DC component (0 Hz) at phase A. Based on TFR, the instantaneous average current, instantaneous RMS current, instantaneous RMS fundamental are estimated as shown in Fig. 10(a) – (d). Fig. 10(a) show the average current for phase A is higher while phase B and C is lower. The current is higher at phase A when RMS value result compares than phase B and C. Besides that, the RMS fundamental value is lower compare at phase A and higher current at phase B and C, respectively. From all parameter, the percentage of THD for the open circuit at lower fault is higher than 1 percent while both of phase B and C is lower 1 percent
0 0.1 0.2 0.3 0.4 0.5 0.6 -1
-0.5 0 0.5 1
Time (sec)
Instantaneous Average Current, Iave(t)
Time (s) (a)
Cu
rre
n
t,
A Phase B & C
Phase A
0 0.1 0.2 0.3 0.4 0.5 0.6
0.7 0.8 0.9 1 1.1
Cu
rre
n
t,
A
Time (s) (c)
Instantaneous RMSFundamental Current, Irms(t)
Phase C
Phase A
Phase B
0 0.1 0.2 0.3 0.4 0.5 0.6 0
0.5 1 1.5
Instantaneous Total Waveform Distortion, TWD(t)
P
erc
en
tag
e,
%
Time (s) (d) Phase A
Phase B & C
0 0.1 0.2 0.3 0.4 0.5 0.6
-3 -2 -1 0 1 2 3
P
h
ase
A
P
h
ase
B
P
h
ase
C
Open-Circuit Faults of the Lower Switch Signal
0 0.1 0.2 0.3 0.4 0.5 0.6
-3 -2 -1 0 1 2 3
Time (s) (a)
C
ur
re
nt,
A
0 0.1 0.2 0.3 0.4 0.5 0.6
-3 -2 -1 0 1 2 3
0 0.1 0.2 0.3 0.4 0.5 0.6 0.85
0.9 0.95 1 1.05 1.1
Instantaneous RMS Current, Irms(t)
Cu
rre
n
t,
A Phase C
Phase A
Phase B
Time (s) (b)
Time Frequency Representation
F
re
q
u
en
cy
,
H
z
Time (s) (b)
0 0.1 0.2 0.3 0.4 0.5 0.6 0.7
0.8 0.9 1 1.1
Fig.10. Parameter Estimation for open-circuit fault upper
(a) Instantaneous Average Current, Iave(t) (b) Instantaneous RMS Current, Irms(t) (c) Instantaneous RMS Fundamental Current,
Irms(t)
(d) Instantaneous Total Waveform Distortion, TWD(t)
5.3 Short Circuit Switches Fault in VSI (Upper Fault)
Fig. 11(a) shows signal short circuit switches fault where three-phase current indicate the fault also occur at phase A where current signal is increase at 0.2 – 0.3 s. At current signal at phase B and C is decrease when fault occur. Based on Fig. 11(b), the TFR detect two frequency at faults signal, where fundamental and fault frequency. From the contour, the spectrogram is show three-axis where the detect fault at DC component is 0 Hz and 60 Hz for fundamental frequency.
Fig.11. (a) Signal of Short-Circuit Fault Upper (b) Spectrogram Short-Circuit Fault Upper Fig. 12 (a) shows the average current, phase A is higher compare phase B and C at 0.2 – 0.3 s. During the RMS current, the phase A is phase faults occur where the value of current is higher compare with phase B and C as shows Fig. 12(b). According Fig.12 (c), the RMS fundamental for phase A is momentary decrease but other phase is higher than phase fault occurring. While, value of TWD gives 1.4 percent and phase B and C is below than 1 percent as show Fig. 12 (d).
0 0.1 0.2 0.3 0.4 0.5 0.6 -0.5
0 0.5 1
Time (sec)
A
m
p
li
tu
d
e
Instantaneous Average Current, Iave(t)
C
u
rr
en
t,
A
Time (s) (a)
Phase A
Phase B & C
Instantaneous RMS Fundamental Current, Irms(t)
Phase A Phase B Phase C
Time (s) (c)
C
u
rr
en
t,
A
0 0.1 0.2 0.3 0.4 0.5 0.6 0
1 2 3
Instantaneous Total Waveform Distortion, TWD(t)
P
er
ce
n
ta
g
e,
%
Phase A
Phase B & C
Time (s) (d)
0 0.1 0.2 0.3 0.4 0.5 0.6 -3
-2 -1 0 1 2 3
0 0.1 0.2 0.3 0.4 0.5 0.6
-3 -2 -1 0 1 2 3
0 0.1 0.2 0.3 0.4 0.5 0.6
-3 -2 -1 0 1 2 3
C
u
rr
en
t,
A
P
ha
se
A
P
ha
se
B
P
ha
se
C
Time (s) (a)
Short-circuit Faults of the Upper Switch Signal
F
re
q
u
en
cy
,
H
z
Time Frequency Representation
Time (s) (b)
0 Hz 60 Hz
0 0.1 0.2 0.3 0.4 0.5 0.6
0.9 0.95 1 1.05 1.1 1.15
Time (s) (b)
Instantaneous RMS Current, Irms(t)
C
u
rr
en
t,
A
Phase C
Fig.12. Parameter Estimation for short-circuit fault Upper
(a) Instantaneous Average Current, Iave(t) (b) Instantaneous RMS Current, Irms(t) (c) Instantaneous RMS Fundamental Current,
Irms(t)
(d) Instantaneous Total Waveform Distortion, TWD(t)
5.4 Short Circuit Switches Fault in VSI (Lower Fault)
Fig. 13(a) shows the signal short-circuit faults of the lower switch where switch at phase A fault at 0.2-0.3s. The current momentary decrease and for phase B and C have certain distortion. According TFR shows harmonics and interharmonics that occurred as represented Fig. 13(b). As previous results, faults occurred at dc component and at 60 Hz.
Short-circuit Faults of the Lower Switch Signal
Fig.13. (a) Signal of Short-Circuit Fault Lower (b) Spectrogram Short-Circuit Fault Lower
The parameter that estimated from TFR with the instantaneous average current for phase A is lower than phase B and C as shows Fig. 14(a). But for the RMS current value, phase A is higher while phase B and C is lower, respectively as Fig. 14(b). For the instantaneous RMS fundamental current on Fig. 14(c), phase A is lower than phase B and C. Besides that, instantaneous waveform distortion as shows in Fig. 10(d), where faults signal occur at DC component, there TWD gives 1.42 percent but phase B and C is below then 1 percent.
0 0.1 0.2 0.3 0.4 0.5 0.6
0 0.5 1 1.5
Phase A
Phase C
Phase B
Instantaneous Total Waveform Distortion, TWD(t)
P
erc
en
tag
es,
%
Time (s) (d)
P
ha
se
C
0 0.1 0.2 0.3 0.4 0.5 0.6
-3 -2 -1 0 1 2 3
0 0.1 0.2 0.3 0.4 0.5 0.6
-3 -2 -1 0 1 2 3
0 0.1 0.2 0.3 0.4 0.5 0.6
-3 -2 -1 0 1 2 3
Cu
rre
n
t,
A
Time (s) (a)
P
ha
se
A
P
ha
se
B
Instantaneous Average Current, Iave(t)
0 0.1 0.2 0.3 0.4 0.5 0.6
-0.5 0 0.5 1
Cu
rr
e
n
t(
A
)
Time (s) (a) Phase A
Phase B Phase C
Cu
rre
n
t,
A
Fre
q
u
en
cy
,
Hz
Time Frequency Representation
Time (s) (b)
0 Hz 60 Hz
0 0.1 0.2 0.3 0.4 0.5 0.6 0.8
1 1.2 1.4 1.6
Instantaneous RMS Current, Irms(t)
Time (s) (b)
Cu
rre
n
t,
A Phase A
Phase B Phase C
0 0.1 0.2 0.3 0.4 0.5 0.6
0.8 0.9 1 1.1 1.2
Instantaneous RMS Fundamental Current, Irms(t)
Cu
rre
n
t,
A
Time (s) (c) Phase A
Fig. 14. Parameter Estimation for short-circuit fault lower
(a) Instantaneous Average Current, Iave(t) (b) Instantaneous RMS Current, Irms(t)
(c) Instantaneous RMS Fundamental Current,Irms(t) (d) Instantaneous Total Waveform Distortion
According all results that shows four patterns which is open circuit fault upper, open circuit fault lower, short circuit fault upper and short circuit fault lower, the
parameter that estimate gives information for detect type of fault. Fig. 15 shows the bar graph indicates that error of current detection for VSI faults can be known from the parameter estimation by applying TFD. The condition of each fault can be identifying according to the result as a bar graph below. The details of each fault are shows in table 1 and 2
In order to find out the relation between parameter to detect condition of the VSI faults have been conducted. Analysis results were made based on current parameter estimation from spectrogram. Table 1 shows general of current error during fault detected. Next, Table 2 shows overall observation of current error from parameter estimation. From the observation of average current, that found the value of IB is equal IC but less than 0.5 and other of current is IB equal with IC. Both of current is greater than
0.5 and less than zero. Next, the open-circuit lower can be detect with IA below than 1, respectively is greater than zero. For this condition IA is greater than 1 but IA less than zero. higher than zero for open circuit fault upper. Besides that, the current error at phase A is greater than 1 when short circuit fault upper detected. But other IA is less than 1. When short-circuit lower, IA less than -1 and other IA is greater than -1. On the other hand, the error of rms current when open circuit fault either upper and lower, value IA is equal IC but for short-circuit is IA different IC. During short circuit fault upper detected, value of IB is greater than IC and other fault IB is greater than IC. Then, open circuit fault can be detected during RMS fundamental current IA is greater than IB and IC, where both of current are equal. But, short circuit fault can be detected IA is greater than IC and greater then IB. Lastly, table 2 give summaries of characteristic for each fault cased on error current where average current is important used to detect type of faults. The rules based on error current detection during fault are used to detection the faults event instanteously are summaries in Table 1.
Table 1. General of current error during fault
Switch Type of fault Current Observation Upper Open Average IA < (IB =IC)
(I I ) >0 RMS (IA = IC )> IB
Short
Average IA> (IB =IC)
(I I ) <0 RMS (IA = IC )> IB
Lower Open Average IA> (IB =IC)
(I I ) <0 RMS IA> IB > IC
Short Average IA < (IB =IC)
(I I ) >0 RMS IA> IC > IB
Cu
rre
n
t,
A
Instantaneous Average Current, Iave(t)
0 0.1 0.2 0.3 0.4 0.5 0.6 -1
-0.5 0 0.5 1
Time (S)
Cu
rr
e
n
t(
A
)
Time (s) (a) Phase B
Phase C
Phase A
Cu
rre
n
t,
A
0 0.1 0.2 0.3 0.4 0.5 0.6
0.8 1 1.2 1.4
1.6 Instantaneous RMS Current, Irms (t)
Time (s) (b)
Phase A
Phase B Phase C
Phase B & C
0 0.1 0.2 0.3 0.4 0.5 0.6 0.8
0.9 1 1.1 1.2
Cu
rre
n
t,
A
Instantaneous RMS Fundamental Current, Irms(t)
Time(s) (c) Phase A
Phase B & C
0 0.1 0.2 0.3 0.4 0.5 0.6 0
0.5 1 1.5
P
erc
en
tag
e,
%
Instantaneous Total Waveform Distortion, TWD(t)
Time (s) (d)
Phase C Phase A
Fig. 15. The bar graph for error of current detection
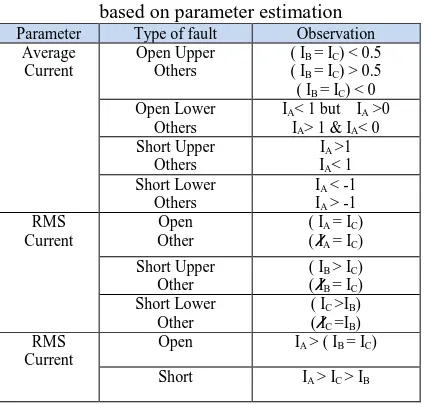
Table 2. Characteristic for each fault detection based on parameter estimation
Parameter Type of fault Observation Average
Current
Open Upper Others
( IB = IC) < 0.5
( IB = IC) > 0.5
( IB = IC) < 0
Open Lower Others
IA< 1 but IA >0
IA> 1 & IA< 0
Short Upper Others
IA >1
IA< 1
Short Lower Others
IA < -1
IA > -1
RMS Current
Open Other
( IA = IC)
( IA = IC)
Short Upper Other
( IB > IC)
( IB = IC)
Short Lower Other
( IC >IB)
( IC =IB)
RMS Current
Open IA > ( IB = IC)
Short IA > IC > IB
6. Conclusion
The analysis and detection system of type VSI faults is
presented using TFD. From the parameter calculation,
the TFR is estimated to identify fault signal parameter
and then, from the parameters, fault signal
characteristic can be calculated. Next, the characteristic
for each fault detection can be identifying based on
current error. The performance of the faults system is
verified by the value current error which is average
current and fundamental current. It shows the VSI
faults can be identified depends on value parameter
estimation. So, the detection faults can be early and
fault in VSI will be decrease.
Acknowledgment
Faculty of Electrical Engineering, Universiti Teknikal Malaysia Melaka
References
[1] Trabelsi, M., et al. An improved diagnosis technique for IGBTs open-circuit fault in PWM-VSI-fed induction motor drive. in Industrial Electronics (ISIE), 2011 IEEE International Symposium on. 2011.
[2] Bin, L. and S. Sharma. A Literature Review of IGBT Fault Diagnostic and Protection Methods for Power Inverters. in Industry Applications Society Annual Meeting, 2008. IAS '08. IEEE. 2008.
[3] Fuchs, F.W. Some diagnosis methods for voltage source inverters in variable speed drives with induction machines - a survey. in Industrial Electronics Society, 2003. IECON '03. The 29th Annual Conference of the IEEE. 2003.
[4] Bojoi, R., M.G. Neacsu, and A. Tenconi. Analysis and survey of multi-phase power electronic converter topologies for the more electric aircraft applications. in Power Electronics, Electrical Drives, Automation and Motion (SPEEDAM), 2012 International Symposium on. 2012.
[5] B. Raison, G.R.a.J.P.R., Towards a Global Monitoring Scheme for Induction Motor Drives. Proc. Int. Power Electron. Conf.2000, 2000: p. pp. 1183-1188.
[6] L. Zhang, I.B.A.a.L.N.H., A Knowledge-Based System forOn-line Fault Diagnosis of Power Inverter Circuits for AC machines. 1995.
[7] F. Charfi, F.S.a.K.A.-H., Fault diagnosis in power system using wavelet transforms and neural networks. 2006.
[8] Rioul, O. and M. Vetterli, Wavelets and signal processing. Signal Processing Magazine, IEEE, 1991. 8(4): p. 14-38.
[9] Jardan, K.R., S.B. Dewan, and G.R. Slemon, General Analysis of Three-Phase Inverters. Industryand General Applications, IEEE Transactions on,1969. IGA-5(6): p. 672-679.
[10] Sibasish Pandaa, A.K.P.a.H.N.P., Fault Analysis on Grid Connected MPPT based Photovoltaic System. International Journal of Current Engineering and Technology, 2013.
[11] Abdullah, A.R., et al. Short-circuit switches faultanalysis of voltage source inverter using spectrogram. in Electrical Machines and Systems (ICEMS), 2013 International Conference on. 2013. [12] Abdullah, A.R., et al. Open switch faults analysis in
voltage source inverter using spectrogram. in Power Engineering and Optimization Conference (PEOCO), 2013 IEEE 7th International. 2013.
[13] Abidin, N.Q.Z., et al. Leakage current analysis on polymeric surface condition using time-frequency distribution. in Power Engineering and Optimization Conference (PEDCO) Melaka, Malaysia, 2012 Ieee International. 2012.
[14] Bin Abdullah, A.R., A.Z. Bin Sha'ameri, and A.B. Jidin. Classification of power quality signals using smooth-windowed Wigner-Ville distribution. in Electrical Machines and Systems (ICEMS), 2010 International Conference on. 2010.
[15] Abdullah, A.R., A.Z. Sha'ameri, and N.M. Saad.Power quality analysis using spectrogram and gabor transformation. in Applied Electromagnetics, 2007. APACE 2007. Asia-Pacific Conference on.2007. [16] Abdullah, A.R. and A.Z. Sha'ameri.
Powerqualityanalysis using linear time-frequency distribution. in Power and Energy Conference, 2008. PECon 2008. IEEE 2nd International. 2008.
[17] R.C.Dugan, S.S., M. f. McGranaghan and H.W.beaty, Electrical Power System Quality. McGraw Hill 2002. [18] M.T.Thompson, A.K.a., Power Quality in Electrical
Systems. McGraw Hill, 2007.
[19] Gu, H.J.B.a.Y.H., Signal Processing of Power Quality. Wiley-Interscience , 2006.
Nur Sumayyah Bt Ahmad was born in Terengganu, Malaysia, on November 6 on 1988. She received B. Eng. degrees with honours in electrical engineering from the Universiti Teknikal Malaysia Melaka (UTeM) on 2012. Currently, she is a master degree student researcher in electrical engineering at Universiti Teknikal Malaysia Melaka (UTeM).
Dr. Abdul Rahim Abdullah was born in
Kedah, Malaysia on 1979. He received his B. Eng., Master, PhD Degree from University of Technology Malaysia in 2001, 2004 and 2011 in Electrical Engineering and Digital Signal Processing. He is currently a Senior Lecturer and Coordinator of Center of Excellent Robotic and Industrial Automation (CeRiA) in Universiti Teknikal Malaysia Melaka (UTeM)