DESSY ANGGRAENI
GRADUATE SCHOOL
BOGOR AGRICULTURAL UNIVERSITY
BOGOR
STATEMENT OF THESIS, SOURCE OF INFORMATION
AND COPYRIGHT TRANSFER*
I hereby declare that thesis titled Price Volatility Analysis of Rice in Indonesia: The Impact of Stock and Changes in Policy, is my work under the direction of the advisory committee and has not been submitted in any form to any other universities. Sources of information derived or quoted from works published and unpublished by other authors have been mentioned in the text and listed in the References at the end of this master thesis.
I hereby transfer the copyright of my master thesis to the Bogor Agricultural University.
Bogor, August 2015
Dessy Anggraeni H451110141
SUMMARY
those drivers to overall volatility measurement. There is overwhelming evidence in recent literature showing that volatility has generally been lower put the variability has been high, with the important exception of rice. The work covered in this thesis is motivated by the complex challenges of rice price stabilization in Indonesia. As most rural households are both producers and consumers of rice, unbalanced proportion between rice productions and price can be harmful to households living in poverty or at the brink of poverty. This research is a contribution to the studies on the econometric estimation of price volatility and impact of its policy mitigations. The estimation is based on daily rice price from January 2006 to December 2013 with total 2086 observations, obtained from Trade Ministry of Indonesia. Meanwhile, estimated stock data was obtained from USDA WASDE from the same period. First, basic GARCH model is applied to estimate rice price volatility. Then, macroeconomic variable of interest is tested using GARCH-X with the introduction of external regressors as proxy. These external regressors are tested both on mean model and variance model.Formally, the research objectives are formulated as follow: 1) to understand what is the volatility trend of rice price in Indonesia, 2) to explore possible influential macroeconomic variables to rice price volatility measurement in Indonesia, and 3) to test the significance impact the above variables to the development of rice price volatility measurement in Indonesia.
The main conclusions of this thesis are as follow. First, in order to understand the volatility trend of rice price in Indonesia, we applied empirical method to historical rice price data. The result shows that the volatility of rice price was driven more by its own-variance rather than external shocks. Introduction of relevant external regressors such as stock level estimations or dummy vector for other macroeconomic variable to GARCH-X were found to be able to overall volatility estimation. Parameters of these external regressors were statistically significant to better describe price observations in GARCH-X model. However, the impacts of these external regressors are very small compare to the impacts of own-variance or external shocks.
Second, all four microeconomics variable tested are proven to have impact on overall volatility. This means that the introduction of relevant external regressors such as stock level estimations, rice harvest seasonality, international rice price or dummy vector for other macroeconomic variable to GARCH-X can help improve the overall volatility estimation.
With the above conclusions, the author can suggest the following recommendation. In relation to price stabilization, it is important to develop an effective and efficient rice supply chain that involves all market stakes holder in a balanced and proportional way. This can be done by removing obstacles in each chain of rice supply chain by improving transportation means and infrastructure, simplify administration process, and reliable monitoring mechanisms. Due to production uncertainties and food price volatility, government needs to be more flexible especially in relation to food policy in order to make faster response to any situations. It is important to hold sufficient amount of rice at storage in order to cope up with ongoing food issues.
RINGKASAN
DESSY ANGGRAENI. Analisis Volatilitas Harga Beras di Indonesia: Efek Stok dan Perubahan Kebijakan. Supervised by ANDRIYONO KILAT ADHI, AMZUL RIFIN, and BERNHARD BRÜMMER.
Studi ini bertujuan untuk memahami tren volatilitas harga beras di Indonesia, dengan cara mempelajari faktor-faktor yang berpengaruh dan menguji seberapa besar pengaruh dari fakrot-faktor tersebut terhadap keseluruhan estimasi fluktuasi harga. Berdasarkan studi literatur yang banyak ditemukan akhir-akhir ini, tingkat fluktuasi harga untuk berbagai komoditas pertanian cenderung rendah, kecuali untuk beras. Studi ini tergerak untuk mengetahui berbagai tantangan dalam menstabilkan harga beras di Indonesia. Sebagian besar rumah tangga di pedesaan berperan baik sebagai produsen dan konsumen beras, dengan demikian proporsi yang tidak seimbang antara jumlah beras yang diproduksi dengan harga yang terbentuk di pasar akan sangat merugikan bagi rumah tangga miskin dan berada diambang batas kemiskinan. Penelitian ini memberikan kontribusi bagi studi tentang estimasi ekonometrika terhadap volatilitas harga dan pengaruh kebijakan penanggulangannya. Estimasi pada studi ini dilakukan berdasarkan data harga beras nasional mulai bulan Januari 2006 hingga Desember 2013 dengan total 2086 observasi, di mana data tersebut diperoleh dari Departemen Perdagangan Republik Indonesia. Sementara itu, estimasi jumlah stok beras menggunakan data dari USA WASDE untuk periode yang sama. Pada tahap awal, model GARCH digunakan untuk memperkirakan volatilitas harga beras. Selanjutnya, beberapa variable makroekonomi yang diteliti dimasukkan ke dalam model GARCH-X sebagai regresor eksternal. Seluruh regresor eksternal tersebut diuji baik pada model rata-rata dan model varians. Hasil pendugaan menunjukkan bahwa volatilitas harga beras lebih banyak didorong oleh variansnya sendiri dibandingkan guncangan eksternal.
Secara formal, tujuan penelitian dapat diformulasikan sebagai berikut: 1) memahami trend volatilitas harga beras di Indonesia, 2) mengekplorasi beberapa variabel makroekonomi yang berpengaruh terhadap pengukuran volatilitas harga beras di Indonesia, 3) menguji dampak signifikan variable-variable tersebut terhadap pengukuran volatilitas harga beras di Indonesia.
Ada 3 kesimpulan utama yang bisa diambil dari hasil penelitian ini. Pertama, volatilitas harga beras didorong lebih oleh variasinya sendiri dibandingkan lonjakan yang berasal dari luar. Dengan mempertimbangkan regresor eksternal yang relevan, seperti tingkat stok atau vector dummy sebagai variable makroekonomi pada model GARCH-X, maka secara keseluruhan estimasi model volatilitas harga beras dapat dijelaskan dengan lebih baik. Parameter-parameter untuk regresor eksternal tersebut teruji signifikan secara statistic dan dapat menjelaskan deret harga pada model GARCH-X. Namun, pengaruh dari regresor eksternal tersebut terbukti sangat kecil bila dibandingkan dengan pengaruh variasi deret harganya sendiri atau pun pengaruh luar lainnya.
vector dummy untuk makroekonomi, ke dalam model GARCH-X dapat membantu memperbaiki keseluruhan estimasi volatilitas harga.
Ketiga, berdasarkan hasil uji diagnostic, kami menemukan bahwa variabel-variabel yang diuji berpengaruh signifikan terhadap model. Dengan membandingkan hasil diagnostic test, maka kombinasi antara dummy matrx untuk kebijakan pangan sebelum dan seudah tahun 2009, dengan estimasi stok dapat memberikan kesesuaian model yang paling baik. Namun, variabel lainnya juga terbukti memiliki pengaruh, walau pun lebih rendah, terhadap pemodelan volatilitas harga beras.
Dengan demikian, penulis dapat merekomendasikan beberapa hal berikut. Dalam rangka menstabilkan harga, penting sekali untuk memastikan kestabilan rantai pasok beras, dengan demikian setiap agen dalam distribusi beras dapat berperan secara seimbang dan sesuai proporsinya. Salah satu jalan yang dapat ditempuh untuk mencapai hal ini adalah dengan menhilangkan segala bentuk rintangan yang mungkin menghambat kelancaran rantai pasok, contohnya dengan memperbaiki sarana transportasi dan infrastruktur, menyederhanakan proses administrasi pergudangan, dan mengaplikasikan mekanisme monitoring yang handal. Untuk mengatasi ketidakpastian dan volatilitas harga, pemerintah perlu lebih fleksibel terutama dalam kaitannya dengan kebijakan pangan, sehingga dapat memberikan respon yang cepat pada berbagai situasi. Pemerintah juga perlu untuk memiliki cadangan beras yang cukup untuk menghadapi berbagai kendala pada penyediaan bahan pangan utama.
© All Rights Reserved by Bogor Agricultural University, 2015
Copyright Reserved
It is prohibited to quote part or all of this paper without including or citing the source. Quotations are only for purposes of education, research, scientific writing, preparation of reports, critics, or review an issue; and those are not detrimental to the interest of the Bogor Agricultural University.
PRICE VOLATILITY ANALYSIS OF RICE IN INDONESIA:
THE IMPACT OF STOCK AND CHANGES IN POLICY
DESSY ANGGRAENI
Master thesis
as one of the requirements to obtain a degree of Magister Sains
in
Master of Science in Agribusiness Study Program
GRADUATE SCHOOL
BOGOR AGRICULTURAL UNIVERSITY
BOGOR
Examiner Commission on Affairs of Master Thesis Examination:
Thesis Title : Price Volatility Analysis of Rice in Indonesia: The Impact of Stock and Changes in Policy Name : Dessy Anggraeni
NRP : H451110141
Approved by Advisory Committee
Dr Ir Andriyono Kilat Adhi Chairman
Dr Amzul Rifin, SP, MA Member
Prof Dr Bernhard Brümmer Member
Agreed by Head of Agribusiness Study Program
Prof Dr Ir Rita Nurmalina, MS
Dean of Graduate School
Dr Ir Dahrul Syah, MScAgr
ACKNOWLEDGMENT
I would like to express the deepest appreciation to my advisory committee chair Dr. Ir. Andriyono Kilat Adhi, who has shown the attitude and the substance of a great mentor: he continually and persuasively conveyed a spirit of adventure in regard to research and scholarship, and an excitement in regard to teaching. Without his supervision and constant help this dissertation would not have been possible.
I would like to thank my committee members, Dr. Ir. Amzul Rifin, MA., Prof. Dr. Bernhard Brümmer and Dr. Tinoush Jamali Jaghdani, whose work demonstrated to me that concern for farm economics theory in the context of global and open market society, should always transcend academia and provide a quest for our times.
In addition, a thank you to Prof. Dr. Ir. Rita Nurmalina, MS., who always encourage me to pursue higher, and whose passion for the agribusiness had lasting effect. I thank the Bogor Agricultural University and University of Göttingen for providing supportive academia environment. I also thank Beasiswa Unggulan by Planning and Cooperation of Foreign Affairs (BPKLN) Ministry of Education and Culture of Indonesia for their financial support granted through Joint-Degree Master Program scholarship. I also want to thank to my fellow classmates of Magister Sains Agribisnis (MSA) in their ceaseless supports during my thesis writing.
Bogor, August 2015
LIST OF TABLES ix
LIST OF FIGURES ix
LIST OF APPENDICES ix
LIST OF ABBREVIATIONS x
1 INTRODUCTION 1
Background 1
Problem Statement 3
Research Objectives 6
Benefit of the Study 7
Scope and Limitation of the Study 8
2 LITERATURE REVIEW 8
Commodity Price Dynamics 8
Sources of Price Shocks 14
Mitigation Strategy 19
Storage Arbitrage 21
Definition, measurement, and drivers of price volatility 22
3 FRAMEWORK 27
Types and Sources of Data 27
Theoretical Framework 27
Operational Framework 29
4 RESEARCH METHODOLOGY 31
GARCH 31
GARCH-X 32
5 RESULT 34
Rice Price Volatility in Different Period 34
Rice Price Development 2006 – 2013 35
Policy Implications 43
6 CONCLUSION AND RECOMMENDATIONS 44
Conclusions 44
Recommendations 44
REFERENCES 46
APPENDICES 50
LIST OF TABLES
1 Comparison of standard deviation and coefficient of variations 6
2 Rice sowing and harvest period in Indonesia 12
3 Government purchasing price 2002–2012 20
4 ADF test for unit root of rice price in levels and returns 34 5 Summary statistics of rice price in level and returns 34
6 GARCH and GARCH-X estimates 39
LIST OF FIGURES
1 Consumer Price Index in Indonesia 2006 - 2013 4
2 Domestic rice price Indonesia compare to international price 2005 - 2013
(in USD per Tonnes) 4
3 Variable supply and fix demand curve 9
4 Paddy harvesting pattern 2012 - 2013 13
5 Rice harvested area (Ha) in Indonesia in 2000–2013 13 6 Supply chain of paddy grain and rice in Karawang Region 16 7 BULOG stock mechanism to replenish and distribute rice stocks 26
8 Operational framework 29
9 Flow chart estimation process for GARCH and GARCH-X 30
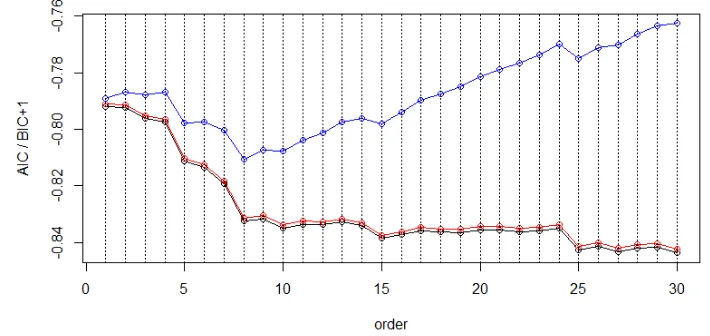
10 AIC and BIC criteria for AR lag from 1-30 35
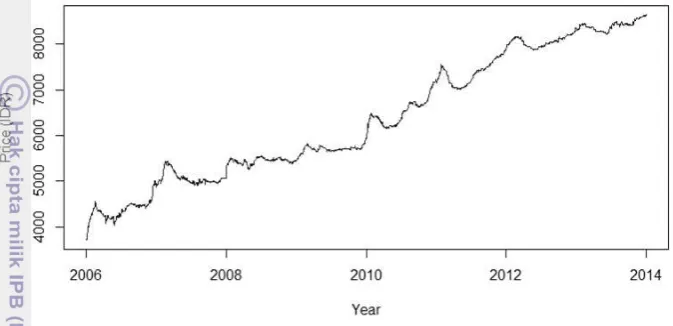
11 Domestic rice price in Indonesia 2006 - 2013 36
12 Daily return of rice price in Indonesia 2006-2013 37
13 Daily squared return of rice price in Indonesia 2006-2013 37 14 Estimation of beginning stock level of government stock 2006-2013 38 15 Comparison of actual rice price return and simulated return 42
16 Conditional variance of rice price return 43
LIST OF APPENDICES
1 The history of Indonesian food policy from 1969 to now 50
2 Summary food policy in Indonesia after 2009 51
3 ACF and PACF result of rice return 52
4 GARCH(1,1) Fit Diagnostic Result 53
5 R simulation result of GARCH-X with 2 external regressors: estimation of stock in variance model and rice harvest season in mean model 54
LIST OF ABBREVIATIONS
BKP : Badan Ketahanan Pangan
(Indonesian Food Security Agency) BLBI : Bank of Indonesia Liquidity Support
BULOG : Indonesian National Food Logistic Agency. A state-owned enterprise (BUMN) which was established through Government Regulation (PP) No. 7/2003.
CBP : Cadangan Beras Pemerintah (Government Rice Reserve) Gapoktan : Gabungan Kelompok Tani
(Farmers Association) GKP : Gabah Kering Panen
(dried paddy grain at harvest) HPP : Government purchase price PNS : Domestic Civil Servant RASKIN : Rice for the poor program Satgas : Procurement unit under BULOG UPGB : Unit Pengolahan Gabah dan Beras
1
INTRODUCTION
Background
Price variability in agricultural commodities is useful for both producers and consumers because it gives rooms to maneuver for both market actors: producers have the opportunities to reap higher profits by supplying more when prices are high and withhold supply when prices are low; meanwhile consumers can also be better off by taking the opposite position. The wisdom to buy cheap and sell dear are well-known among traders for centuries. Excess supplies are then to be stored for later use or held temporary until price rise to a desirable level in the future. Indeed storage arbitrage could smoothen price series, but this mechanism also generates additional positive first order autocorrelations to the series itself. This condition makes future prices even more unpredictable, thus more difficult to handle. In times of high price volatility, public and policy makers tends to discredit traders and speculators for inducing larger spikes. The truth is, the logic that drives these actions are also the one that account for storage mechanism, only the latter is aimed to improve welfare for both producers and consumers.
The call to set the price right, especially on important staple food such as rice, is compelling as food insecurity still an ongoing issue to most part of Indonesian regions. Despites significant progress in reducing overall poverty and the number of people living bellow national poverty line, which reach over 43 percent of total populations, are still living with less than 2 USD per day. Meanwhile food expenditures account for more than half of total per capita household expenses. Within the poor household income group, almost 20 per cent of this expenditure is spent on rice (Saifullah and Dawe, 2010). Sudden jump in rice price would then translate into putting millions of vulnerable households who live in the brink of poverty not being able meeting their daily nutritional needs.
Price gives signal to both consumers and producers either to increase supply and/or decrease demand. As for rice, this signal carries information about quality, such as variety, place of origin, degree of processing, etc. Every day, price signals carry forward, via series of bargains and negotiations between buyers and sellers, throughout the distribution channels: from farmers to grocers; until they reach end customers. Government can intervene this process by setting a price reference or Government Purchasing Price (GPP) in order to protect farmers from loss when market price falls. On the other hand, this policy also affects farmers’ expectation that they should sell their paddy at higher price, which in return would trigger traders to sell dry unhusked paddy and also rice at even a higher price. In the end, overall market price for rice increases.
hold mandate to control domestic stocks, to increase its importance in stabilizing price effectively.
Since many farmers sell their harvest in the form of wet unhusked paddy, thus they could not enjoy the benefit whenever there is an increase in the price of dry unhusked paddy, dry milled paddy, and rice. To farmers, a higher reference price for dry unhusked paddy could be a boomerang for them because they are also rice consumers. The wider the gap between paddy and rice, the smaller the profit farmers would receive. This inefficiency may have caused due to lack of technology owned by farmers, especially for drying paddy which still mainly relies on the hot weather.
A stable price for rice can solve part of this problem by giving assurance to business actors along rice supply chain to keep on investing to rice farming. As part of price stabilization policy, government also maintain a certain level of rice stocks in order to absorb excess supply of rice in the market and then distribute them when supply is low. A combination of reference price at farm level and stock management is expected to be able to stabilize rice price in the long run. The goal to stabilize price can only happen when the policies are correctly implemented, especially in relation to timing and bureaucracy. For example, there are cases where rice price at market is high, but at the same time rice stock level is high in storage. This is due to BULOG could not dispatch its stock fast because it needs recommendations from regional state government and the Ministry of Trade in order to conduct market operation (Lensaindonesia, 2015).
with the existence of storage arbitrage. This thesis attempts to untangle some elements of rice price volatility conundrum and provide reliable measurement as reference to formulate the best price strategy that can favor both rice farmers and consumers.
This thesis will begin by reviewing recent development commodity price dynamics. Typical agricultural commodity prices are often characterized by an autocorrelation series with seasonal and cyclical components. Decomposition of these series became more challenging due to the biological nature of agricultural productions that caused systematic behavior of price movements. The next chapter will discuss about sources of price shocks. In the long run, price series tend to be mean reverting. Price series may jump to a new level and stay in that level for a relatively longer period, creating spikes (Peterson and Tomek, 2005). This movement seems to follow a typical pattern, such that price increases in accelerating pace in one year followed by a sharp drop in the following year (Bobenrieth et. al., 2012; Brümmer et. al., 2013; Gouel, 2011; Huchet-bourdon, 2011). The last two chapters will discuss about some alternatives of mitigation strategies and the logic behind storage arbitrage.
Domestic rice price volatility in Indonesia between 2006 and 2013 provides good insight about volatility structures and drivers behind it. This sample allows us to observe how rice price volatility changes during “commodity boom” in 2007/2008 where prices of some agricultural products jump more than double only within a few months, and then swiftly decline to lower level. This particular event challenged the effectiveness of existing price stabilizing, such as buffer stock mechanism as well as other agricultural price control policies.
The methodology follows GARCH (Bollerslev, 1986) technique to model volatility. We apply external regressors in the model to gauge the impact of some possible drivers to volatility measurement. This allows conclusions to be drawn about whether one or more drivers, for example stock forecasts published by public institution or other policy, may have a big impact to influence the magnitude of price fluctuations. By the end to understand the volatility trend of rice price in Indonesia, explore some possible drivers and test the significance impact those drivers to overall volatility measurement.
Problem Statement
strategic value such as rice in Indonesia, unpredictable shocks in price is highly undesirable.
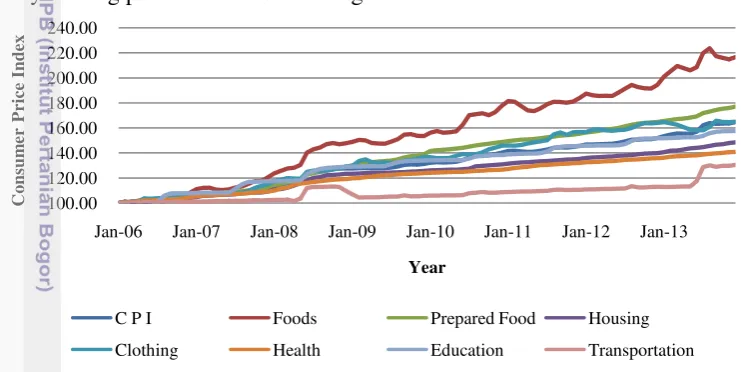
Food price index is the highest growing index compare to other sectors. Figure 1 shows the development of Consumer Price Index in Indonesia from 2006 – 2013. In 2013 food price index grew 11.4 percent higher than previous year; meanwhile the growth of total consumer price index is at 8.4 percent. Increasing food price index can be traced back to New Order Era (1969-1998), when protectionism policy started losing its ground to market liberalization. At the same time, raising nationalism gives more favor to domestic farmers at the cost paid by domestic consumers. As a result, domestic rice price sets to deviate from international and stays persistently at higher level (Figure 2).
In case of rice in Indonesia, this broad price movement within a short period is highly undesirable since it is a staple food and it is also a source of income for the majority of people, especially those living in the rural areas. Due to its strategic significance, rice price stabilization plays a key role in the long term policy making process of Indonesian agriculture.
Figure 1 Consumer Price Index in Indonesia 2006 - 2013
Source: Ministry of Finance, Government of Republic Indonesia (2014)
Figure 2 Domestic rice price Indonesia compare to international price 2005 - 2013 (in USD per Tonnes)
Source: World Bank Commodity Price Data and Indonesian Ministry of Trade (2014)
100.00
Jan-06 Jan-07 Jan-08 Jan-09 Jan-10 Jan-11 Jan-12 Jan-13
Co
Indonesian domestic price is set to be higher than international price in order to support domestic farmer. Interestingly, during 2007/2008 commodity boom, Indonesian domestic rice price did not experience significant shocks. In fact, it managed to keep price at stable level and even lower compare to international price. Generally it is accepted that the high price spike in 2007/2008 was a result of accumulation of restrictive trade policy actions by main exporting countries (Timmer, 2010). If there were no such actions and countries were opening their market, rice price might still increase but not as high as the level reached in 2007/2008 (Gouel, 2013).
Figure 2 shows a comparison of Indonesian rice price to Thailand rice price as international benchmark. Indonesia plays an important part in the world market for rice mainly due to its substantial rice imports for the past half century, except for several years in the mid-1980s when self-sufficiency was temporarily achieved. Rice import had been exceptionally important from 1975 to 1996 when BULOG was actively committed in stabilizing domestic rice prices by keeping domestic rice prices on the long-run trend of world prices. A study by Timmer (2003) concludes that there were two reasons for this policy. First, the world price represents the opportunity cost of rice to the Indonesian economy and economic efficiency requires that domestic and world prices track each other over extended periods of time. Second, Indonesia comprise of many small islands and located close to several major rice exporting ports, thus it is nearly impossible for Indonesia’s domestic rice price to be kept substantially above or below prices in those ports for extended periods of time.
The most common way to analyze price movement is by measuring standard deviation, which is how far away price deviate from the mean and coefficient of variation, that is how standard deviation divided by mean. These measurements are very useful to compare variation across time. Table 1 shows the comparison of standard deviations and coefficient of variations between Indonesia and Thailand. The choice of period is very critical in measuring both standard deviation and coefficient of variations. In this study it is useful to apply cut-off period before and after 2009. Before 2009, Indonesian food policies were giving much attention on rice production. After commodity boom in 2007-2008, policies that promote food consumption diversity and local produce were enacted thru Presidential Decree No. 22/2009 (Suryana, 2007) which then become the main program for national food security program in 2010-2014 (Food Security Agency of Indonesia, 2011). This period happen to be aligned with reelection of Indonesian President in 2009 who supported to reduce the impact of food crisis in his campaign.
Table 1 Comparison of standard deviation and coefficient of variations
Type of rice Period 2006-08 Period 2009-13
SD CV SD CV
Rice, Indonesia medium 50,83 0,10 119,78 0,16
Rice, Thai A.1 184,33 0,43 48,92 0,09
Rice, Thai 5% 145,19 0,45 80,73 0,19
Source: Rice, Indonesia medium: Ministry of Trade Government of Indonesia (2014); Rice, Thai A.1 Rice, Thai 5%: Thompson Reuters Datastream (2014), calculated
From food security point of view, it is important to understand how much price variation that is still safe for the vulnerable to afford sufficient foods and nutrients. Indonesia has more than 32 million populations who were still living on less than US$2 per day. In this setting, even a small price hike in food price may have big impact to households especially when their budget for food constitutes up to 48 percent of their total budget spending (Central Bureau of Statistics of Indonesia, 2013). Raising food price issues seems to be inevitable throughout the years, especially a month before and after Ramadhan1. In the past 3 years, prices were higher not only in level but also in volatility despites increasing efforts from the government to improve distribution, speed up import process for importers who already hold authorization to proceed, and also allocate additional import volume2. To handle this issue, Indonesian government reserves a certain amount of rice as public reserve. Some of the goals are to support Rice for the Poor Program (Raskin) and anticipate rice price volatility.
From market perspective, maintaining storage to store excess supply has been known to have effect in stabilizing price (Cafiero et. al., 2011; Serra and Gil, 2012; Wright, 2011). The stock also plays important role in price stabilization policy in Indonesia. The level of stock is a good reference to decide what kind of policy needed, when it should be implemented, and how intense it is going to be implemented at national as well as regional level, especially when it is related to import. However, this ideal condition is hard to achieved due to accurate data on stock level is rarely available (Resnia et. al., 2012). Thus the ideal stock buffering mechanism is very difficult to be achieved in the case of Indonesia. Considering government policies related to food price, other factors seem to play role in stabilizing rice price volatility in Indonesia.
Research Objectives
Formally, the research objectives are formulated as follow:
1. To analyze rice price volatility in Indonesia between 2006 to 2013. 2. To identify factors which affect rice price volatility in Indonesia.
1 Ramadhan is one of the most celebrated a Muslim holiday in Indonesia that marks the end of fasting month 2 As stated by the Head of Indonesian Food Security Council (BadanKetahananPangan), Prof. Dr. Ir.
3. To find suitable alternative forecasting model in order to examine rice price volatility phenomenon in Indonesia.
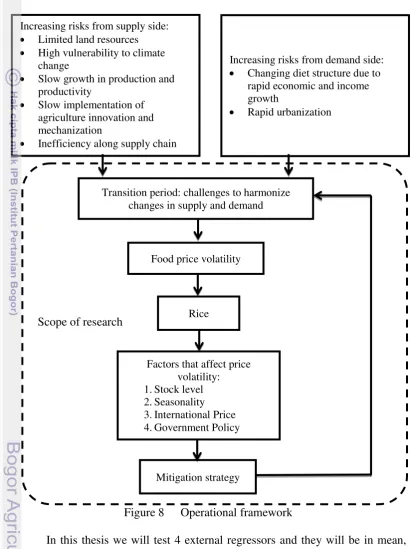
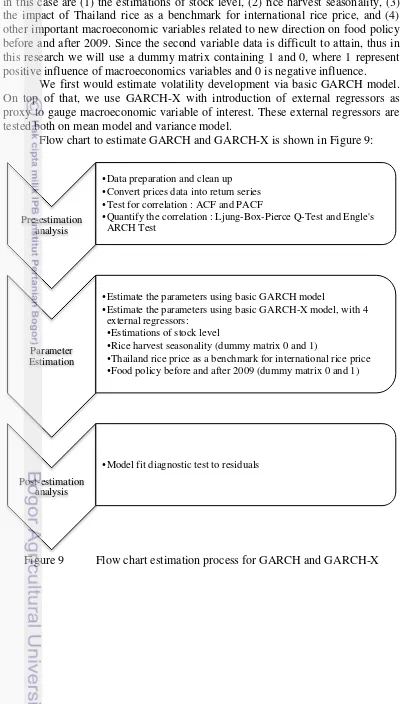
The fundamental thesis of this study is derived from macroeconomic approach to deal with price volatility, which are either by directly stabilize the market price using price controls mechanism, stock mechanism, or a combination of both. The methodology follows GARCH (Bollerslev, 1986) and GARCH-X (Apergis and Rezitis, 2010) model to measure volatility. This thesis applied 4 external regressors in the model to gauge the importance of these variables to rice price volatility development, which are: (1) the estimations of stock level, (2) rice harvest seasonality, (3) the impact of Thailand rice as a benchmark for international rice price, and (4) other important macroeconomic variables related to new direction on food policy. This allows conclusions to be drawn about whether certain macroeconomic variables have influential predictive capacity to the conditional variance of rice prices.
Benefit of the Study
There are 4 main problems of food in Indonesia, as presented at the Jakarta Food Summit 2014, which encompass some limitations in the area of production and processing, distributions and stocks, trade and marketing, volatile food price faced by end consumers. Although the summit were held recently, but the problem discussed has been around for decades. Interestingly, these are also the same problems faced by many developing countries, yet not many are able to solve it thoroughly. Indonesia is among one of a few countries who successfully manage steady economic growth during the past downturn, but food price index are still the biggest contributors to the country national inflations.
This study will help us to understand the development of rice price in Indonesia from the point of view of stochastic analysis, such as trends, variability around the trends, and extreme movements. These analyses are aimed to help policy makers to make better judgment about what are the real sources of rice price volatility and the best way mitigate it. Developing countries often suffer from ineffective and long supply chain that resulted in the lack the ability to take fast action in the event of sudden jump in prices. Several main actions such as removing obstacles in each chain of rice supply chain by improving transportation means and infrastructure, simplify administration process, and reliable monitoring mechanisms; are need to be done which signify the need of reliable measurement of price trend and volatility development.
standardized method, this research also contributes to clear up some confusions and debates around rice price movements in Indonesia.
Scope and Limitation of the Study
This research uses average national rice price data from the Ministry of Trade Republic of Indonesia from 2006 to 2013. The analysis in this thesis is limited to national level and cannot captured movements in the provincial level or lower. When at some periods there are price jump in some provinces and price sunk in other province, it is possible that the average price data do not expressed such movements.
The choices of certain macroeconomic variables are based on those which have significant predictive capacity on the volatility of rice prices, in this case (1) the estimations of stock level, (2) rice harvest seasonality, (3) the impact of Thailand rice as a benchmark for international rice price, and (4) other important macroeconomic variables related to new direction on food policy. Estimation of stock level is measured using USDA WASDE data, which are not the real stock level available. It is nearly impossible to get such data, however such approximations are sufficient enough to use as forecast or trading plan. Rice harvest seasonality is expressed as dummy variable 0 and 1 following the rice growing and harvest period published by Indonesian Center for Food and Crops Research and Development. This is also an approximation and can be improved with real time climatic data or harvest period. Thailand rice data are taken from Thompson Reuters Datastream for the same period. Thailand is a major rice played in the world, however the world rice market may get impacted by other countries other than Thailand, which do not covered in this thesis. Other macroeconomic variable is expressed as dummy 0 and 1 to represent food policy applied in the period before and after 2009.
2
LITERATURE REVIEW
Commodity Price Dynamics
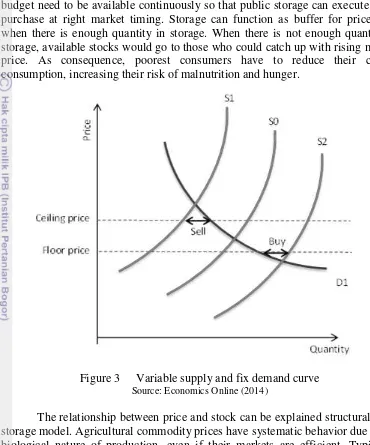
Prices contain information on supply and demand forces that works in a market. In the case of storable agricultural goods, such as grains, demand for storage is also considered while calculating total demand. In theory, insertion of storage into supply and demand model could help stabilized price innovation. The model thus, assumed demand as relatively fix, meanwhile supply tend to varied depending on how successful harvest during the year. Figure 3 shows a general illustration of this model.
case of good harvest where rice available in abundant quantity (S2). Through this mechanism, storage is expected to stabilize price, however in real world situation things may develop in a more complex ways. For example, sufficient amount of budget need to be available continuously so that public storage can execute stock purchase at right market timing. Storage can function as buffer for price only when there is enough quantity in storage. When there is not enough quantity in storage, available stocks would go to those who could catch up with rising market price. As consequence, poorest consumers have to reduce their calorie consumption, increasing their risk of malnutrition and hunger.
Figure 3 Variable supply and fix demand curve
Source: Economics Online (2014)
The relationship between price and stock can be explained structurally via storage model. Agricultural commodity prices have systematic behavior due to the biological nature of production, even if their markets are efficient. Typically, agricultural price series are auto-correlated with seasonal and perhaps cyclical components. Due to seasonality and cycles, these prices may be mean reverting to some long-run average. Occasionally, prices jump abruptly and temporarily to a high level relative to their long-run average, creating spikes.
Based on the above theory, this thesis considers storage as one of variable that have impact on rice price development. Moreover, the impact of rice harvest seasonality, Thailand rice as a benchmark for international rice price, and other important macroeconomic variables related to new direction on food policy will also use to measure overall price volatility.
consumption as the difference between available supply and the stocks carried out, and non-negative stocks. Storage arbitrage works by following either two of these conditions: (1) when the total price and marginal cost of storage per period is higher than expected future price, then storer would increase its carry-over stocks; (2) when the total price and marginal cost of storage per period is equal or lower than expected future price, then storer would not increase its carry-over stocks.
Empirical proof of this model is difficult due to absence of satisfactory time series of aggregate production and stocks for major commodities; nevertheless the model is useful in estimating and testing of a model of price formation where supply and demand shocks are mediated through storage. Deaton and Laroque (1996) applied generalized method of moments (GMM) to identify and estimate a subset of the parameters of storage model in order to construct comprehensive comparison between the model and actual commodity price data. Moreover, their study also pursues the explanation about sources of high autocorrelation in commodity prices series. They found that if autocorrelation generated by supply shocks only then the resulting autocorrelation should not be as high as those observed in actual data. Even with the additional speculative behavior of storage, i.i.d. prices still could not be filtered into the high level of observed auto-correlated prices. Although it is unclear how commodity prices exhibit such high autocorrelation; the study reveals excellently the underlying mechanism behind profit-maximizing and risk-neutral speculator’s acting on i.i.d. driven process and how this process in the end modify the original dependency of price series to supply and demand.
Stock arbitration can only work when there is difference in current price and expected price in the future. In other word, low price do not guarantee traders to increase stock, or vice versa. Future price need to be higher than the total of current price and the marginal cost of storage per period. The decision to buy or sell is crucial for public storage since purchasing budget is generally limited. The fact that commodity prices are highly auto-correlated exacerbates the matter as stocks must be held at sufficient amount as well as making profit (or at least not making loss) when hold them.
From budget perspective, storage may not be the best solution to stabilize prices. Nevertheless, storage can be used to reduce costs of varying production (when marginal cost is increasing), and to reduce marketing costs by facilitating production and delivery scheduling and avoiding stockouts. Equilibrium inventory behavior is the solution to a stochastic dynamic optimization problem. Pyndick (2002) studies the short-run dynamics of commodity prices and inventories, focusing on the behavior and role of volatility. He explained two principal ways of how volatility affects prices, production, and inventories: (1) it directly affects the marginal value of storage (the marginal convenience yield), i.e., the flow of benefits from an extra unit of inventory; and (2) for a depletable resource like oil, volatility affects the total marginal cost of production via the “option premium.” His paper also shows how inventories adjust and affect prices in the short run.
priority. The case of Skim Milk Powder (SMP) policy reforms in European Union (EU) present interesting empirical issues in quantifying increase of price volatility. SMP market in EU are more regulated compared to world market, thus they were less volatile as they are protected to the same degree from local and global shocks (O’Connor and Keane, 2011). The study showed that the EU SMP series is particularly well-modeled as an ARMA process as it displays normal errors which are free from autocorrelation and ARCH. EU SMP market experienced period of exceptional high levels of volatility in both world and European prices in the long-term historical context. Thus, it is also reasonable to assume that alternative specifications of these models other than basic GARCH(1,1) model such as TGARCH (Threshold GARCH), AGARCH (Asymmetric GARCH) may be more appropriate. These models are supposed to be able to better captured the effects of government intervention to price such as floor and ceiling price also government purchase to build up stocks which can point but it is not enough to explain hoarding behavior and its subsequent impacts on prices. Market structure plays important role in explaining rice price volatility development in the short run and long run.
For this reason, Timmer (2009) use supply storage model to incorporate the role of outside speculators. Furthermore he also quantified the impact of financial factors and actors on commodity price formation using very short-run prices and Granger causality analysis for a wide range of financial and commodity markets, including rice. For rice, wheat, and corns, the study found that their price formations are impacted by some exogenous variables such as weather shocks or legislated mandates for biofuel usage; and also endogenous variables, such as responses of producers and consumers to prices themselves, perhaps even policy responses of governments to prices. For rice, one of the most prominent variables to be included in the model is the insertion of export bans as a way to prevent domestic food price inflation.
The challenge for rice is that it has been so volatile. The coefficient of variation of world rice prices has often been doubles that of wheat or corn for decades at a time. Understanding this volatility has been difficult because much of it traces to the residual nature of the world rice market, as both importing and exporting countries stabilize rice prices internally by using the world rice market to dispose of surpluses or to meet deficits via imports. Thus supply and demand in the world market are a direct result of political decisions in a number of Asian countries. Rice is a very political commodity (Timmer and Falcon, 1975).
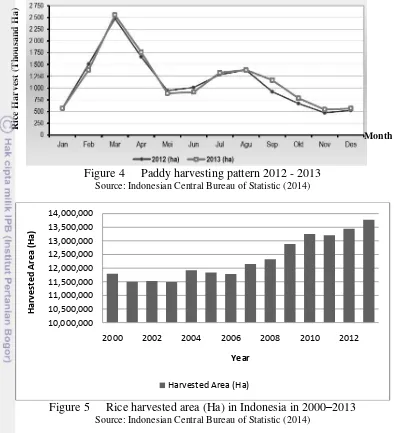
Table 2 shows a compilation of growing season by Indonesian Center for Food Crops Research and Development. On the average, rice can be harvested four months after it is cultivated. Harvest period usually last until one month, the same length as growing period. Maximum harvest which leads to rice stock peak usually happened in March-July. During this period, all activities related to rice processing (drying, milling, storage and distribution) took place. BULOG then will replenish its stock until reach its optimal quantity in August. This stock will be used later in November, December, and January when the rice harvesting is low (Sumarno, 2006).
Table 2 Rice sowing and harvest period in Indonesia
Jan Feb Mar Apr May Jun Jul Aug Sep Oct Nov Dec Wet
season Harvest Gadu season
Harvest Dry season
Harvest
Sowing period Harvest period
Source: Indonesian Center for Food and Crops Research and Development (2006)
Assuming that the level of consumption to be keep steadies, then one can expect period of high productions and low productions following rice seasonal pattern. In return, price movement will also follow this pattern. For example, in harvest period where rice production assumed to be higher than consumptions, rice price is expected to fall. Ideally BULOG will buy excess produce to stabilize price. Oh the other hand, from September to February where there are not much harvest schedule, price are expected to rise. In this period, BULOG ideally will sell some of its stocks to stabilize market price. This mechanism is done thru market operation at several food insecure critical points in Indonesia.
Figure 4 Paddy harvesting pattern 2012 - 2013
Source: Indonesian Central Bureau of Statistic (2014)
Figure 5 Rice harvested area (Ha) in Indonesia in 2000–2013
Source: Indonesian Central Bureau of Statistic (2014)
Although rice harvested area in Indonesia seems to grow consistently from year to year since 2000, as shown in Figure 5, it is its intra-year seasonality pattern which drives intra-year price variability. The price of coarse rice grain at farm gate level was declining significantly during wet season harvest, after that increasing until reaching its peak in during dry season (Sawit and Amang, 2001). Data from 2008 shows that in average coarse grain price at farm gate level was 10 percent higher in gadu season harvest and 16 percent higher in dry season harvest, compare to the price in wet season harvest period (Sawit, 2011).Rice quantity is correlated with its production in wet and dry season (Maulana and Rachman, 2011). The existence of variances in quantity productions characterizes rice price volatility throughout the season.
and traders have their own judgment on how to determine rice quality (Maulana and Rachman, 2011).Nevertheless, farmers tend to choose to sell paddy/rice to marketing channels other than BULOG if they can offer less strict requirements on quality, even though at the price lower than GPP (BAPPENAS, 2011).
Sources of Price Shocks
Rice continues to be the most important commodity in Indonesia, the gross value added of agricultural sector is about 14.4 percent total GDP. Rice is grown on around 30 percent of the country's land area and is a major source of livelihood of many small farmers and agricultural landless households. Rice also remains to be the main food staple, contributing 35 percent of the population's total calorie intake on average, and as much as 60-65 percent of the households in the lowest income quartile. Rice constitutes about 11percent of total household expenditure, and double that ratio among the poor households.
Until 2003 the policy instruments employed by the Indonesian government have very successfully isolated domestic rice prices from the greater volatility associated with world prices. Government intervention using floor and ceiling prices combines with other measures such as production quotas, import tariffs and input subsidies helped to ensure higher and much less volatile prices than those pertaining in world markets. The greater volatility observed in world rice prices may in part be explained by the fact that these global markets are considered thin (Sawit, 2011; Timmer, 2003). This condition makes relatively small changes to supply or demand often lead to relatively large price fluctuations. As this scenario is likely to continue as international rice market becomes more liberated, this poses a serious concern for rice producers’ households which accounts for more than 14 million households or approximately 80 percent of national households.
Theoretically there are two competing explanations about price dynamics in the agricultural sector. First, those prices are driven by real shocks, an explanation that fits perfectly with the rational expectations framework. Secondly, that price dynamics stem from forecasting errors, which is based on the coordination issue created by price instability. These two explanations lead to opposite policy conclusions. If real shocks affect supply, price adjustment is a natural correction process. Policy makers could want to mitigate their adverse effects on fragile populations, but they should not alter the overall dynamics. If price volatility is caused by a failure to forecast next period market conditions, future scarcity is not driving resource allocation and the state of the economy could be improved through public intervention. Of course, these two explanations are not mutually exclusive. The literature has, however, rarely mixed them. So, to clarify the properties of each theory, the opposition is maintained in the paper (Gouel, 2012).
warehoused. The price expectations of these market participants are critical to their decisions about how much to grow, to sell, to store and to consume. Because there are virtually no data available about either these price expectations or their marketing consequences, the world rice market operates with highly incomplete and imperfect information about short-run supply and demand factors. In this, rice is a very different commodity from the other basic food staples, wheat and maize.
Most rice farmers in Indonesia are marketing their products individually. One of the reasons is that there were no institution at the farm level yet that can properly functioned as marketing channel for farmers. There are some farmers’ groups, associations, and cooperatives; however these institutions are more focus in counseling aspects related to cultivation technique. As a result, marketing needs of farmers did not properly addressed. On the other hand, farmers often have limited skill in marketing management; thus made them more difficult to get access to product market and capital market (MSA-IPB, 2012).
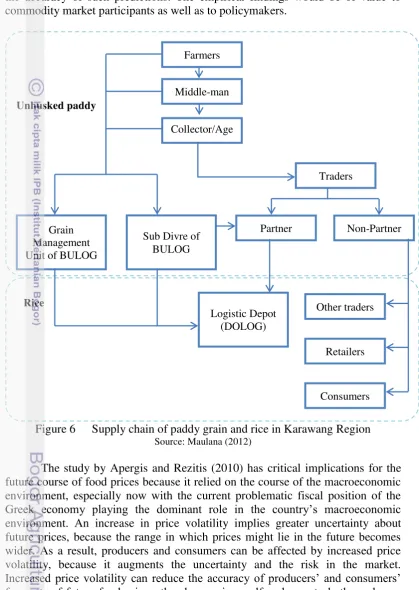
Figure 6 shows a simplification model of rice supply chain model in Indonesia. Different region may have different chain and some are even longer and more complicated. The rice long supply chain creates much inefficiency in the marketing system. Moreover, with market structure that comprised of higher number farmers and relatively less buyers, farmers’ bargaining power were badly suppressed. When BULOG was no longer had sole right to import rice, distributors who hold import right may switch to import whenever import parity price is more rewarding.
Differences in market structure for rice are substantial in short-run price formation. Example of rice supply chain above is also similar with the world’s rice economy, where many small producers, traders, retailers and consumers are handling the product and store it at each stage. Rice storage became highly decentralized. Since no one has accurate data on size of rice stocks in each chain, thus the impact of stock level on rice price formation is very difficult to predict ahead of time ( Timmer, 2010).
deviations from the long-run relationship between food prices and macro- economic variables may affect the conditional variance, then they will also affect the accuracy of such predictions. The empirical findings would be of value to commodity market participants as well as to policymakers.
Figure 6 Supply chain of paddy grain and rice in Karawang Region
Source: Maulana (2012)
The study by Apergis and Rezitis (2010) has critical implications for the future course of food prices because it relied on the course of the macroeconomic environment, especially now with the current problematic fiscal position of the Greek economy playing the dominant role in the country’s macroeconomic environment. An increase in price volatility implies greater uncertainty about future prices, because the range in which prices might lie in the future becomes wider. As a result, producers and consumers can be affected by increased price volatility, because it augments the uncertainty and the risk in the market. Increased price volatility can reduce the accuracy of producers’ and consumers’ forecasts of future food prices, thereby causing welfare losses to both producers and consumers of food commodities. It is also crucial for policymakers to be aware of the degree of price volatility so as to be able to adopt appropriate
Logistic Depot (DOLOG) Farmers
Middle-man
Collector/Age nt
Traders
Grain Management Unit of BULOG
Sub Divre of BULOG
Non-Partner Partner
Other traders
Consumers Retailers Unhusked paddy
hedging strategies. Thus, from a policy standpoint, the results are important, because once the participants receive a signal that the food market is too volatile, it might lead them to call for increased government intervention in the allocation of investment resources and this could not be a welfare improvement factor. However, the global economic crisis may complicate the resolution of many of these macroeconomic factors such as public deficits and public debts. Thus, tighter credit and fiscal positions will make it more difficult to finance the massive investments needed in the agricultural sector to enhance food security, especial for low-income households. In addition to these recommendations, additional certain actions must be also implemented as to alleviate the impact of the macroeconomic environment on food price uncertainty such as encouragement of financial institutions to expand operations rapidly to improve access of farmers to credit and the encouragement by the Greek authorities of significant increases in investments in adaptive research and technology dissemination (though the current situation in the Greek economy makes the feasibility of such efforts extremely doubtful).
Commodity price fluctuations that are affected by exogenous factors also studied in daily sugar prices. Jati (2010) found that the fluctuation of the sugar prices is effected by factors outside the sugar prices, like sugar policy, seasons, technology and other things. On the other hand, some researchers also believed that today’s sugar prices are affected by sugar prices in the past. This type of analysis is called time series analysis. Sugar prices in producing countries (Brazil, India and Indonesia) have the biggest percentage to explain the variability of their own sugar price (above 96 percent). Based on this assumption, he focused his research on time series regression. First, he fits the price series into an ARMA model. From the ARMA analysis result, it shows that the clustering volatility suggests there is ARCH effect. The next step of this study used heteroskedasticity test to make sure that there is ARCH effect in ARMA model.
The result shows that Return of Indian Sugar Prices (RISP) and Return of Indonesian Sugar Prices (INSP) probability value are less than 5%. So, the null hypothesis can be rejected because there is an ARCH effect in the ARMA model. This is an indication that the ARCH/GARCH analysis is better than ARMA analysis for Return of Indian Sugar Prices (RISP) and Return of Indonesian Sugar Prices (RINSP). Then for Return of Brazilian Sugar Prices (RBSP) probability value are more than 5%. So, the null hypothesis cannot be rejected because there is no ARCH effect in the ARMA model. This means that the price series could use the ARMA model. The next step of the research is to make a simulation some ARCH-GARCH model. After that, this research can estimate the parameter of the model using Quasi Maximum Likelihood (QML). This test is using the best ARCH-GARCH model from the lowest value of Akaike Info Criterion (AIC) or Schwarz Criterion (SC) (Jati, 2010).
biggest sugar-producing countries in the world. The ARCH/GARCH test shows that GARCH(1,1) is the best model the analyze the volatility of RISP and RINSP. Moreover the RISP forecast of variance is more fluctuated compare to RINSP, but the RINSP has a higher potential risk compare to RISP.
The case of sugar market is a good example where volatility study can be used to explain the impact of policy change to price volatility. Pop et. al. (2010) assessed the shocks and transformations Romanian market in general and the sugar sector in particular. The current volatility of Romanian sugar market has its origins in the transformations that had a major effect on the efficiency of the sector and its international competitiveness. Despite Romania’s significant agricultural potential, the low productivity levels and inadequate funding are obstructing the achievement of an adequate level of performance that is necessary to cope with the increasingly competitive pressures. The increased imports and the need of alignment with the European Union requirements are the main reasons why the world and European market evolutions in the sector are directly felt on the Romanian market. Consequently, Romania’s current volatility context is a mixture between imported volatility, internal instability and lack of maturity of its market structures. As price volatility represents a very complex phenomenon that can be moderated only up to some extent by adjusting market structures and specifying regulatory and fiscal policies, and considering that for the sugar market these policies are not in Romania’s hand anymore as they depend on the EU and CAP regulations, Romania should concentrate on strengthening its internal potential of production in order to reduce the level of imported volatility, to reach at least the quotas established, while also dealing with the problem through price risk management strategies and consolidating internal futures markets.
Price volatility can also be impacted by dynamics in related market. Hwang and Satchell (2011) studied the use of cross-sectional market volatility. The cross-sectional market volatility is a measure of disperse of individual asset returns with respect to the market return for a given time. There is an analytical relationship between cross-sectional market volatility and time-series market volatility that can be proved by using linear factor models. In the study, he compared the properties of the cross-sectional market volatility with those of time-series market volatility such as squared market returns and conditional market volatility in the UK and US markets. The empirical results showed that cross-sectional market volatility is not only highly correlated with time-series market volatility but also more informative than squared market returns, suggesting that cross-sectional market volatility can be useful for the explanation and forecasting of time-series market volatility. The cross-sectional market volatility can be considered common volatility in market.
Mitigation Strategy
Some common mitigation strategy to price volatility is thru trade and storage policy. For small open economy, the challenge is to know which of the possible combinations of both policies that can give the optimal mitigation effect. Gouel and Jean (2013) attempt to design optimal dynamic food price stabilization policies in an open economy setting. According to them, the model can only be solved numerically, and tractability requires simple specification. Their analysis focuses on the optimal use of trade and storage policies on the food market of a small developing economy, where public intervention is justified by the lack of insurance against price volatility for risk-averse consumers. For the sake of tractability, their model overlooks supply reaction and producers’ risk aversion.
The results show that, for the case of a normally self-sufficient country, an optimal trade policy in the presence of risk aversion includes subsidizing imports and taxing exports in periods of high domestic prices. This policy truncates the upper half of the distribution and is not fiscally costly since the proceeds from export taxation cover the fiscal cost of import subsidies. Import subsidies alleviate the traditional limit of food storage: its non-negativity. When stocks are zero, subsidizing imports prevents price spikes (Gouel and Jean, 2013).
One of the important finding in the above study is that when stabilization is pursued through storage subsidies only, it does not improve consumers’ welfare. Additional storage increases low prices through additional demand for stockpiling, but it is not effective at preventing price spikes. In a small open economy, price spikes occur often when the world price is high, in which case any additional stock is sold on the world market. While domestic prices are stabilized to some extent, the potential benefits for consumers are wiped out by the increase in the mean price. Such a policy improves the country’s trade balance by giving it more resources to export when the world price is relatively high, but it does not benefit consumers. Since storage policies are generally seen as a way to help consumers, these results sound a warning that storage policies designed without any flanking trade policy might be inconsistent: the limited insulation provided by trade costs-especially when they are relatively small-does not allow any independent food price policy to be pursued. In contrast, a well-designed combination of trade and storage taxes and subsidies can be a cost-efficient price-stabilizing policy.
Moreover, Gouel and Jean (2013) explained that these policies have an important common limitation. They produce distributive welfare effects that are much larger than total gains. Reducing consumers’ risk bearing by manipulating prices in an open economy may thus face strong opposition. This result emphasizes the drawbacks of stabilization policies compared to policies targeting specifically poor households. They found that an optimal combination of trade and storage policies trims both the lower and upper parts of the domestic prices distribution. The optimal policy identified here should thus remain welfare-increasing even when producers are risk averse, since they should value the trimming of low prices. The same goes for the issue of supply elasticity: since expected prices are not strongly modified, supply reaction should remain limited.
better understanding of why export restrictions are such a frequent occurrence. It might also help to gauge the stakes of potential multilateral disciplines. For the poorest countries, in particular, banning export restrictions altogether may be politically difficult, at least if no substantial compensating measures are offered. The collective action problem created by export restrictions certainly deserves closer scrutiny. In any case these constraints, disturbing as they are, are better acknowledged than ignored (Gouel and Jean, 2013).
Price stabilization policy was important to Indonesian agricultural development especially related to widespread adoption of the new high-yielding rice varieties and adoption of new technology. In result, Indonesia managed to increased rice production at a sustained rate of 4 percent a year for three decades since the 1960s. Growth in agriculture sector stimulated growth to other non-farm rural economy which in the end helped the country to spur economic growth and reduce poverty (Cummings et. al., 2006).
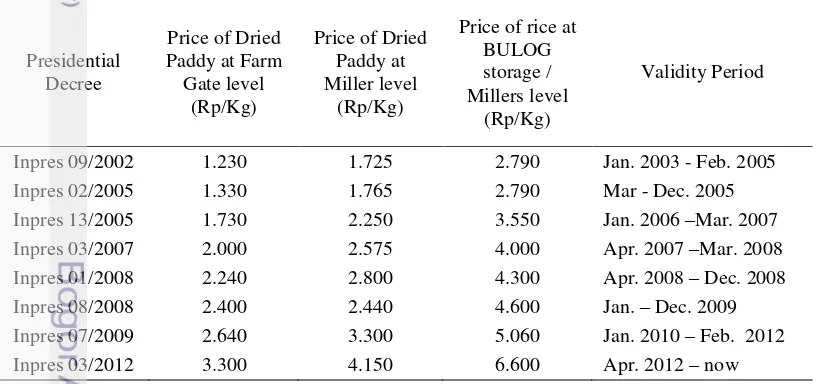
In order to stabilize rice price, government set a price reference for minimum buying price for dry unhusked and milled paddy, which called Government Purchasing Price (GPP). The main objectives in determining GPP are to: increase the farmer´s income, develop rural economy, stabilize national economy, gain food sovereignty, provide provisions for food stocks, encourage farm productivity and boost national rice production. GPP may be adjusted according to changes in the price of gasoline, consumer price of rice in domestic markets (especially if it is higher than GPP), increase in ceiling price, fertilizer subsidy, and so on (BKP, 2013). Changes GPP from time to time is presented in Table 3.
Table 3 Government purchasing price 2002–2012
Presidential
transportation facilities, and (2) since the end of 2007 until the whole 2008, there has been many floods hampered paddy production (Tamburian, 2009).
GPP of dried paddy grain at harvest (GKP) is quite effective in maintaining price stability at farm level. However, this does not guarantee that price would automatically stabilize throughout GPP validity periods. Price variation can still occurs due to (1) intrinsic risks in rice production system, (2) low bargaining power of farmer (In many case farmers urgently need cash for next production period, thus they prefer to sell directly after harvest rather than wait for a better price. Moreover, rice supply is inelastic and rice market is locally segmented), and (3) combination of fluctuated production and inelastic supply curve (Maulana and Rachman, 2011). In the end, these price risks are adding up to production risk that already faced by farmers.
Storage Arbitrage
Storage and price expectations also become important for storable commodities in the short run the length of time the commodity can be stored -about a year for rice. A model of the “supply of storage,” a staple of commodity market analysis for more than half a century, is used to understand the factors affecting price expectations, and price formation, in the short run. This model is very powerful in its ability to explain hoarding behavior and subsequent impact on prices. Meanwhile the supply of storage model is less successful in explaining the impact on spot market prices of futures market prices that are driven by “outside” speculators, i.e. those who have no interests in owning the actual commodity but are investing solely on the basis of expected price changes on futures markets. The role of outside speculators in commodity price formation is an old debate; although one that has usually not included rice because of the thinness of rice futures markets. The potential of outside speculators to induce destabilizing price formation is a major element of this debate (Timmer, 2009).
The evolution of price policy in Indonesia goes along regime changes of the ruling government. Each policy is a reflection of problems and challenges faced during the regime. Highlights on history of Indonesian food policy from 1969 up to now can be seen in Appendix 1. Key success of Indonesian price stabilizations lies in the perfect combinations between price policy and stock management (Sawit and Amang, 2001). BULOG was then established in 1967, with the objective to develop a marketing system over which government had control, as a strategic response to preventing hunger and peoples’ unrest (Arifin, 2003). Later on, the development of Indonesian agriculture cannot be separated from the advancement and containment role of this institution.
these privileges were abolished in 20033 along with major changes of function in the institution.
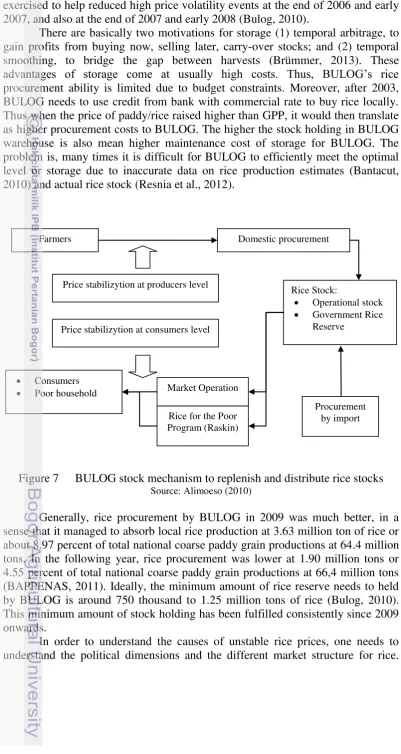
Since then, BULOG reduce its market operations and reserve, thus more focus in providing for food security program, for example: Rice for the Poors (Raskin) and Government Rice Reserve (CBP). In order to support procurement, BULOG is required to maintain national rice reserve at 1 – 1.2 million tons with 350,000 ton of it is directly managed thru local procurement as well as import. This level may not be significant compare to the national yearly rice production, but it has significant social-psychology effect to fosters public confidence towards food security (Bantacut, 2010). Although procurement through local farmers is being prioritized, the price of rice import has became a dominant factor that influence domestic rice price (Sunarto, 2007).
Definition, measurement, and drivers of price volatility
Definition
There are two important concepts to understand about volatility: variability and uncertainty. All progressions away from the mean are refer as variations, while things that we do not know about this progressions are refer as uncertainty. These two concepts are also known as predictable component and an unpredictable component which need to be decomposed when dealing with price series. How to weight these two components is depends on the issue examined (Aizenman and Pinto, 2005; Piot-Lepetit and M’Barek, 2011; Prakash, 2011).
Measurement
The simplest measurement of volatility is using standard deviation of log changes in price series. Measurement using this technique is also known as realized volatility. This calculation is based on the history of an economic variable. If risk is assumed as total variability then, realized method may overestimate risk when components or trends in the underlying variable are predictable. Excluding the predictability elements from standard deviation will give result on standard deviation of pure risk (Aizenman and Pinto, 2005). Predictability elements can be obtain by decompose the series into trend and cycle, thus leaves irregular component with certain level of variance (Piot-Lepetit and M’Barek, 2011).
Choices of measurement can affect the volatility result. Here with are the compilations based on previous researches (Aizenman and Pinto, 2005; Brümmer et al., 2013; Piot-Lepetit and M’Barek, 2011; Prakash, 2011):
1. Sample length. The longer the sample length the better the measurement accuracy will become. However this can only be applicable when the underlying volatility has been stable over the sample period. If a price series is prone to exogenous and endogenous shocks, thus the effects of these shocks need to be taken in account in the calculation.