Iswandaru Widyatmoko
Sri Sunarjono
Dwi Purwanto
Sri Widodo
Suyuti, Kustiyah Rahayu W.
Dian Noorvy Khaerudin
Suwardi
-Jurnal eco REKAYASA, Vol. 4, No. 2, September 2008 ISSN : 1907 - 4026
i
Iswandaru Widyatmoko
...
Sri Sunarjono ………...
Dwi Purwanto...
Sri Widodo………....
Suyuti, Kustiyah Rahayu W.………..
Dian Noorvy Khaerudin...
Suwardi
...
!"
! #$
# #
#! %&
%" %#
%% '!
UNIVERSITAS MUHAMMADIYAH SIJRAKARTA
EAKUI,TAS TEKNIK
Jl. A. Yani Pabelan Karlasura Tromol Pos 1 Surakarta 57102 Telp. (0271)717417 Ext. 212,213,225,253 Fax. (0271)715449
-
E-maii i teknk@tinis. ai. id. Wgbsite : http://wrrr4lv. ums.ac.id
SURAT
PENGALIHAN
PUBLIKASI
Nomor
: L24/A.2-VII\/FT
/Lil/201-s
Yang bertanda tangan dibawah ini : Nama
Jabatan
: Ir Sri Sunarjono,
M.T,ph.D
: Dekan
Fakultas
Teknik
Menyatakan
menyetujui
pengalihan
hak unggah publikasi kepada Lembaga
Pengembangan
Publikasi
Ilmiah Universitas
Muhammadiyah
Surakarta
atas
artikel berjudul "The Mechanism
of Binder Distribution
in Foamed
Asphalt
Mixture" yang di tulis oleh Sri Sunarjono
NIDN :
06301,263
, DosenProgram Studi Teknik sipil Fakultas Teknik universitas Muhammadivah
s u r a k a r t a
p a d a
e c o R e k a y a s a
N o . 0 z V o r 4 l s S N : 1,907
* 4026 edisi September
The Mixture of Binder Distribution in Foamed Asphalt Mixture ……….(Sri Sunaryono)
65
THE MECHANISM OF BINDER DISTRIBUTION IN FOAMED ASPHALT
MIXTURE
Sri Sunarjono
Jurusan Teknik Sipil Universitas Muhammadiyah Surakarta
Jl. A. Yani Tromol Pos I – Pabelan Kartasura Telp.0271-717417 Ext.415 Surakarta 57102 E-mail: [email protected]
ABSTRAK
The key issue in understanding foamed asphalt properties is that of binder distribution which a result of mixing process is. It is therefore the mixing process is the most important factor in foamed asphalt production (in combination with good foam properties). Following the mixing process the foam distributes onto fine aggregates forming larger particles of various sizes, for which the most binder rich is found to be at 2.36mm size for this sample (FWC of 4%). These binder rich ‘particles’ mainly consist of fine aggregates (largely filler) and the maximum coated aggregate size is 6.3mm. The mechanism of binder distribution, which has to be well understood in order to know the characteristics of foamed asphalt mixture, has been fully described. It is found that the binder formation is that of a combination of bitumen and fine aggregate, forming particles that distribute across the aggregate phase. The properties of these binder-fines particles become crucial during mixing process. The workability of binder-fines particles influences the uniformity of the binder distribution. A uniform mixture in terms of binder distribution will potentially achieve high performance.
Kata-kata kunci: Foamed asphalt, binder distribution, mixing.
INTRODUCTION
The use of foamed asphalt mixture (FAM) for road construction has increased rapidly worldwide including the Asia region. This mixture is produced through an effective and economical process and, as a cold mix system, can use a wide range of aggregate types from conventional high quality graded materials, reclaimed asphalt to marginal materials including soil.
Foamed asphalt can be generated by mixing of sprayed foamed bitumen and wet aggregate. Foamed bitumen can be produced by injecting a small amount of air and water into hot bitumen. During the foaming process, the bitumen volume increases rapidly causing the bitumen forms thin film and enables aggregate coating at ambient temperature. The role of binder distribution is an important key to understanding foamed asphalt properties. An evaluation of binder distribution for bituminous foam mixture is very demanding due to foam not being continuously distributed on the aggregate. This paper reports the results of investigation into the binder distribution mechanism of foamed asphalt mixture.
FOAMED BITUMEN
Foamed bitumen can be produced by injecting pressurised air and a small quantity of cold water into a hot bitumen phase in an expansion chamber. Soon after spraying into a special container, the bitumen
foam expands rapidly to its maximum volume followed by a rapid collapse process and a slow, asymptotic return to its original bitumen volume. For example, 500g of hot bitumen injected using 10g of cold water (2% of bitumen mass) normally results in foam with a maximum volume around 15-20 times that of the bitumen. The ratio between maximum foam volume achieved and the volume of original bitumen is termed the maximum expansion ratio (ERm). The ERm value is mainly dependent upon the amount of water added, namely the foaming water content (FWC). ERm increases with higher FWC. After reaching its maximum volume, the foam dissipates rapidly accompanied by steam gas escaping. The time that the foam takes to collapse to half of its maximum volume is called the half life (HL). In the above example, HL would normally be between 20-30 seconds. After a particular time (around 60 seconds), the foam volume reduces very slowly and asymptotically. During this phase, foam bubbles still survive even though the bitumen has become harder.
Jurnal eco REKAYASA, Vol. 4, No. 2, September 2008
It is noted that a molecule of surfactant is amphiphilic by means of both a hydrophobic and a
hydrophilic part. At sufficiently high bulk
concentrations, the surfactant molecules form micelles in which the hydrophobic ’tails’ are surrounded by hydrophilic ‘head’. Basically, the surfactant molecules prefer to be present at an interface rather than within the body of the liquid. In this case, the tail groups are in the gaseous phase while the head groups remain within the liquid phase. This arrangement potentially reduces the surface tension of the interface. However, if the surfactant molecules form micelles, they will not be able to affect the surface tension and hence will not benefit the foam properties.
CHARACTERISTICS OF FOAMED ASPHALT STIFFNESS
Sunarjono et al (2007) have investigated the relationship between foamed bitumen properties and its mixture stiffness. Foamed asphalt mixture (FAM) properties have been investigated at various degree of binder distribution in terms of foaming water
contents (FWC) at a temperature of 180oC using a
bitumen Pen 70/100. The aggregates were
mechanically mixed with the foamed bitumen at a range of FWC’s using either a dough hook or a flat Hobart agitator. The indirect tensile stiffness modulus values of all specimens was measured at a
temperature of 20oC following a curing period of 3
days at 40°C. The results indicated that the better mixing was found to aid material properties thus enhancing mix stiffness, with the flat agitator performing better than the dough hook. The better mixing means better foam distribution across the aggregate phase. Optimum performance was obtained at a FWC of 5% for specimens prepared using FB 70/100 at 180oC. This became even more evident when the full range of testing temperatures and curing conditions were considered. It may be that the optimum performance is obtained with the best binder distribution in the mixture, in which state the mixture is more sensitive to testing temperature and curing condition.
Sunarjono (2008a) also found that at a test
temperature of 5oC binder distribution is more
important than binder stiffness in developing the ITSM value. It was observed that at a test
temperature of 20oC the ITSM values of specimens
produced using bitumen Pen 160/220 were lower than the ITSM values of specimens produced using
bitumen Pen 70/100, but at a test temperature of 5oC
the result was the reverse. The reason is that of specimens using Pen 160/220 are better binder distribution than specimens using bitumen Pen
70/100 because a bitumen Pen 160/220 is softer than a bitumen Pen 70/100,.
OBSERVING BINDER DISTRIBUTION IN FAM
In this section, the formation of binder distribution in various trial mixtures was studied in order to understand the binder distribution in foamed asphalt mixtures.
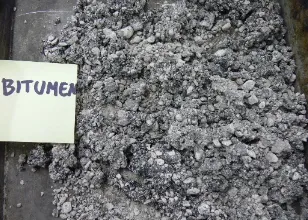
Firstly, a clear difference is observed between foamed bitumen and hot bitumen when they are sprayed onto cold wet aggregates. The result mixture of foamed bitumen spraying is a well distributed binder across the aggregate phase, whereas hot bitumen spraying results in an uncombined asphalt mixture spotted with large aggregate-bitumen globules. The photographs of these two trial-mixtures can be seen in Figure 1 and Figure 2. These results can be explained by referring to the theory of foam. In the foaming process, bitumen molecules diffuse from the bulk phase to the interface (Barinov, 1990). These molecules act as surfactants which are composed of a hydrophilic ‘head’ and a hydrophobic ‘tail’ (Breward, 1999). The hydrophilic ‘head’ prefers to be present in liquid phase whereas the hydrophobic tails prefer to stay at the air interface. When foam is sprayed onto wet aggregates, the hydrophilic heads will encourage distribution onto wet aggregate surfaces, whereas hot liquid bitumen can not distribute onto wet aggregate surfaces effectively since most of its molecules prefer to stay in the bulk phase.
The Mixture of Binder Distribution in Foamed Asphalt Mixture ……….(Sri Sunaryono)
67
Figure 2 Appearance of binder distribution of foamed bitumen sprayed into cold wet aggregates: the binder is well distributed in the mixture and forms small binder-fines particles.
Secondly, the differences in binder distribution in FAM at various mixing times have been well identified. As shown in Figure 3 and 4, it is clearly observed that during mixing process foam does not fully coat and seal the aggregates, as in the case of HMA, but it distributes across the aggregate phase as combined bitumen-fine aggregate particles. Foam forms large soft mastic globules with a size of 2-3 cm at the beginning of the mixing process (e.g. at 2 seconds). These globules appear broken into smaller pieces at 5 seconds and then distribute in the mixture (at 10 seconds) and form a more homogenous foamed asphalt mixture at the end of mixing (60 seconds). It is noted that the binder mainly distributes on the fine aggregate particles and forms combined bitumen-fines clusters.
Figure 3. Appearance of binder distribution of FAM at 2 sec mixing time: forming large soft mastic globules and at 5 sec mixing time: forming broken soft mastic globules
Figure 4. Appearance of binder distribution of FAM at 10 seconds mixing time: forming binder-fines particles and at 60 seconds mixing time: forming small binder-fines particles (well distributed).
Thirdly, the formation of binder distribution has been observed at the beginning of the mixing process at various FWC values. The effect of foam volume (ERm) on the binder distribution at the beginning of mixing also needs to be understood. Unfortunately, the differences due to ERm are not clear visually (see Figure 5 and 6). This means that the effect of ERm on the binder distribution does not appear to be as significant as the effect of mixing time.
Finally, the formation of binder distribution when foamed bitumen is sprayed into single size aggregate
has also been observed. Initially, the aim of this observation was to assess the maximum aggregate size that would be coated by foam; it was observed that binder distribution across the aggregate phase depends upon the aggregate size (see Figure 7 and 8). If foam was sprayed onto filler at high content (~10%), the resulting mixture appears as a uniform non-cohesive black powder. But if the binder content is low, the binder disappears and is trapped amongst the filler particles. If foam is sprayed onto larger aggregate sizes, the binder distribution becomes less homogenous.
Figure 5. Appearance of binder distribution at 2 seconds mixing time of FAM produced at a FWC of 1% and FWC of 5%.
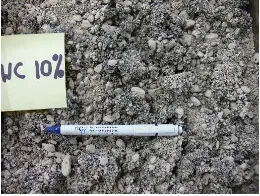
Figure 6. Appearance of binder distribution at 2 seconds mixing time of FAM produced at a FWC of 10%.
Jurnal eco REKAYASA, Vol. 4, No. 2, September 2008
Figure 8. Appearance of binder distribution of FAM produced using single size aggregates 3/5mm (Left) and 6mm (Right).
ASSESSING THE BINDER DISTRIBUTION Binder distribution has been assessed using the particle size distribution test according to BS 812-103.1: 1985 [11]. The test procedure is as follows:
1. Following mixing, the loose foamed asphalt
mixture is air dried for at least 3 days,
2. Foam material is then separated using dry sieving
into fractions in the range from maximum size (passing 20mm) down to minimum size (passing 0.075mm).
3. Each fraction is then washed using sieve no.
1.18mm and 0.075mm to allow the filler to flow out,
4. The washed fractions are then oven dried at 60oC
before the soluble binder content test is conducted to find the binder content and particle size distribution for each fraction.
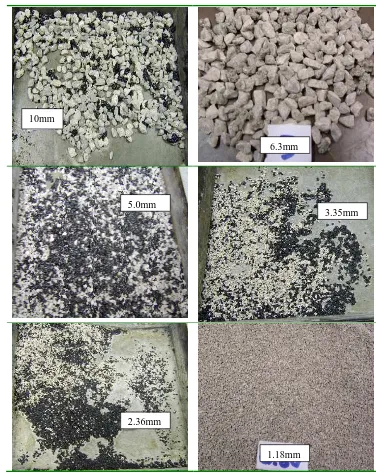
The completed results can be found in Table 1 to Table 3, while the photographs of binder distribution for each fraction can be seen in Figure 9.
Figure 10 shows the bitumen content and aggregate proportion for each fraction. The fractions are obtained by dry sieving; this means that fine aggregate particles are probably attached to the coarse fractions. It can be seen that the binder contents in the fine fractions (< 0.3mm) and coarse fractions (>6.3mm) are both low. Binder content is found to be high at medium fractions (0.3mm– 6.3mm) and it is a maximum at 2.36mm. It should be noted that the absence of binder in the finest fractions does not mean that binder does not distribute onto fine aggregate, but that some fine particles are bonded together to form larger clusters. In the case of low binder content in coarse fractions, this means that binder is unable to distribute on them.
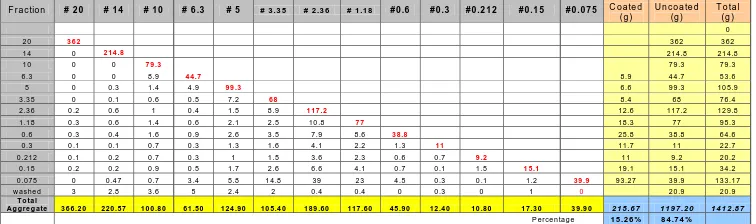
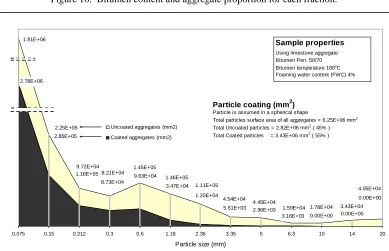
Figure 11 shows the distribution of coated and uncoated aggregates in terms of particle surface area. This result comes from wet sieving tests of all fractions, following the soluble binder content test. As an example (see Table 2), for fraction #14 (passing sieve size 14mm) with an aggregate mass of 220.57 g, sieved down to sieve size of 0.075mm, this results in 214.8g quantities retained on sieve size 10mm (passing sieve size of 14mm) and other quantities are retained on the smaller sieve sizes. The aggregate mass from fraction #14 retained on sieve size 10mm is classified as uncoated, whereas all aggregate particles passing sieve size 10mm are classified as coated. Thus, the mass of coated and uncoated particles for each size can be determined as shown in Table 2. By assuming the aggregate
particles are spherical in shape and a density of
2680kg/m3, the quantity of coated and uncoated
particles can therefore be determined in terms of
volume (mm3), number of particles and particle
surface area (mm2) as shown in Table 3.
10mm
6.3mm
3.35mm 5.0mm
1.18mm 2.36mm
Figure 9. Binder distribution across the aggregate phase for fraction 10mm, 6.3mm, 5mm, 3.35mm, 2.36mm and 1.18mm
It can be seen that coated particles only comprise around 15% by mass or volume, but they are about 60% in terms of number of particles or 55% in terms of particle surface area. As shown in Figure 11, the smaller the particle size the higher the proportion coated by binder, and thus the filler size fraction is the best coated (around 80% of the coated particle surface area or 45% of the whole particle surface area). The maximum size of coated aggregate is 6.3mm. It should be noted (see Table 3) that for particle sizes of 0.3mm and less, the particle surface area of coated aggregates is more than that of uncoated aggregates; for particle sizes of 0.6mm and above, the particle surface area of coated aggregates is less than that of uncoated aggregates; for particle size 10mm and above, all aggregates are uncoated. This means the binder content of large fractions i.e. fractions #10 and #14 (see Figure 10), is basically binder from accompanying fine aggregates.
The Mixture of Binder Distribution in Foamed Asphalt Mixture ……….(Sri Sunaryono)
69 BINDER DISTRIBUTION MECHANISM
In foamed asphalt mixtures (FAM), the bitumen is sprayed onto wet aggregate in the form of foam at the start of the mixing process. It can be
understood that both the foamed bitumen
characteristics and the mixing protocol therefore become important aspects in FAM production. However, a FAM produced using a good quality foam will not exhibit high performance if it is mixed using a poor mixer.
As discussed previously, it is clear that following the mixing process, the loose FAM consists of two particle types, i.e. aggregate and combined bitumen-fines particles. About 15% of the aggregate mass was found to be coated by binder. The maximum coated particle size is 6.3mm and the maximum binder-fines particle size is found to be 14mm. In this circumstance, the number (and size) of binder-fines particles becomes crucial since it influences binder distribution. A greater number of binder-fines particles or smaller sized binder-fines particles results in better binder distribution, which stimulates the compaction process and hence potentially enhances the mixture properties. Thus, the mechanism of binder distribution needs to be well understood. Basically, foam is created immediately following injection of pressurised air and water into the hot bitumen phase in the expansion chamber. The number of foam bubbles may grow rapidly under high pressure. When foam is sprayed out into a steel cylinder, the growth in bubble size can be seen clearly due to the internal pressure being higher than the surrounding pressure.
Therefore, it can be understood that the hot bitumen has changed, becoming a foam which is directly sprayed into the wet aggregate mixture. This means the key bitumen properties have changed from bulk properties to surface properties, allowing the foam to distribute onto the wet surface (interface between air and liquid). When foam is in contact with the moist aggregate, it has no chance to grow, as evidenced in the measuring cylinder due to its temperature
immediately reducing to below 100oC. Steam gas
inside the bubbles may return to the water phase. However there are still large numbers of tiny voids trapped inside the bitumen as assessed in density tests of collapsed foam (see Sunarjono, 2008b). This void content is found to be higher for foam generated at higher FWC. The presence of these voids causes the collapsed foam to remain soft and workable. It is supposed that during mixing, the binder properties are proportional to those of foam when investigated in the measuring cylinder (in terms of ERm, HL or flow behaviour).
As discussed in Sunarjono et al (2007), the mixing speed and agitator type have a significant effect on
mixture stiffness since the mixer helps the foam to spread onto the wet aggregate surface. Mixer speed has to be high enough to cope with the spraying rate of the foam. As a simple analogy, the work of the mixer can be imagined as a conveyor. If aggregates are put onto a conveyor and sprayed with foam, a higher speed of conveyor and a larger volume of foam will result in more aggregate surface area being sprayed. Because foams collapse soon after contact with moist aggregates the mixer speed and foam volume over the contact period are very important. During this period, the agitator is used to agitate the aggregate particles so that they can be sprayed by foam as effectively as possible.
In fact, foam prefers to distribute onto a wet surface (air-liquid interface) due to the presence of amphiphilic surfactant molecules on the bubble lamellae. Foam therefore prefers to distribute on the water phase, which is mainly present amongst fine particles due to suction effects. When foam contacts the moist fine particles, it collapses immediately due to rapid temperature reduction and it therefore forms mastic globules. These mastic globules are still warm
and soft with a temperature of between 90oC and
61oC (see Sunarjono, 2008b). This condition allows
Jurnal eco REKAYASA, Vol. 4, No. 2, September 2008
CONCLUSIONS
It was understood that following the mixing process the foam distributes onto fine aggregates forming larger particles of various sizes, for which the most binder rich is found to be at 2.36mm size for this sample (FWC of 4%). These binder rich ‘particles’ mainly consist of fine aggregates (largely filler) and the maximum coated aggregate size is 6.3mm. The mechanism of binder distribution, which has to be well understood in order to know the characteristics of foamed asphalt mixture, has been fully described. It is found that the binder formation is that of a combination of bitumen and fine
aggregate, forming particles that distribute across the aggregate phase. The properties of these binder-fines particles become crucial during mixing process. The workability of binder-fines particles influences the uniformity of the binder distribution. A uniform mixture in terms of binder distribution will potentially achieve high performance.
ACKNOWLEDGEMENTS
The author is very grateful for the assistance and advice of Dr. N.H. Thom and Dr. S.E. Zoorob. This work was carried out with the financial support of TPSDP program SPMU-UMS unit Civil Engineering.
REFERENSI
Barinov, E.N., 1990. Formation and Properties of Foams. Leningrad Institute of Construction Engineering. Translated from Khimiya i Technologiya Topiv i Masel, No. 10, pp. 24-26, October 1990.
Breward, C.J.W., 1999. The Mathematics of Foam. PhD Thesis, St. Anne’s College, University of Oxford, 1999. British Standard, 1985. Testing Agregates – Part 103: Methods for Determination of Particle Size Distribution - Section 103.1 Sieve Test. BS 812-103.1: 1985.
Sunarjono S., Zoorob S.E. and Thom N.H., 2007. Influence of foaming water on the foaming process and resultant
asphalt mix stiffness. SIIV International Congress Palermo Italy, 12-14 September 2007, Italy.
Sunarjono, S., 2008a. Karakteristik Foamed Asphalt Sebagai Bahan Perkerasan Jalan. Prosiding Seminar Nasional Teknik Sipil 2008, Perkembangan Teknologi Teknik Sipil Terkini, Sabtu 23 Agustus 2008, Gedung Pasca Sarjana UMS, Jurusan Teknik Sipil, Fakultas Teknik, Universitas Muhammadiyah Surakarta, pp. 14-20.
Sunarjono, S., 2008b. The Influence of Foamed Bitumen Characteristics on Cold-Mix Asphalt Properties. PhD Thesis School of Civil Engineering, The University of Nottingham
Table 1. Bitumen and aggregate content in the each fraction for foamed asphalt mixture produced using bitumen Pen 50/70 at Bitumen temperature of 180oC and FWC of 4%.
Fraction # 20 # 14 # 10 # 6.3 # 5 # 3.35 # 2.36 # 1.18 #0.6 #0.3 #0.212 #0.15 #0.075 Total total %
Fraction mass (g) 366.2 221.2 104.0 63.8 133.1 114.4 210.5 129.1 48.6 13.2 11.1 18.1 39.9 1473.2 100.00
Bitumen in fraction (g) 0.00 0.70 3.20 2.30 8.20 9.00 20.90 11.50 2.70 0.80 0.30 0.80 0.00 60.40 4.10 Aggregate in fraction
(g) 366.2 220.5 100.8 61.5 124.9 105.4 189.6 117.6 45.9 12.4 10.8 17.3 39.9 1412.8 95.90 Bitumen (% of fraction
aggregate mass) 0.00 0.32 3.08 3.61 6.16 7.87 9.93 8.91 5.56 6.06 2.70 4.42 0.00 Bitumen (% of total
aggregate mass) 0.00 0.05 0.22 0.16 0.56 0.61 1.42 0.78 0.18 0.05 0.02 0.05 0.00 4.10
Cum% bitumen(by
mass of total aggregate) 0.00 0.05 0.26 0.42 0.98 1.59 3.01 3.79 3.97 4.03 4.05 4.10 4.10 Aggregate (% of total
aggregate mass) 25.92 15.61 7.13 4.35 8.84 7.46 13.42 8.32 3.25 0.88 0.76 1.22 2.82 100.00
Note: (1) Fraction resulting from dry sieving (BS 812-103.1: 1985)
(2) Bitumen content determined using soluble binder content test (BS EN 12697-1: 2000)
Table 2. Aggregate size distribution for each fraction resulted from wet sieving for foamed asphalt mixture produced using bitumen Pen 50/70 at bitumen temperature of 180oC and FWC of 4%.
F ra c tio n # 2 0 # 1 4 # 1 0 # 6 .3 # 5 # 3 .3 5 # 2 .3 6 # 1 .1 8 # 0 .6 # 0 .3 # 0 .2 1 2 # 0 .1 5 # 0 .0 7 5 C o a te d (g )
U n c o a te d (g )
T o ta l (g )
0
2 0 3 6 2 3 6 2 3 6 2
1 4 0 2 1 4 .8 2 1 4 .8 2 1 4 .8
1 0 0 0 7 9 .3 7 9 .3 7 9 .3
6 .3 0 0 8 .9 4 4 .7 8 .9 4 4 .7 5 3 .6
5 0 0 .3 1 .4 4 .9 9 9 .3 6 .6 9 9 .3 1 0 5 .9
3 .3 5 0 0 .1 0 .6 0 .5 7 .2 6 8 8 .4 6 8 7 6 .4
2 .3 6 0 .2 0 .6 1 0 .4 1 .5 8 .9 1 1 7 .2 1 2 .6 1 1 7 .2 1 2 9 .8 1 .1 8 0 .3 0 .6 1 .4 0 .6 2 .1 2 .5 1 0 .8 7 7 1 8 .3 7 7 9 5 .3 0 .6 0 .3 0 .4 1 .6 0 .9 2 .6 3 .5 7 .9 8 .6 3 8 .8 2 5 .8 3 8 .8 6 4 .6 0 .3 0 .1 0 .1 0 .7 0 .3 1 .3 1 .6 4 .1 2 .2 1 .3 1 1 1 1 .7 1 1 2 2 .7 0 .2 1 2 0 .1 0 .2 0 .7 0 .3 1 1 .5 3 .6 2 .3 0 .6 0 .7 9 .2 1 1 9 .2 2 0 .2 0 .1 5 0 .2 0 .2 0 .9 0 .5 1 .7 2 .6 6 .6 4 .1 0 .7 0 .1 1 .5 1 5 .1 1 9 .1 1 5 .1 3 4 .2 0 .0 7 5 0 0 .4 7 0 .7 3 .4 5 .8 1 4 .8 3 9 2 3 4 .5 0 .3 0 .1 1 .2 3 9 .9 9 3 .2 7 3 9 .9 1 3 3 .1 7 w a s h e d 3 2 .8 3 .6 5 2 .4 2 0 .4 0 .4 0 0 .3 0 1 0 2 0 .9 2 0 .9
T o ta l
A g g re g a te 3 6 6 .2 0 2 2 0 .5 7 1 0 0 .8 0 6 1 .5 0 1 2 4 .9 0 1 0 5 .4 0 1 8 9 .6 0 1 1 7 .6 0 4 5 .9 0 1 2 .4 0 1 0 .8 0 1 7 .3 0 3 9 .9 0 2 1 5 .6 7 1 1 9 7 .2 0 1 4 1 2 .8 7
P e rce n ta g e 1 5 .2 6 % 8 4 .7 4 %
The Mixture of Binder Distribution in Foamed Asphalt Mixture ……….(Sri Sunaryono)
71
Table 3. Proportion of coated and uncoated aggregate for foamed asphalt mixture produced using bitumen Pen 50/70 at Bitumen temperature of 180oC and FWC of 4%.
Mass of aggregate (g) Volume of aggregate (mm3)
number of particle aggregate
Total surface area of aggregate (mm2)
Size,mm
Coated Uncoated Total Coated Uncoated Total Coated Uncoated Total Coated Uncoated Total
20 0 362 362 0 135075 135075 0 3.22E+01 3.22E+01 0 4.05E+04 4.05E+04
14 0 214.8 214.8 0 80149 80149 0 5.58E+01 5.58E+01 0 3.43E+04 3.43E+04
10 0 79.3 79.3 0 29590 29590 0 5.65E+01 5.65E+01 0 1.78E+04 1.78E+04
6.3 8.9 44.7 53.6 3321 16679 20000 2.54E+01 1.27E+02 1.53E+02 3.16E+03 1.59E+04 1.90E+04
5 6.6 99.3 105.9 2463 37052 39515 3.76E+01 5.66E+02 6.04E+02 2.96E+03 4.45E+04 4.74E+04
3.35 8.4 68 76.4 3134 25373 28507 1.59E+02 1.29E+03 1.45E+03 5.61E+03 4.54E+04 5.11E+04
2.36 12.6 117.2 129.8 4701 43731 48433 6.83E+02 6.35E+03 7.04E+03 1.20E+04 1.11E+05 1.23E+05
1.18 18.3 77 95.3 6828 28731 35560 7.94E+03 3.34E+04 4.13E+04 3.47E+04 1.46E+05 1.81E+05
0.6 25.8 38.8 64.6 9627 14478 24104 8.51E+04 1.28E+05 2.13E+05 9.63E+04 1.45E+05 2.41E+05
0.3 11.7 11 22.7 4366 4104 8470 3.09E+05 2.90E+05 5.99E+05 8.73E+04 8.21E+04 1.69E+05
0.212 11 9.2 20.2 4104 3433 7537 8.23E+05 6.88E+05 1.51E+06 1.16E+05 9.72E+04 2.13E+05
0.15 19.1 15.1 34.2 7127 5634 12761 4.03E+06 3.19E+06 7.22E+06 2.85E+05 2.25E+05 5.10E+05
0.075 93.27 60.8 154.07 34802 22687 57489 1.58E+08 1.03E+08 2.60E+08 2.78E+06 1.81E+06 4.60E+06 Total 215.67 1197.2 1412.9 80474 446716 527190 1.63E+08 1.07E+08 2.7E+08 3.43E+06 2820011 6.25E+06
Percentage 15% 85% 15% 85% 60% 40% 55% 45%
Note: (1) Aggregate is assumed to be spherical in shape
(2) Density of aggregate is assumed to be 2680 kg/m3 for all sizes
-10 -5 0 5 10 15 20 25 30 # 20 # 14 # 10 # 6.3 # 5 # 3.35 # 2.36 # 1.18 #0.6 #0.3 #0.212 #0.15 #0.075 Fraction A g g re g a te p ro p o rt io n ( % ) 0.00 2.00 4.00 6.00 8.00 10.00 12.00 14.00 16.00 18.00 20.00 22.00 24.00 26.00 28.00 30.00 B it u m e n c o n te n t (% )
Aggregate proportion (% by mass of total aggregate in the mix)
Bitumen content (% by mass of aggregate in the fraction) Using bitumen 50/70
Bitumen temperature 180oC
Design bitumen content 4.0%
Actual bitumen content 4.1% (by total aggregate mass) FWC 4%
Figure 10. Bitumen content and aggregate proportion for each fraction.
0.00E+00 0.00E+00 0.00E+00 3.16E+03 2.78E+06 2.85E+05 1.16E+05 8.73E+04 9.63E+04 3.47E+04 1.20E+04 5.61E+03 2.96E+03 4.05E+04 3.43E+04 1.78E+04 1.59E+04 4.45E+04 4.54E+04 1.11E+05 1.46E+05 1.45E+05 8.21E+04 9.72E+04 2.25E+05 1.81E+06 20 14 10 6.3 5 3.35 2.36 1.18 0.6 0.3 0.212 0.15 0.075
Particle size (mm)
Uncoated aggregates (mm2)
Coated aggregates (mm2)
Particle coating (mm2)
Particle is assumed in a spherical shape
Total particles surface area of all aggregates = 6.25E+06 mm2
Total Uncoated particles = 2.82E+06 mm2 ( 45% )
Total Coated particles = 3.43E+06 mm2 ( 55% )
Sample properties
Using limestone aggregate Bitumen Pen. 50/70 Bitumen temperature 180oC
Foaming water content (FWC) 4%