The effect of sliding distance at different temperatures
on the tribological properties of a palm kernel activated
carbon
–
epoxy composite
Noor Ayuma Mat Tahir
a, Mohd Fadzli Bin Abdollah
a,b,n, Ra
fi
dah Hasan
a,b,
Hilmi Amiruddin
a,ba
Faculty of Mechanical Engineering, Universiti Teknikal Malaysia Melaka, Hang Tuah Jaya, 76100 Durian Tunggal, Melaka, Malaysia
b
Centre for Advanced Research on Energy, Universiti Teknikal Malaysia Melaka, Hang Tuah Jaya, 76100 Durian Tunggal, Melaka, Malaysia
a r t i c l e
i n f o
Available online 14 October 2015 Keywords:The aim of this study is to investigate the effect of sliding distance and temperature on the tribological properties of a palm kernel activated carbon–epoxy (PKAC–E) composite. All specimens were formed into 10-mm diameter pins of 30-mm length. Tribological tests were conducted using a pin-on-disc tribometer. The results show that there is no significant effect on the coefficient of friction (COF) with the sliding distance, although the wear rate is slightly increased. However, when the operating temperature exceeds a critical limit, both the COF and wear rate rapidly increase with sliding distance. As compared with synthetic and other agricultural waste-based polymeric composite, PKAC–E is considered as one of the most potential self-lubricating materials at operating temperature below 90°C.
&2015 Elsevier Ltd. All rights reserved.
1. Introduction
Many studies have been conducted to reduce wear and friction by investigating different types of lubricants or coating materials for tribological applications[1–14]. Several researchers have found that composites activated by either graphite or carbon have the potential to act as self-lubricating materials when reinforced with other metal materials, such as aluminium [2,3,15,16]. Polymer composite possess a huge potential in substituting monolithic alloys due to its unique properties. Natural polymer composites are environmentally friendly version of polymer composite as they were reinforced with natural element such as corn fibre, kenaf powder, and palm ash compared to syntheticfibre such as glass and carbonfibres.
Recently, a substantial amount of research has shifted focus from monolithic materials to composite materials to meet the global demand for lightweight, renewable, high performance, eco-friendly, and wear and corrosion resistant materials. The advan-tages of composite materials include their permeability (optimise waxing properties), cost effectiveness, and different strengthening mechanisms[17–19]. For most wear applications, graphitic carbon
(mainly in sp2 bonding) has been used because its addition reduces the coefficient of friction and increases wear resistance as compared with the matrix. Zamri et al.[15,16]found that graphite and porous carbon (also known as activated carbons) exhibited the potential to act as a self-lubricating material when reinforced with an aluminium alloy, which significantly improves the wear resis-tance by increasing the carbon content up to 10 wt%. Gomes et al.
[20]stated in their study of carbon–carbon composites that the friction coefficient is relatively independent of the sliding speed, but is highly affected by the test temperature.
Palm Kernel Activated Carbon (PKAC) is a waste from palm oil extraction process. This waste contains carbon properties and residual oils (natural lubricant), which has potential to become a new self-lubricating materials. Current commercial self-lubricating material is relatively expensive. Thus, implementing a carbon material from agriculture wastes as new reinforcement substitutes in the fabrication of polymer matrix composites, are supposed to have large potential for a zero waste strategy in improving tribological properties at an affordable cost[3,15–23].
In general, as observed from previous study, there is no study regarding the potential of PKAC as solid lubricant in polymer matrix composites. Thus, the present study was carried out to examine the fundamental effect of sliding distance and tempera-ture on the tribological properties of palm kernel activated car-bon–epoxy (PKAC–E) composite under a dry sliding condition. Contents lists available atScienceDirect
journal homepage:www.elsevier.com/locate/triboint
Tribology International
http://dx.doi.org/10.1016/j.triboint.2015.10.001 0301-679X/&2015 Elsevier Ltd. All rights reserved.
n
Corresponding author at: Faculty of Mechanical Engineering, Universiti Teknikal Malaysia Melaka, Hang Tuah Jaya, 76100 Durian Tunggal, Melaka, Malaysia. Tel.:þ60 6 234 6805/6914.
E-mail address:[email protected](M.F.B. Abdollah).
2. Methodology
2.1. Specimen preparation
The materials used in this study are PKAC and high-density epoxy [West system 105 epoxy resin (105-B) and West system 206 slow hardener (206-B)]. The PKAC was obtained from manu-facturer and the preparation of the PKAC is confidential. The PKAC was blended using a blender and sieved with a 1-mm sieve. The residual material (i.e., larger than 1 mm) was blended and re-sieved. Thefine PKAC (sizer1 mm) was then weighed to 70 wt% and mixed with epoxy 30 wt% (at a resin to hardener ratio of 4:1).
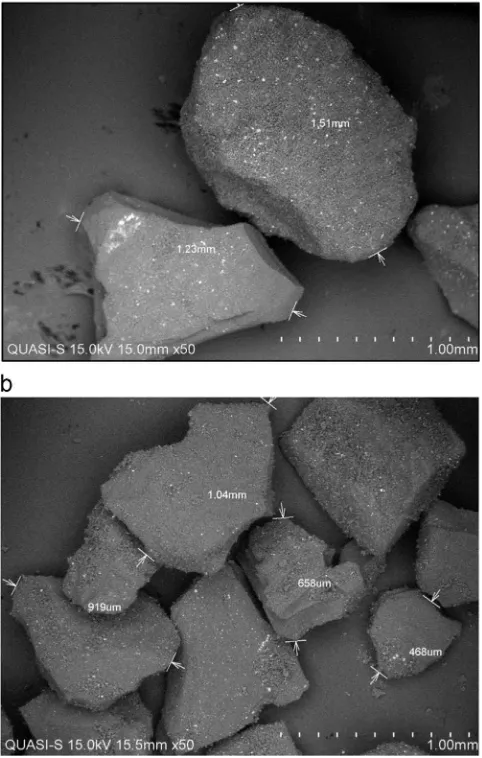
Fig. 1shows the SEM micrograph of the PKAC particles before and after sieving. The mixed PKAC and epoxy were then placed into a mould, hot-pressed at 80°C with 2.5 MPa pressure for mately 10 min and left to cool at room temperature for approxi-mately 10 min before being pressed out from the mould. The pin specimens, with 10-mm diameters and 30-mm heights, were left to cure at room temperature for approximately one week.Fig. 2
shows the mould, the specimen and its cross-sectional image in this study. The cross-sectional micrograph of the specimen shows only a partial area of the whole cross-section of the composite pin. This is due to the focusing image on the grain size and distribution. The surface area analysis were calculated manually. The hollow part was about 6% of the total area. By neglecting the hollow part,
the summation of the grain display was about 69%. Hence, it can be said that from the surface analysis, the epoxy contain was about 31%. However, this value was subjected to change as the focus area changed.
The density and hardness of the specimen were measured using densitometer and Shore Hardness Durometer-D type, respectively. Besides, the porosity was measured based on the Archimedes principle.
The mechanical properties of the pin specimens and discs are shown inTable 1.
2.2. Pin-on-disc test
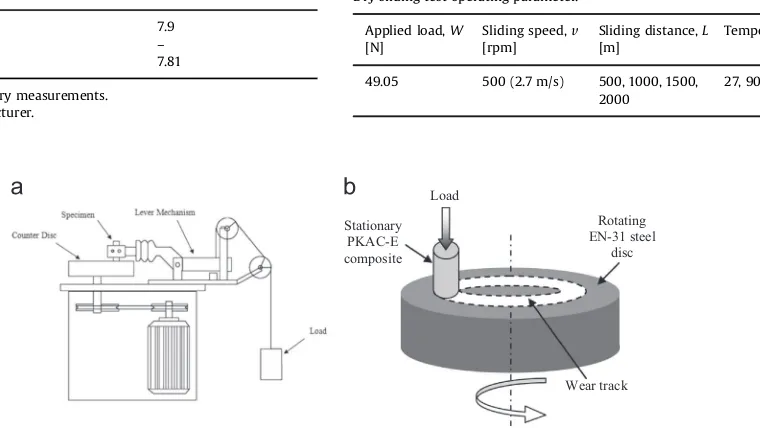
The dry sliding test was performed following the ASTM stan-dard[24]and used a pin-on-disc tribometer under different slid-ing distances between 500 m and 2000 m at temperatures rangslid-ing from 27°C to 150°C. The heat was supplied to and measured on the pin specimen. All of the tests were performed at a constant sliding speed of 500 rpm (2.7 m/s) and an applied load of 49.05 N. The average surface roughness was approximately 0.40mm70.02 for the pin specimen and approximately 0.13mm70.02 for the disc. Prior to the sliding test, the discs were cleaned using acetone in an ultrasonic bath. The pin was then mounted vertically on the tester arm at one end, and the other pin surface was held against the rotating disc. The schematic diagrams of the pin-on-disc tribometer and the actual placement image are shown in
Figs. 3and4, respectively. The test conditions are summarised in
Table 2.
The coefficient of friction (COF) and frictional force were measured using a PC-based data logging system. The following Fig. 1.SEM micrograph of PKAC particles (a) before and (b) after sieving.
formula was used:
μ
¼ FW ð1Þ
where mis the COF, F is the frictional force inN, and Wis the
applied load inN.
It was assumed that the disc had negligible wear because there was no weight changes recorded after the test. The wear of the pin was recorded by measuring the mass of the pin before and after the pin-on-disc test. The mass loss was determined by taking the mass differences, and the mass loss (precision of 0.001 g) was converted to volume loss by dividing by the bulk density of the specimen. The specific wear rate was determined as follows:
Vloss¼ Nmm,Wis the applied load in N, andLis the sliding distance in mm.
2.3. Surface morphology observation
The surface roughness of the worn surfaces was measured using a profilometer. Furthermore, the morphology of the particles and worn surfaces were observed and analysed using scanning electron microscopy (SEM) and energy-dispersive X-ray spectroscopy (EDX).
3. Results and discussion
Fig. 5shows the COF result at different sliding distances with an increased operating temperature for a PKAC–E composite sliding against EN-31 carbon alloy steel. There was no significant
difference between the COFs and sliding distance below the operating temperature of 90°C. The COF was approximately 0.23– 0.33. This result is consistent with Rao and Das[25], who also found that the average COF was unchanged with sliding distance. However, the COF gradually increases with sliding distance as the temperature exceeds 90°C. The gradual increase of COF with sliding distance at higher operating temperature may have been due to the thermal degradation of the epoxy binder, which causes ploughing of the test pin surface, as shown inFig. 6. Thisfinding is in agreement with the research of Chowdhury and Helali[26]. The ploughing effect causes the friction force to increase with rubbing time. It can also be observed that after a distance of 1500 m at 150°C, the COF was constant in the range of 0.71–0.74. In this case, it is believed that tribofilm begins to form on the counter surface.
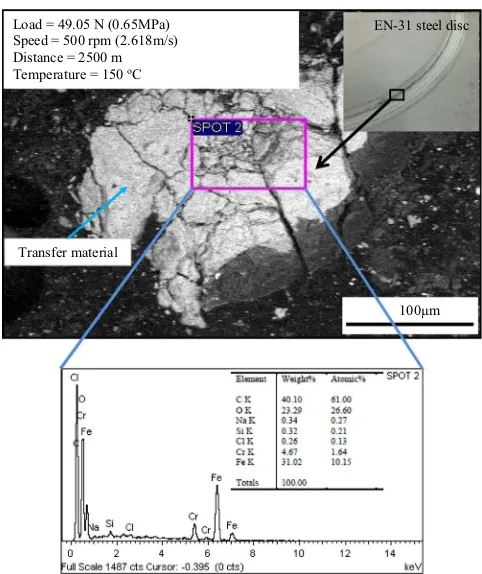
Fig. 7clearly shows that the transferfilm of the carbon element is generated at the counter surfaces. A transferfilm of the carbon materials is formed on the counter surface and helps to stabilise the friction between the surfaces. The tribofilm generated from the preferential wear of the soft carbon material results in a
carbon-Rotating
Fig. 3.(a) Schematic diagram of a pin-on-disc tribometer and (b) an illustration of the specimen placement.
EN-31 steel
Fig. 4.Actual set up of a pin-on-disc test.
Table 2
Dry sliding test operating parameter.
Applied load,W
49.05 500 (2.7 m/s) 500, 1000, 1500, 2000
27, 90, 150 Table 1
Mechanical properties of the pin and disc materials before testing.
Properties aPin (70 wt% PKACþ30 wt% Epoxy)
bDisc (EN-31 carbon alloy steel)
Hardness,H[GPa] 8.8 7.9
Porosity [%] 1.21 –
based tribofilm adhering to the counter surface, which breaks the adhesive joints between the asperities and leads to low or main-tained friction[21,27].
Fig. 8shows the specific wear rate result of a PKAC–E compo-site at different sliding distances with increasing operating tem-perature. The wear rate gradually increases with the operating temperature and sliding distance. The generated wear debris is clearly observed inFig. 9. At a lower operating temperature, it is
0.0
0 500 1000 1500 2000 2500
Coefficient of friction, COF
Sliding distance, L[m] 27 oC
Fig. 5.Steady state coefficient of friction as a function of (a) sliding distance and (b) operating temperature for the PKAC–E composite. The error bar is for standard deviation.
Fig. 6.SEM micrograph showing the ploughing effect of the test PKAC–E composite at 150°C.
100µm Load = 49.05 N (0.65MPa)
Speed = 500 rpm (2.618m/s) Distance = 2500 m Temperature = 150 oC
EN-31 steel disc
Transfer material
Fig. 7.SEM micrograph and EDX spectrum showing that the transferfilm of the carbon element is generated at the counter surfaces.
0
0 500 1000 1500 2000 2500
Specific wear rate,
k
[mm
3/Nmm] x 10
-10
Sliding distance, L[m] 27oC
proposed that the increase in the wear rate with sliding distance could be due to abrasive wear, where higher frictional heating inhibits abrasion. Rao and Das[25]explained that as temperature increases, the subsurface deformation also increases. This defor-mation will cause surface to be oxidised and releasing fragments. It is clearly observed inFig. 10that parallel grooves are formed by
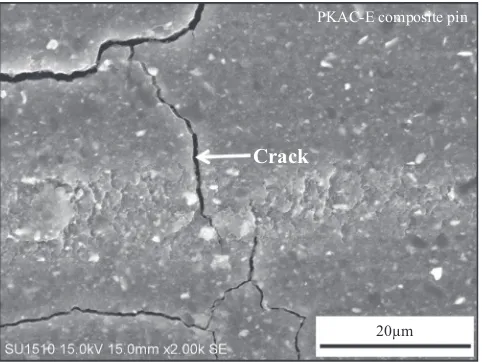
abrasive wear at 90°C. At 150°C, more adhesion was observed. The ploughed surface, as shown in Fig. 6, is symptomatic of adhesive wear. Surface fatigue occurred with crack formation to induce delamination wear, as shown inFig. 11. Nirmal et al.[28]
stated in their review that delamination wear was predominantly due to polymer swelling. Delamination typically occurs with mild signs of pitting, peel off, and cracks in the worn surface. As the temperature increases, material hardness also decreases. This phenomenon could potentially increase wear. FromFig. 12, it can Fig. 9.SEM micrograph of wear debris generated after the sliding test.
Unworn surface of PKAC-E composite pin Ra= 0.40 m
Worn surface of PKAC-E composite pin Ra= 0.78 m
µ µ
Fig. 10. Optical micrograph of the (a) unworn surfaces and (b) worn surfaces of the PKAC–E composite at 90°C.
20µm
Crack
PKAC-E composite pin
Fig. 11. SEM micrograph of the worn surfaces of the PKAC–E composite showing delamination wear occurring at 150°C.
8.83
8.31
5.75
0 1 2 3 4 5 6 7 8 9 10
27 90 150
Hardness,
H
[GPa]
Temperature, T[oC]
Fig. 12.Average hardness of the PKAC–E composite at different operating tem-peratures. The error bar is for standard deviation.
be observed that the average hardness of the PKAC–E composite began to decease above an operating temperature of 90°C. At 150°C, the PKAC–E loses approximately 30% of its original hard-ness. It is believed that there is also a thermally activated process between the PKAC and epoxy in the composite when the tem-perature is increased. The thermal activation process occurs because of the thermal degradation of epoxy binder, which pyr-olyses and oxidises. Hence, the epoxy element degraded as gas and other degradation products. Epoxy is one of the ester groups. The pour point of ester groups is lower at approximately 30–40°C. Reaching the pour point, epoxy tends to form a highly viscous liquid. However, it is crystallisation-inhibited; therefore, epoxy is rarely used above the pour point. The degradation of epoxy by this mechanism typically occurs at temperatures of approximately 70– 80°C. Bhatnagar [29] stated that epoxy has absorption and degradation behaviours of its own. He also suspected that water absorption can cause a decrease in glass transition (Tg) because of strong hydrogen bonds as water was present at micro-cracks. This absorption can cause atom bonds to weaken and influence the mechanical properties. Thus, the rapid increasing of the wear rate above an operating temperature of 90°C was not only caused by the thermal degradation and reduction of hardness but also by the chemical and catalytic degradation due to the epoxy properties. This result is supported by Brostow et al.[30], who found that temperature has a direct impact on the wear of polymers.
The increase in the COF and wear rate with sliding distance could also be due to the changing of surface roughness during the sliding test, as shown inFig. 13. It can be clearly observed that the
surface roughness gradually increased with sliding distance at temperatures above 90°C. However, at 27°C, sliding distance does not have a significant effect on surface roughness. These results are proportional with the COF and wear rate results, as shown in
Figs. 5and9, respectively.
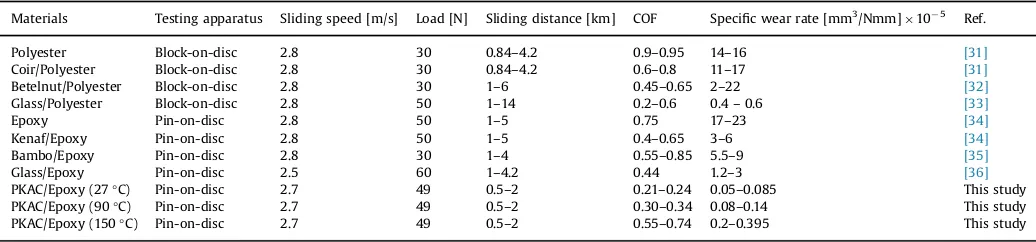
Table 3 lists the most recent studies on the tribological per-formance of commercial and other agricultural waste-based polymeric composites for comparison purposes. The data in
Table 3is extracted and represented inFig. 14. The PKAC–E com-posite shows a lower COF and a higher wear resistance compared to other synthetic polymers and their composites. However, after the critical limit of 90°C, the COF is slightly increased. Thus, PKAC– E is most preferable in improving friction coefficient and wear resistance at operating temperature below 90°C.
4. Conclusions
In conclusion, there is no significant effect on the coefficient of friction (COF) with sliding distance; although, the wear rate is slightly increased. However, when the operating temperature exceeds a critical limit, both the COF and wear rate increase rapidly with sliding distance. Abrasive, adhesive and crack formations that would induce delamination were identified as predominant wear mechanisms. As compared with synthetic and other agricultural waste-based polymeric composite, PKAC–E is considered as one of the most potential self-lubricating materials at operating tem-perature below 90°C.
0.0
0 500 1000 1500 2000 2500
Surface roughness,
Ra
[µ
m
]
Sliding distance, L[m] 27oC
Fig. 13.Average surface roughness of the PKAC–E composite at different operating temperatures and distances. The error bar is for standard deviation.
Table 3
Collected data from previous studies for the coefficient of friction and specific wear rate of synthetic and other agricultural waste-based polymeric composite under dry sliding conditions that were tested at room temperature. The data for the PKAC–E composite is gathered from this study.
Materials Testing apparatus Sliding speed [m/s] Load [N] Sliding distance [km] COF Specific wear rate [mm3/Nmm]10 5 Ref.
Polyester Block-on-disc 2.8 30 0.84–4.2 0.9–0.95 14–16 [31]
Coir/Polyester Block-on-disc 2.8 30 0.84–4.2 0.6–0.8 11–17 [31]
Betelnut/Polyester Block-on-disc 2.8 30 1–6 0.45–0.65 2–22 [32]
Glass/Polyester Block-on-disc 2.8 50 1–14 0.2–0.6 0.4–0.6 [33]
Epoxy Pin-on-disc 2.8 50 1–5 0.75 17–23 [34]
Kenaf/Epoxy Pin-on-disc 2.8 50 1–5 0.4–0.65 3–6 [34]
Bambo/Epoxy Pin-on-disc 2.8 30 1–4 0.55–0.85 5.5–9 [35]
Glass/Epoxy Pin-on-disc 2.5 60 1–4.2 0.44 1.2–3 [36]
PKAC/Epoxy (27°C) Pin-on-disc 2.7 49 0.5–2 0.21–0.24 0.05–0.085 This study
PKAC/Epoxy (90°C) Pin-on-disc 2.7 49 0.5–2 0.30–0.34 0.08–0.14 This study
Acknowledgements
The authors are grateful for the contributions by members of the Green Tribology and Engine Performance (G-TriboE) research group. This research was funded by a Grant from the Ministry of Higher Education Malaysia (Grant no.: ERGS/2013/FKM/TK01/ UTEM/02/04/E00016).
References
[1]Findik F. Latest progress on tribological properties of industrial materials. Mater Des 2014;57:218–44.
[2]Li W, Zheng S, Cao B, Ma S. Friction and wear properties of ZrO2/SiO2 com-posite nanoparticles. Nanopart Res 2011;13:2129–37.
[3]Bakry M, Mousa M, Ali W. Friction and wear of friction composites reinforced by naturalfibres. Mater Sci Eng Technol 2013;44(1):21–8.
[4]Baradeswaran A, Perumal AE. Wear and mechanical characteristics of Al 7075/ graphite composites. Composites 2014;6:472–6.
[5]Kato K. Wear in relation to friction–a review. Wear 2000;241(2):151–7.
[6]Ghassemiah E. Materials in automotive application, state of the art and pro-spects. In: Chiaberge M, editor. New trends and developments in automotive industry. Croatia: InTech; 2011.
[7]Yoon ES, Kong H, Kwon OK, Oh JE. Evaluation of frictional characteristics for a pin-on-disk apparatus with different dynamic parameters. Wear 1997;203–
204:341–9.
[8]Abdollah MFB, Yamaguchi Y, Akao T, Inayoshi N, Miyamoto N, Umehara N, Tokoroyama T. Phase transformation studies on the a-C Coating under repe-titive impacts. Surf Coat Technol 2010;205:625–31.
[9]Abdollah MFB, Yamaguchi Y, Akao T, Inayoshi N, Miyamoto N, Umehara N. Deformation-wear transition map of DLC coating under cyclic impact loading. Wear 2012;274–275:435–41.
[10]Zhou ZF, Li KY, Bello I, Lee CS, Lee ST. Study of tribological performance of ECR–CVD diamond-like carbon coatings on steel substrates. Wear
2005;258:1589–99.
[11]Sharma SC, Giris BM, Kamat R, Satish BM. Graphite particles reinforced ZA-27 alloy composite materials for journal bearing application. Wear 1998;219:162–8.
[12]Zhai W, Shi X, Wang M, Xu Z, Yao J. Grain refinement: a mechanism for gra-phene nanoplatelets to reduce friction and wear of Ni3Al matrix self-lubricating composites. Wear 2014;310:33–40.
[13]Erdemir A. Genesis of superlow friction and wear in diamond like carbon films. Tribol Int 2004;37:1005–12.
[14]Abdollah MFB, Mazlan MAA, Amiruddin H, Tamaldin N. Experimental study on friction and wear behaviors of bearing material under gas lubricated condi-tions. J Teknol (Sci Eng) 2014;66(3):43–9.
[15]Zamri Y, Shamsul JB. Physical properties and wear behaviour of aluminium matrix composite reinforced with palm shell activated carbon (PSAC). Met Mater 2011;49(4):287–95.
[16]Zamri Y, Shamsul JB, Misbahul A, Nur Hidayah AZ. Sliding wear properties of hybrid aluminium composite reinforced by particles of palm shell activated carbon and slag. J Sci Technol 2010;2(10):79–96.
Fig. 14.(a) Coefficient of friction and (b) specific wear rate of synthetic and other agricultural waste-based polymeric composite under dry sliding conditions and tested at room temperature. The data for the PKAC–E composite is gathered from this study. The error bar is for maximum and minimum of mean value.
[17]Uvaraj VC, Natarajan N, Rajendran I, Sivakumar K. Tribological behavior of novel hybrid composite materials using taguchi technique. J Tribol 2013;135 (2):1–12.
[18]Rymuza Z. Tribology of polymers. Arch Civ Mech Eng 2007;7(4):177–84.
[19]Nguong CW, Lee SNB, Sujan DA. Review on naturalfibre reinforced polymer composites. Int J Chem Nucl Metall Mater Eng 2013;7(1):33–40.
[20]Gomes JR, Silva OM, Silva CM, Pardini LC, Silva RF. The effect of sliding speed and temperature on the tribological behaviour of carbon–carbon composites.
Wear 2001;249(3–4):240–5.
[21]Alexeye V, Jahanmir S. Mechanics of friction in self-lubricating composite materials I: mechanics of second-phase deformation and motion. Wear 1993;166(1):41–8.
[22]Alexeyev N, Jahanmir S. Mechanics of friction in self-lubricating composite materials II: deformation of the interfacialfilm. Wear 1993;166(1):49–54.
[23]Chua KW, Abdollah MFB, Tahir NAM, Amiruddin H. Potential of palm kernel activated carbon epoxy (PKAC-E) composite as solid lubricant: Effect of load on friction and wear properties. J Tribol 2014;2:31–8.
[24] ASTM G99-05(2010), Standard Test Method for Wear Testing with a Pin-on-Disk Apparatus. ASTM International: West Conshohocken, PA; 2010.〈www. astm.org〉.
[25]Rao RN, Das S. Effect of sliding distance on the wear and friction behavior of as cast and heat-treated Al–SiCp composites. Mater Des 2011;32:3051–8.
[26]Chowdhury MA, Helali MM. The effect of amplitude of vibration on the coefficient of friction for different materials. Tribol Int 2008;41(4):307–14.
[27] Luo Q. Tribofilms in solid lubricants. Encyclopedia of Tribology. Springer; 2013. [28] Nirmal U, Hashim J, Ahmad MMHM. A review on tribological performance of
naturalfibre polymeric composites. Tribol Int 2015;83:77–104.
[29] Bhatnagar MS. Epoxy resins (overview). The polymeric materials encyclope-dia. USA: CRC Press, Inc.; 1996.
[30] Brostow W, Kovačevic V, Vrsaljko D, Whitworth J. Tribology of polymers and polymer-based composites. J Mater Educ 2010;32(5–6):273–90.
[31]Yousif BF. Frictional and wear performance of polyester composites based on coirfibres. Proc Inst Mech Eng: J Eng Tribol 2009;223:51–9.
[32] Yousif BF, Saijod TWL, McWilliam S. Polyester composite based on betelnut fibre for tribological applications. Tribol Int 2010;43:503–11.
[33] Yousif BF, El-Tayeb NSM. Tribological evaluations of polyester composites considering three orientations of CSM glassfibres using BOR machine. Appl Compos Mater 2007;14:105–16.
[34] Yousi BF, Chin CW. Potential of kenaffibres as reinforcement for tribological applications. Wear 2009;267:1550–7.
[35] Nirmal U, Hashim J, Low KO. Adhesive wear and frictional performance of bamboofibres reinforced epoxy composite. Tribol Int 2012;47:122–33.