PRODUCTIVITY IMPROVEMENT THROUGH MOTION AND TIME STUDY
Mohd Razali Muhamad1 & Wan Hasrulnizzam Wan Mahmood2 Faculty of Manufacturing Engineering
Kolej Universiti Teknikal Kebangsaan Malaysia Locked Bag 1200, Ayer Keroh, 75450 Melaka.
Tel / Fax: 06-2332421
Email: [email protected] / [email protected]
ABSTRACT
Over time, the pattern of economic competitiveness has changed globally. Many countries have joined the global economic competition to capture global market in order to remain profitable and competitive by increasing its productivity. There are many factors that influence the productivity of a manufacturing organisation. The most widely tackled issue is how to improve efficiency and productivity. Motion and time study technique is one of the productivity improvement techniques used in many manufacturing companies. Motion and time study is defined as a scientific analysis method designed to determine the best way to execute the repetitive task and to measure the time spent by an average worker to complete a given task in a fixed workplace. Motion and time study offers real challenges in organization involving competent engineers, business administrators, industrial relations personnel, especially trained supervisors, and psychologists. The purpose of this paper is to discuss related issues of motion and time study implementation and its influence toward productivity improvement. Data from a study carried out on a sample of manufacturing industries in Melaka shows that motion and time study implementation contributes positively towards achieving productivity.
KEYWORDS: Productivity Improvement, Motion and Time Study, and Manufacturing Organizations.
INTRODUCTION
Malaysia's manufacturing sector, which accounts for approximately 80% of exports and a third of gross domestic product, is officially projected to grow 10.2% in 2004 due to robust demand for electronics exports following the rebound in the global electronics markets (Cheong, 2004). However, there are fears that a managed economic slowdown in China could crimp Malaysia's export performance as China buys close to a tenth of Malaysia's exports. However, the Federation of Malaysian Manufacturers (FMM) rebuts this as it expects Malaysian manufacturers to step up exports to the Southeast Asian nations. Exports to fellow ASEAN members form about 27% of Malaysia's exports and FMM expects it to rise to 40%-50% in five years.
The emphasis on product quality, innovative designs, competitive pricing and efficient delivery continues to be important. The manufacturing sector is facing the challenges of technological advancement and the continuing need to move towards higher added value (Mah Lok Abdullah et al, 2003) and these are driven by: (1) Technological advances in Information and Communication; (2) The demand for knowledge workers to improve productivity. Development of the knowledge-based economy will contribute towards broadening the economic base with the shift of the production possibility frontier. They include the continuing investment in technology, innovation, management best practices, high specialization, as well as workers education, skills and experience.
National Conference on Management of Technology and Technology Entrepreneurship (MOTTE 2005) 31st May - 2nd June 2005
The manufacturing sector needs to improve productivity through upgrading of its primary production technology. Technology can help to improve overall productivity in different ways through the reduction in production cycle time and costs and better production and process control. Manufacturing firms must achieve a degree of innovative capability in managing production operations, processes and capital equipment. They need to develop and adopt good management systems and practices such as Motion and Time Study, Total Productivity Maintenance, Total Quality Management, Just-In-Time Methodology, Supply Chain Management, etc.
This paper reports the main findings of a study of productivity improvement through motion and time study approach in a sample of Melaka manufacturing companies’. This study included extensive debriefings and data analysis to characterize sources of variability.
THE IMPORTANCE OF PRODUCTIVITY IMPROVEMENT
The only way a business or enterprise can grow and increase its profitability is by increasing productivity in all aspects of a business or industry including sales, finance, production, engineering, cost, maintenance, and management (Niebel, 1988). Important as the production function is, it should be remembered that other aspects of the enterprise also contribute substantially to the cost of operation and are equally valid areas for the application of the cost of improvement techniques.
According to Atkinson et al (1995) and Krajewski and Ritzman (1998), productivity is the value of outputs (goods or services) produced divided by the values of input resources (wages cost of equipment and the like) used:
Based on Barnes (1980), productivity is a term that has number of different meanings although it is most commonly associated with labor effectiveness in industry. In a broad sense productivity is the ratio of output to some or all of the resources used to produce the output. Labour productivity may be defined as “output per unit of time” or “output per labour hour”.
Labour productivity = units produced ÷ hours worked Capital productivity = output ÷ capital input
Material productivity = output ÷ material input
Operation managers play a key role in detemining productivity. Their challenge is to increase the value of output relative to the cost of input. If they can generate more output or output of better quality using the same amount of input, productivity increases (Krajewski and Ritzman, 1998). If they can maintain the same level of output while reducing the use of resources, productivity also increases. To profit from productivity improvement, management needs measurement procedures for monitoring productivity performance and identifying improvement opportunities (Miller, 1984).
MOTION AND TIME STUDY
The terms time study and motion study have been given many interpretations since their origin. Time study, originated by Taylor, was used mainly for determining time standards, motion study, developed by the Gilbreths, was employed largely for the same time, in the early days greater use was made of time study and wage incentive than motion study (Barnes, 1980). It was not until 1930s that a general movement got under way to study work with the objective of finding better and simpler methods of getting job done. Then there followed a period during which motion study and time study were used together, the two supplementing each other, and the combined term motion and time study came into use. The purpose of the motion and time study is to improve the effectiveness and the productivity of the work place.
Motion and time study offer real challenges. Industries with the competent engineers, business administrators, industrial relations personnel, specially trained supervisors, and psychologists carrying out motion and time study techniques are inevitably better able to meet competition and better equipped to operate profitably (Niebel, 1988).
According to Barnes (1980), motion and time study is the systematic study of work systems with the purposes of (1) developing the preferred system and method-usually the one with the lowest cost; (2) standardizing this system and method; (3) determining the time required by a qualified and properly trained person working at a normal pace to do a specific task or operation; and (4) assisting in training the worker in the preferred method. Motion and time study is composed of four parts:
1.Developing the Preferred Method / Work Methods Design. In the broadest sense, every business and industrial organisation is concerned with the creation of goods and services in some form utilizing workers, machines, and materials. In a manufacturing plant, for example, the production process might include the procurement of the raw materials, the machining and fabrication of the part, and the delivery of the finished product. In designing such a manufacturing process, consideration would be given to the entire system and to each individual operation which would go to make up the system or process. The design of such a process employs the general problem-solving procedure such as the systematic approach, scientific method, or engineering approach. Method design therefore begins with the consideration of the purpose or goal to manufacture a specific product, to operate a cash-and-carry cleaning and pressing establishment, or to produce milk on a dairy farm. The objective is to design a system, a sequence of operations and procedures that make up the preferred solution.
2.Standardizing the Operation / Written Standard Practice. After the best method for doing the work has been determined, this should be standardized. Ordinarily, the work is broken down into specific jobs or operations which are described in detail. The particular set of motion, the size, shape, and quality of material, the particular tools, jigs, fixtures, gauges, and the machine or piece of equipment should be definitely specified. All these factors, as well as the conditions surrounding the worker, must be maintained after they have been standardized. A written standard practice giving a detailed record of the operation and specifications for performing the work is the most common way of preserving the standard. A job is not measured until it has been defined.
work, for cost estimating, or for labor cost control, or it may serve as the basis for a wage incentive plan. Although standard data, predetermined time systems, and work sampling are widely used for establishing time standards, perhaps the most common methods of measuring work is stop-watch time study or electronic time study. The operation to be studied is divided into small elements, each of which is timed with a stop watch. A selected or representative time value is found for each of these elements, and the times are added together to get the total selected time for performing the operation. The speed exhibited by the operator during the time study is rated or evaluated by the time study observer, and the selected time is adjusted by this rating factor so that a qualified operator, working at a normal pace, can easily do the work in the specified time. This adjusted time is called the normal time. To this normal time are added allowances for personal time, fatigue, and delay, the result being the standard time for the task.
4.Training the Operator. A carefully developed method of doing work is of little value unless it can be put into effect. It is necessary to train the operator to perform the work in the prescribed manner. Where but one or a few persons are employed on a given operation and where the work is relatively simple, it is customary to train the operator at the work place. The supervisor, the motion and time study analyst, a special instructor, or a skilled operator may act as the teacher. In most cases it is the supervisor who is responsible for training the operator, and the supervisor often depends upon the methods and standards department for assistance in this task. The written standard practice or the element breakdown sheet is a valuable aid to the supervisor in job training. When large numbers of employees must be trained for a single operation; the training is sometimes carried on in a separate training department. Charts, demonstration units, and motion pictures are frequently used to advantage in such a training program.
MOTION AND TIME STUDY AND PRODUCTIVITY
RESEARCH OBJECTIVES
The research was carried out in order to fulfil the following research objective:
i. Evaluate the level of awareness of the Motion and Time Study for productivity improvement and the productivity priorities.
ii. Identify the issues related to the implementation of the Motion and Time Study for productivity improvement.
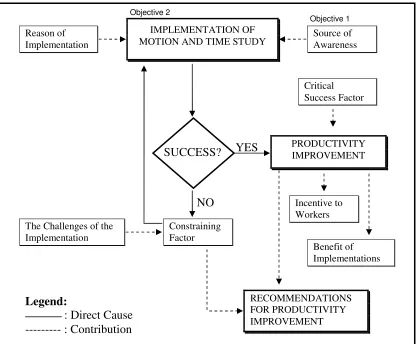
Figure 1 shows the research framework used. First of all, the research evaluate the level of motion and time study awareness and productivity priorities among the respondents. Thus, this research identified the issues related to the implementation of motion and time study including reason of implementation, challenges, success factor etc.
Figure 1: Research Framework
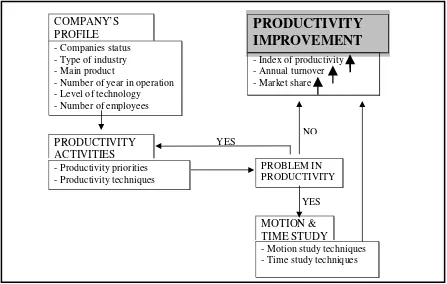
Model of productivity improvement through motion and time study is shown in Figure 2. The research carried out the productivity activities including productivity techniques and the priorities by companies profile through the problem in productivity and the issues. This research suggest the motion and time study technique for productivity improvement. Productivity improvement measured by the increasing of the index of producitivty, annual turnover and market share.
Reason of Implementation
Source of Awareness IMPLEMENTATION OF
MOTION AND TIME STUDY
Benefit of Implementations Constraining
Factor
Critical Success Factor
PRODUCTIVITY IMPROVEMENT
The Challenges of the Implementation
RECOMMENDATIONS FOR PRODUCTIVITY IMPROVEMENT
Incentive to Workers
Objective 1 Objective 2
NO
YES
Legend:
: Direct Cause --- : Contribution
Figure 2: Model of Productivity Improvement through Motion and Time Study
DATA GATHERING
This study has focused on the companies involved in manufacturing activities and operating in Melaka. This study was undertaken by semi-structured interviews and questionnaire survey. The respondents of this survey include the middle managers, operation executives and senior managers. Samples were chosen from a list of companies in MITC (Melaka International Trade Centre) directory.
RESULTS AND DISCUSSION
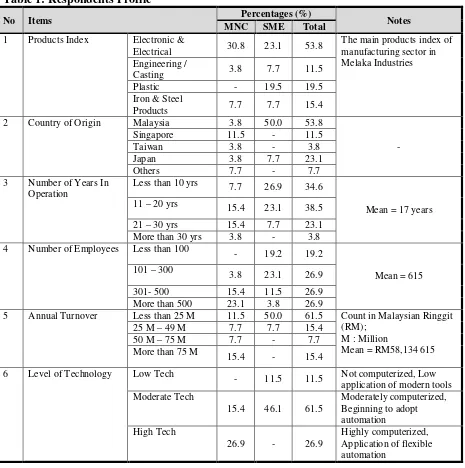
Table 1 shows the main features of the respondents. In term of the type of manufacturing activities, the majority of the companies are involved in electrical and electronic industry. This is followed by those involved in manufacturing plastic products. The majority of the respondents are Malaysian based companies. Among the foreign-owned companies, the Japanese firms appear to have significant presence.
Most of companies (about 65%) appear to be mature, with more than 10 years in operation. Generally the respondents claim to have a moderate level of technology in place. The higher level of technological applications resides within the multinational companies.
COMPANY’S PROFILE
PRODUCTIVITY ACTIVITIES
- Companies status - Type of industry - Main product
- Number of year in operation - Level of technology - Number of employees
- Productivity priorities - Productivity techniques
MOTION & TIME STUDY
PROBLEM IN PRODUCTIVITY
- Motion study techniques - Time study techniques
YES YES
NO
PRODUCTIVITY
IMPROVEMENT
Table 1: Respondents Profile
No Items Percentages (%) Notes
MNC SME Total
1 Products Index Electronic &
Electrical 30.8 23.1 53.8 utilization (12.1 percent), workforces (11.1 percent), and flexibility (4.7 percent). Besides that, one of the respondents company was focused on innovative products as one of productivity priorities in their company. The score in Table 2 was counted by cumulative score base on respondent answers in questionnaire survey. The higher score shows the most priorities of productivity by Respondents Company. By the way, as can be seen in Table 2, it is easier to show the priorities of productivity by ranking.
Table 2: Productivity Priorities
No Item Score Percent (%) Ranking
1 Productions 150 20.6 2
2 Cost 114 15.7 3
3 Time 101 13.9 4
4 Workforces 81 11.1 6
5 Machine Utilization 88 12.1 5
6 Quality 160 22.0 1
7 Flexibility 34 4.7 7
N= 26
Score = Cumulative of rating score by respondent base on the productivity priorities Percent (%) =
b. Productivity Techniques
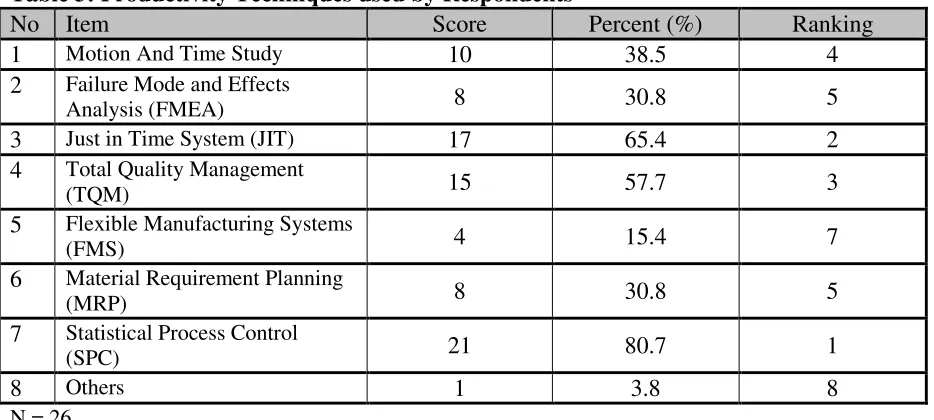
Table 3 shows the productivity techniques used by respondents. The companies mainly use Statistical Process Control (25.0 percent), Just in Time techniques (20.2 percent) and Total Quality Management(17.9 percent). Besides that, Motion and Time Study technique is ranked number 4 (12.9 percent), followed by FMEA (9.4 percent), MRP (9.4 percent) and the others (1.2 percent). The other techniques are Total Productivity Management (TPM), Quality Function Deployment (QFD) and Six Sigma Approach.
Base on the interview, the multinational companies implement their productivity techniques through the parent companies. The major factor affecting the implementation includes factory facilities, investment capital, experience employee etc. The production and operation activities in respondent companies are responsible to top management. Any decision of top management will change the productivity techniques used.
Table 3: Productivity Techniques used by Respondents
No Item Score Percent (%) Ranking
1 Motion And Time Study 10 38.5 4 2 Failure Mode and Effects
Analysis (FMEA) 8 30.8 5
3 Just in Time System (JIT) 17 65.4 2 4 Total Quality Management
(TQM) 15 57.7 3
5 Flexible Manufacturing Systems
(FMS) 4 15.4 7
6 Material Requirement Planning
(MRP) 8 30.8 5
7 Statistical Process Control
(SPC) 21 80.7 1
8 Others 1 3.8 8
N = 26
Score = numbers of respondents whose implement the techniques listed above. Score
c. Productivity Measurement and Index of Productivity
Based on the questionnaire survey and interview, the respondent companies have their own productivity measurements and almost all of them do not use index of productivity. This is because, the Japanese companies especially used their own term of productivity measurement techniques. For all respondents, fulfilling the customer demand is very important compared to measures or something else which are not easy to implement. Unfortunately, the many respondents are not specify the measurement techniques used because of the confidently policy.
d. Productivity Issues
All the respondents faced many problems in improving productivity in their companies. There are many factors that contribute to the problem. The problems are:
(1) Inconsistent production volume, (2) High operator turnover,
(3) Resource constraint, and (4) Workers’ skill and attitude.
e. Level of Motion and Time Study Awareness
9
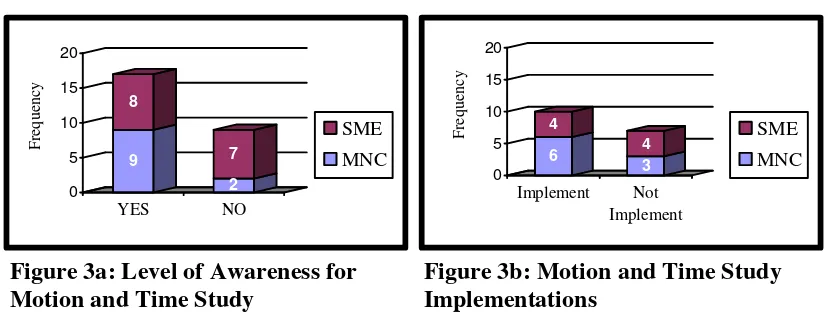
According to the Figure 3a, the level of awareness for motion and time study is “high”. It can be seen from Figure 3a, out of a total 26 respondents, 65.4 percent of them are aware about motion and time study compared 34.6 percent of them not aware of motion and time study as a technique for productivity improvement. The figure shows that almost of all MNC are aware about motion and time study compared to SME.
Figure 3b shows the motion and time study implementation of the respondents. From the figure, only 58.8 percent out of a total 17 respondents (which are aware of the motion and time study) implement motion and time study. MNC (35.3 percent) implement more compared to SME (23.5 percent). By the way, we can conclude that the level of implementation motion and time study among the respondents is still ‘Low’. This is because, only 38.5 percent of respondents implement motion and time study technique compared to other techniques (refer Table 3).
Figure 3a: Level of Awareness for Motion and Time Study
f. The Sources of Awareness
Government Agencies
0.0% Customer
22.0% Suppliers
20.3% Competitors
8.5%
Consultants 22.0%
Academic Literatures
16.9%
Internet / Mass Media
10.2%
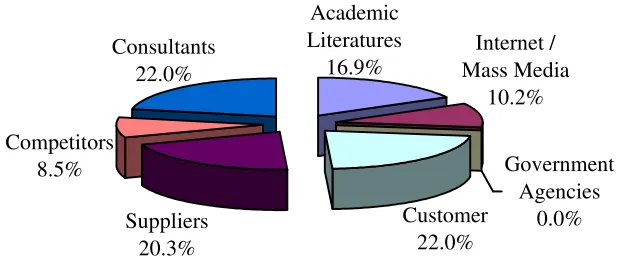
Figure 4: The Sources of Awareness for Motion and Time Study
Figure 5 shows the sources of awareness for motion and time study. As can be seen in the Pie Chart above, the main sources of awareness are customer and consultants. It was followed by suppliers (20.3 percent), academic literatures (16.9 percent), internet / mass media (10.2 percent) and competitors (8.5 percent). Unfortunately, there was no indication of sources of awareness for motion and time study technique from government agencies.
g. Focus of implementation / person in charge / year of implementation
Base on interview and questionnaire survey, the main focus of implementing motion and time study include reduce the time of unnecessary movement, as a way of job monitoring and productivity improvement. Person in charge in the implementation usually are senior manager and operation manager or production manager. The implementations depend on the operation activities, scope of implementation and the procedure. The mean of year of implementation motion and time study is 4.5 years.
h. Purpose of Implementation
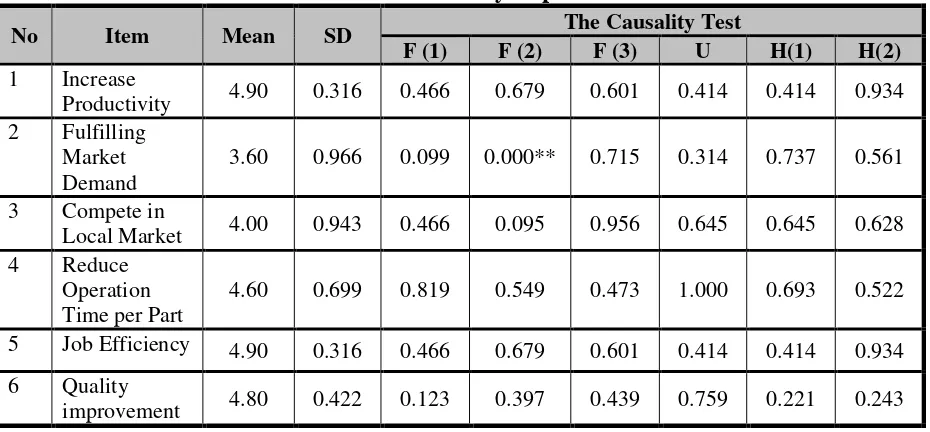
As can be seen in the Table 4, there are six main reasons of motion and time study implementation. Base on the mean of agreement score (see Table 4), it is clear that all of the reasons listed in questionnaire survey are agreed by the respondent with the higher score. Increase productivity (4.90), job efficiency (4.90) and quality improvement (4.80) are mainly the reasons of the implementation motion and time study rather than reduce operation time per part (4.60) compete in local market (4.00) and fulfilling market demand (3.60). This is because, the mean score of the reasons considering that respondent strongly agreed. Beside that, the other reason of the implementation of motion and time study are improve skill of workforces, improve the old systems of productivity improvement and efficiency of job monitoring systems.
Table 4: The Reason for Motion and Time Study Implementations
No Item Mean SD The Causality Test
F (1) F (2) F (3) U H(1) H(2)
1 Increase
Productivity 4.90 0.316 0.466 0.679 0.601 0.414 0.414 0.934 2 Fulfilling
Market Demand
3.60 0.966 0.099 0.000** 0.715 0.314 0.737 0.561
3 Compete in
Local Market 4.00 0.943 0.466 0.095 0.956 0.645 0.645 0.628 4 Reduce
Operation Time per Part
4.60 0.699 0.819 0.549 0.473 1.000 0.693 0.522
5 Job Efficiency 4.90 0.316 0.466 0.679 0.601 0.414 0.414 0.934
6 Quality
improvement 4.80 0.422 0.123 0.397 0.439 0.759 0.221 0.243 N = 10
* consider disagreed by respondents (mean 3.5). ** Significant at the 0.05 level
F (1) : F-Test between item and numbers of years in operation. F (2) : F-Test between item and numbers of employees
F (3) : F-Test between item and annual turnover U : U-Test between item and company status H (1) : H-Test between item and level of technology H (2) : H-Test between item and types of product indexes.
i. Success Factor
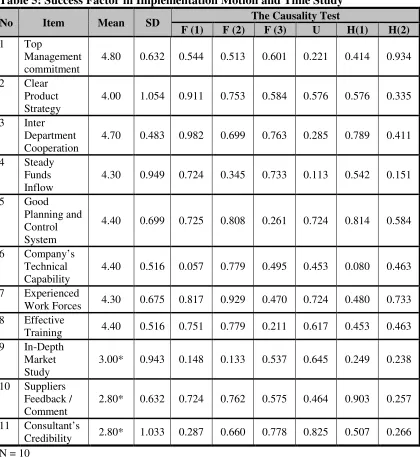
Implementation motion and time study in general increased the productivity for most of the respondents. In fact, the success of the implementation of motion and time study has being dominated by several of success factor (see Table 5). Based on the mean score of agreement of the success factor in motion and time study implementation generally show that most of the success factor listed in questionnaires survey are similar with the success factor of implementation motion and time study by respondents.
Table 5: Success Factor in Implementation Motion and Time Study
No Item Mean SD The Causality Test
F (1) F (2) F (3) U H(1) H(2)
1 Top
Management commitment
4.80 0.632 0.544 0.513 0.601 0.221 0.414 0.934
2 Clear Product Strategy
4.00 1.054 0.911 0.753 0.584 0.576 0.576 0.335
3 Inter Department Cooperation
4.70 0.483 0.982 0.699 0.763 0.285 0.789 0.411
4 Steady Funds Inflow
4.30 0.949 0.724 0.345 0.733 0.113 0.542 0.151
5 Good Planning and Control System
4.40 0.699 0.725 0.808 0.261 0.724 0.814 0.584
6 Company’s Technical Capability
4.40 0.516 0.057 0.779 0.495 0.453 0.080 0.463
7 Experienced
Work Forces 4.30 0.675 0.817 0.929 0.470 0.724 0.480 0.733 8 Effective
Training 4.40 0.516 0.751 0.779 0.211 0.617 0.453 0.463 9 In-Depth
Market Study
3.00* 0.943 0.148 0.133 0.537 0.645 0.249 0.238
10 Suppliers Feedback / Comment
2.80* 0.632 0.724 0.762 0.575 0.464 0.903 0.257
11 Consultant’s
Credibility 2.80* 1.033 0.287 0.660 0.778 0.825 0.507 0.266 N = 10
* consider disagreed by respondents (mean 3.5). ** Significant at the 0.05 level
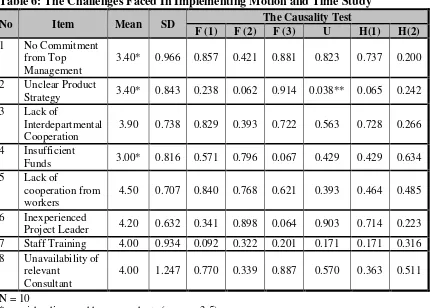
j. The Challenges
motion and time study were including the challenges listed whose disagreed by respondents. Thus, there are not become the challenges for respondents.
The results of causality tests between the challenges faced by respondent and testing variables shows that no causation. It is because, all of the significant value (refer Table 6) shows that not significant at the 0.05 level. Thus, null hypothesis was rejected and alternatives hypothesis used to show that no causation.
Table 6: The Challenges Faced In Implementing Motion and Time Study
No Item Mean SD The Causality Test
F (1) F (2) F (3) U H(1) H(2)
1 No Commitment from Top Management
3.40* 0.966 0.857 0.421 0.881 0.823 0.737 0.200
2 Unclear Product
Strategy 3.40* 0.843 0.238 0.062 0.914 0.038** 0.065 0.242 3 Lack of
Interdepartmental Cooperation
3.90 0.738 0.829 0.393 0.722 0.563 0.728 0.266
4 Insufficient
Funds 3.00* 0.816 0.571 0.796 0.067 0.429 0.429 0.634 5 Lack of
cooperation from workers
4.50 0.707 0.840 0.768 0.621 0.393 0.464 0.485
6 Inexperienced
Project Leader 4.20 0.632 0.341 0.898 0.064 0.903 0.714 0.223 7 Staff Training 4.00 0.934 0.092 0.322 0.201 0.171 0.171 0.316 8 Unavailability of
relevant Consultant
4.00 1.247 0.770 0.339 0.887 0.570 0.363 0.511
N = 10
* consider disagreed by respondents (mean 3.5). ** Significant at the 0.05 level
CONCLUSIONS
BIBLIOGRAPHY
Atkinson, A. A., R. D. Banker, R. S. Kaplan and S. M. Young. (1995). Management Accounting, Prentice Hall, England. , p. 514
Barners, R. M. (1980). Motion and Time Study-Design and Measurement of Work. Seventh Edition. John Wiley & Sons. Canada.
Cheong, P. (2004). “Manufacturing Sector to Grow 10% this Year”. [Online] Available http://www.pwcglobal.com. Date 23th August, 2004.
Krajewski, L. J. & Ritzman, L. P. (1998). Operation Management: Strategy and Analysis. Fifth Edition. Addison Wesley Longman, Inc. USA.
Mah Lok Abdullah, Andy K.H, Seo, Yong Ah Huat, Goh Swee Seang . (2003) ‘Sustaining Competitiveness of the Manufacturing Sector through Productivity Enhancement’ Petaling Jaya. August 18, 2003
Miller, D. M. (1984). “Profitability = Productivity + Price Recovery,” Harvard Business Review May-June 1984, p 145-153.