Managing Key Performance Indicators (KPIs): A Case
Study at an Aerospace Manufacturing Facility
Rohana Abdullah, Effendi Mohamad,
Mohd.Razali Muhamad
Faculty of Manufacturing Engineering,
University Teknikal Malaysia Melaka, Karung Berkunci 1200, Ayer Keroh, 75450 Melaka, Malaysia E-mails: [email protected]
ABSTRACT
Key Performance Indicators (KPIs) is a performance measurement tools that an Aerospace Manufacturing facility has decided to implement in order to remain cost competitive. Since KPIs was a new concept that the company was embracing, the challenge was on managing the KPIs throughout the entire organization. This study is focused on the planning, designing, and implementing the KPIs project. Methodologies such as the semi-structure interview, focus group discussion, benchmarking were used in order to identify the gap, prepare crucial information for the development of the KPIs and gauge KPIs knowledge level of the top management who are going to be responsible for the development and
deployment of the company’s KPIs. Results of a successful KPIs design and deployement will also be discussed in this paper.
Keywords
Performance Measurement, Key Performance Indicators, Management by Objectives, Knowledge Management
1.0 INTRODUCTION
Nowadays in the era of growing global competition, running a successful business is getting more difficult and complicated than before. In order to remain competitive, companies and organizations will need to practice management by objectives (MBO) which is a method whereby managers and employees define goals for every department, project and employees and use them to monitor subsequent performances (Daft & Marcic, 2007). This performance measurement system is capable of providing a basic comparison over the time that will be able to point out whether performance had
improved, deteriorated or simply remained static. (Theodore, 2003).
Performance measurement is not static. It will change as performance issues varies, as marketing strategy change, as technologies and the means to measure and record performance change over time (Smith, 2007).However, performance must be aligned with strategy, must have balance between qualitative and quantitative methods, have clear framework and lastly measurement as means for growth.
Key Performance Indicators (KPIs) is one of the tools for evaluating performance measurements. KPIs allow a company to see what areas it is executing well and what areas require improvement. Whatever KPIs selected must reflected the organizations goal, must be key to success, and they must be quantifiable (Bose, 2006)
This paper discusses the case study done starting from performing gap analysis on the KPIs knowledge level of the employees and preparing data for the KPIs design. Once company KPIs is designed, the KPIs were communicated and cascaded down to all levels in the organization in order to ensure alignment to company’s mission, vision, objectives and goals.
This case study is a part of Lean Manufacturing memorandum of agreement (MoU) between the university and industry. The KPIs team comprises of a project leader, a KPIs coordinator and two success or compliance. Bury (2005), believed that KPIs through the definition and measurement of progress; help organizations achieve their goals. Moore (2004) also described the term KPIs as performance targets given to individuals or organizations indicating how performance will be measured, and the target must adapt to meet business situations.
Haque & Moore (2004) stated that the feedbacks gained from the performance measurement results will be attended to and simultaneously, the indicators are required to assess achievement. With good KPIs as one of the performance measurement tool, companies or organizations can be confident with their manufacturing tools and techniques implementation for achieving their goals and objectives. Hence, good KPIs must be clear and able to measure specific aim.
2.1 Benefits of KPIs
Why do organizations currently choose KPIs? Waters & Bevan (2005) explained that organizations opted for KPIs in order to reduce development timescales and cost, and also to use its highly skilled people effectively. Bose (2006) mentioned that KPIs allow the organization to see what areas it is executing well and what areas require improvement. Toni et.al (1997) stated that the identification of appropriate KPIs as well as aligning them with company strategies can become the key to realizing bottom line impacts
2.1.1 Criteria required in KPIs
Joyce & Woods (2001) stated that good performance indicators must consider:
i. Long term and short term linkage to traditional measures of profitability, return to capital employed, earnings per share, etc.
ii. Balance between Financial and non financial factors.
iii. Strategic aims which needs to. be translated into critical success factors.
2.1.2 Efficiency and effectiveness concerning the ratio of outputs relative to inputs.
2.1.3 Criteria required in KPIs
Brown et.al (2006) defined the importance of KPIs in the aspect of quality, cost, delivery and safety. With KPIs measures in a company will be kept simple and data must be kept updated so that the operators can easily judge their quality performance and rapidly generate problem solving measures when problem arises. Three measures normally used as quality indicators are Defect Per Unit (DPU), First Time Yield (FTY) and Overall Equipment Efficiency (OEE). In measuring cost, key indicators are productivity (most effective indicator of value added activities), scrap (a quality measure that will drive overall costs up or down depending on trend) and Work In Progress (WIP) (lagging measure of flow and cycle time and also as a leading measure of customer satisfaction and ultimately affecting cash flow). In delivery, examples of the key indicators are cycle time, setup and change over time. Last but not least, safety cross has also been introduced as indicator for providing simple visual communications to the work area for safety awareness.
2.1.4 Steps to Develop KPIs
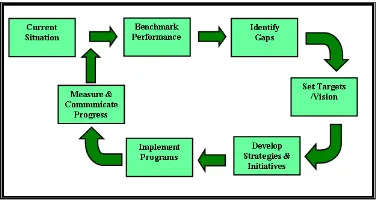
Figure 1: The process of developing relevant KPIs (Davidson, 2006)
3.0 CASE STUDY
In managing the KPIs project, at the company, four critical stages were involved which were planning, designing, implementing and measuring the effectiveness for continuous improvement. This paper will discuss the first three stages of the implementation since the company is currently in the process of measuring the company performance to the set KPIs.
3.1 KPIs Planning
The case study planning stage involved performing the gap analysis on the company performance and KPIs knowledge and awareness at various levels of the company. This information was required in order to design a comprehensive KPIs workshop and to assist the development of company KPIs. Among the methodologies used during this stage were:
i. Semi structure interviews and focus discussion.
Information gathered from interviews is able to influence the decisions made by researchers (Whetten & Cameron, 2002). Thus, this technique is utilized in order to provide better understanding on the knowledge level of the employees especially the top and middle management teams
Through focus group discussion (Morgan, 1990) with the General Managers and 10 top managers from all the departments in the company such as engineering, manufacturing, human resource, finance, warehouse, logistics and lean office, information regarding existing company business strategy and the alignment to company’s mission, vision, goals and objectives were gathered.
Based on the semi-structure interviews and focus group discussions, the KPIs team found that the KPIs knowledge and awareness was still low even at the top management level. The company promoted the principles of Quality, Cost, Delivery, Accountability and Continuous Improvement (QCDAC) and had project teams consisting of the operators to focus on these principles. However, QCDAC was not aligned to any company strategies. Thus, the KPIs team proposal was accepted by the management to apply the existing principles of QCDAC during the designing of the KPIs.
ii. Benchmarking
Spendolini (1992) and Czuchry et.al (1995) had considered benchmarking as one of the effective tools of transferring knowledge and innovation into an organization. Parallel to the semi-structure interviews and focus group discussion, the team’s challenge was to find a competitor to use their performance as the benchmark. However, this information was not available thus the KPIs team with management consent decided apply Generic benchmarking (Bhutta & Huq, 1999) or benchmarking a non-competitor government linked company (GLC) who was able to turn around it’s company’s performances with the KPIs implementation. The benchmarked
company’s KPIs implementation model was
decided to be used for the aerospace manufacturing facility KPIs implementation. Figure 2 shows the benchmarked KPIs implementation process flow.
Figure 2: Benchmarked company KPIs implementation framework
iii. Company Productivity Assessment System (COMPASS) Analysis
Another aspect which the KPIs team had to look into was the preparation of the data for the company’s KPIs development based on the set criteria mentioned in the literature review. Thus, the top management needed to be trained on how to translate finance data into productivity information.
The KPIs team organized a one-day workshop attended by the company’s top management and the KPIs team called “Creating Value Though Productivity Analysis at Firm Level’ conducted by the Malaysian National Productivity Corporation (NPC) experts (NPC, 2006). Participants were taught on how to use COMPASS, a Microsoft Excel-based software system developed by the NPC to translate. financial data like cost of sales, operating expenses and employee salaries into productivity information such as the total output per employee, added value per fixed assets and fixed assets per employee.
After the workshop, the KPIs coordinator performed a COMPASS productivity analysis based on the previous year financial data and the result was reviewed by the Finance manager. The report was to be presented during the management business strategy workshop where the company KPIs will be designed.
3.2 KPIs Design
After an extensive preparation and careful planning, a 2-days business strategy workshop was held in a hotel attended by all the top management of the company and facilitated by the KPIs team. The first day of the workshop covered the KPIs awareness training and the
keynote speaker talk delivered by a senior manager of the company which KPIs process was taken. The second half of the first day was filled with the presentation on the company’s strategy, gap analysis and COMPASS productivity analysis results.
During the second day of the workshop, the management team had a brainstorming session using materials presented on the first day to develop the company KPIs utilizing the established principles of Quality, Cost, Delivery, Accountability and Continuous Improvement (QCDAC). Next, they were divided into groups such as manufacturing, engineering, finance and logistics to start developing their department KPIs. Each group had to present the KPIs in order to ensure that alignment to the company’s KPIs and the objectives and targets are Specific, Measurable, Achievable, Realistic and Time-based (SMART).
The plant wide KPIs implementation plan was also developed and commitment from the top management to cascade down the KPIs knowledge and awareness to all levels in the organization was formalized through a simple ceremony.
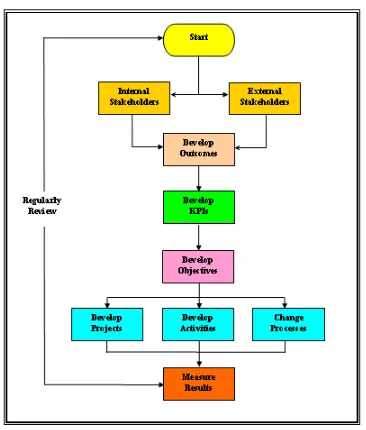
Figure 3: Business Strategy Workshop: KPIs Outcomes
3.3 KPIs Implementation
the organizations. Some employees such as the engineers will have to develop individual KPIs linking to the department KPIs and employees such as the operators with common job functions will have a group KPIs.
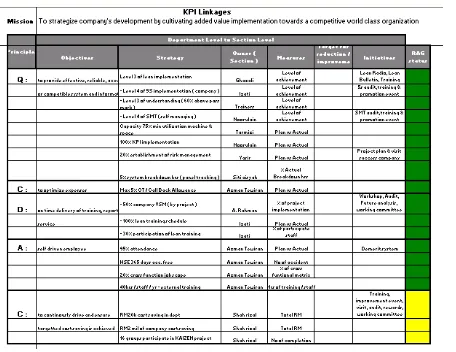
To date, the KPIs have been deployed at all levels in the organization and the KPIs coordinator is responsible for the tracking and the preparing of KPIs analysis for the top management. Red, Amber, Green (RAG) status were utilized to identify stages of implementation.
Figure 4: Red, Amber, Green (RAG) status of department KPIs implementation
4.0 CONCLUSIONS AND FURTHER
STUDIES
KPIs have benefited the company and provided the management with the Management by Objective (MBO) tool to evaluate the employee’s performance. With the performance measurements based on QCDAC principles, the company is now able to identify the areas of strength and focus on opportunities for improvement. Most importantly, the KPIs reflect the company’s mission, vision, objectives and goal which are key imperatives to the company’s success.
Although the planning, designing and implementation stage was successfully done, this project is far from complete. The next challenges are on measuring the KPIs effectiveness while improving the manual KPIs tracking. Currently, a quarterly review business strategy session was held to discuss the KPIs results. The company is also starting to incorporate the employee’s KPIs
employee’s performance is now able to be measured objectively thus improving their morale and motivation.
For further improvement of the KPIs implementation program in the company, the team is currently working on the development of the KPIs online tracking system using the company’s intranet system.
REFERENCES
Daft, R.L., Marcic, D. (2007). Management: The New Workplace: Thompson Higher
Education, 167.
Theodore, H. P. (2003). Measuring Performance in Public and None Profit Organizations: San Francisco, Jossey-Bass.
Bose, R. (2006). Understanding Data Systems For Enterprise Performance Management, Industrial Management and Data Systems. Vol. 106, No.1, 43-59.
Nonaka, I., Takeuchi, H. (1995). Knowledge Management,
http://en.wikipedia.org/wiki/knowledge_man agement. 15 Feb 2008.
Bury, J. (2005). Defining Key Performance Indicators, Best of Web Analytics Guide (12 times less Articles & Insights from Marketing Experts; Available online on
www.webtrends.com 4 May 2007
Moore, J. (2004). Real Time Performance Management: Critical to Long Term Success, Food Engineering. Business News
Publishing Company.
Hague, B., Moore, M.J. (2004). Measures of Performance of Lean Product Introduction in the Aerospace Industry. Institution of Mechanical Engineers. Vol 218.Part B.1387-1398.
Waters, M., Bevan, .J. (2005). Journey To Lean. IEE Engineering Management. Aug & Sept 2005. 10-13
Waters, M., Bevan, .J. (2005). Journey To Lean. IEE Engineering Management. Aug & Sept 2005. 10-13
Toni, A.D., Nassimbeni, G. and Tonchia, S. (1997). An Integrated Production
Performance Measurement System. Industrial Management and Data Systems. Vol.97.No 5. 180-186.
Joyce, P. Woods, A. (2001). Strategic Management: A Fresh Approach to
Brown, C.B., Collins, T.R., McCombs E.L. (2006). Transformation from Batch to Lean Manufacturing: The Performance Issues. Engineering Management Journal. Vol 8. No.2.3-13
Davidson, J. (2006). Measurement Snapshot Strategies to Measure Effectiveness: Designing Relevant Key Performance Indicators. Knowledge Management Review. Vol 9. Issue 1.6-7.
Whetten, D.A., Cameron, C.R. (2002). Developing Management Skills. Prentice Hall. 5th Edition.
Morgan, D.L. (1990). Focus Group as Qualitative Research. Sage Publications. New Bury Park, C.A.
Morgan, D.L. (1990). Focus Group as Qualitative Research. Sage Publications. New Bury Park, C.A.
Spendolini, M.J. (1992). The Benchmarking Book. Amacom. New York, NY.
Spendolini, M.J. (1992). The Benchmarking Book. Amacom. New York, NY.
Czuchry, A.J., Yasin, M.M., Dorsh, J.J (1995). A Review of Benchmarking Literature: A Proposed Model for Implementation. Introduction Journal of Material & Product Technology. Vol 10. No ½. 27-45
Bhutta, K.S., Huq, F. (1999). Benchmarking- Best Practices: An Integrated Approach. An International Journal. Vol 6.No.3.254-268 National Productivity Corporation (NPC) (2006).