Connectivity Problem of Wildlife Conservation in Sumatra:
A Graph Theory Application
Farida Hanum
1Nur Wahyuni
2Toni Bakhtiar
3Department of Mathematics, Bogor Agricultural University (IPB),
Jl. Meranti, Kampus IPB Darmaga, Bogor 16680, Indonesia
1
[email protected],
2[email protected],
3[email protected]
ABSTRACT
In this paper, the problem of connectivity of patchy conservation sites was approached by the use of graph theory. Determination of the so-called core sites was subsequently conducted by establishing the cover areas formulated in the framework of integer linear programming, connecting the unconnected cover areas by application of Dijkstra algorithm and heuristically pruning the unused covers to secure the minimum connected cover ar-eas. An illustrative example of this method describes the wildlife conservation in Sumatra. The connectivity problem of20districts in3provinces of Jambi, Riau and West Sumatra inhabited by10species of wildlife were considered.
Keywords:Connectivity problem, covering-connecting-pruning, Dijkstra algorithm, wildlife conservation, Sumatra.
2010 Mathematics Subject Classification:05C90, 92D40.
1
Introduction
Connectivity of networks is one of the most fundamental and useful notions for analyzing var-ious types of network problems and now is phrased in metapopulation theory. Connectivity in conservation biology can be defined as the degree to which organisms can move through the landscape, commonly measured either by dispersal rate or dispersal probability. In other words, connectivity can be viewed as a problem of connecting territories of great biological importance, i.e., corridors creation problem. At intermediate time scales connectivity affects migration and persistence of metapopulations (Ferreras, 2001) and at the largest time scales it influences the ability of species to expand or alter their range in response to climate change (Opdam and Wascher, 2004). Habitat connectivity is especially important when habitat is rare, fragmented, or otherwise widely distributed and can be a critical component of reserve design (Minor and Urban, 2008).
Researches on the connectivity problem are some. (Gurrutxagaet al., 2011) studied the con-nectivity of protected area networks based on key elements located in strategic positions within the landscape. Recent methodological developments, deriving from the probability of connec-tivity index, was applied to evaluate the role of both individual protected areas and links in the
ISSN 0973-1385 (Print), ISSN 0973-7537 (Online) Copyright © 2014, CESER Publications
intermediate landscape matrix as providers of connectivity between the rest of the sites in the network. (Minor and Urban, 2008) used graph theory to characterize multiple aspects of land-scape connectivity in a songbirds habitat network in the North Carolina Piedmont. (Pascual-Hortal and Saura, 2008) systematically compared a set of ten graph-based connectivity in-dices, evaluating their reaction to different types of change that can occur in the landscape and their effectiveness and proposed a new index that achieves all the properties of an ideal index. Mathematical formulations and solution techniques for a variant of the connected sub-graph problem in wildlife conservation subject to a budget constraint on the total cost was investigated by (Dilkina and Gomes, 2010). Several mixed-integer formulations for enforcing the subgraph connectivity requirement were proposed. A paper by (Nagamochi, 2004) surveys the recent progress on the graph algorithms for solving network connectivity problems. One discussed the optimization strategy of network connection is (Lu, 2013). A review on recent applications of graph model and network theory to habitat patches in landscape mosaics is provided by (Urbanet al., 2009). A book that focuses on practical approaches, concepts, and tools to model and conserve wildlife in large landscapes is (Millspaugh and Thompson, 2009).
The current paper describes the application of graph theory in connectivity problem of wildlife conservation. We consider the problem of determining the minimum connected core sites in Sumatra, where 10species of wildlife inhabited in 20 districts in Jambi, Riau and West Sumatra provinces are considered. We shall follow the approach developed by (Cerdeiraet al., 2005), where the minimum connected cover areas were determined by using integer linear programming, Dijkstra algorithm and heuristic pruning method.
2
Graph Model of Connectivity Problem
2.1
Notation
The following notation can be found in most standard textbooks on graph theory and network flows, e.g., (Ahujaet al., 1993; Diestel, 2000). GraphGis defined as an ordered pair of sets
(V, E), whereV is set ofnodesandE is a set of2-element ofV, callededges. A graph has order nif its number of nodes isn, written by|G|=n. Graphs arefiniteorinfiniteaccording to their order. A nodevisincidentwith an edgeeifv∈e. Two nodesu, vofGareadjacent, orneighbors, if(u, v)is an edge ofG. It is denoted byA(v)the set of all adjacent nodes of
v.Directed graphis an ordered pair of sets(V,E˜), whereV is set of nodes andE˜ is a set of ordered pairs of two nodes. A graphG′= (
V′
, E′)is said to be a subgraph of graph
G= (V, E)
ifV′⊆
V andE′⊆
E.Multigraphis a graph where multiple edges between the two nodes are allowed, e.g., set of edgesEbecomes a multiset.Weighted graphis a graph where each edge is bound with a certain value, calledweights. Those weights can be costs, profits, lengths of the edges etc. Apathin a graph is a sequence of distinct vertices(v1, v2, . . . , vn), such that
(vi−1, vi)is an edge, for alli = 2, . . . , n. Thelengthof a path is the number of edges in the
Let suppose V := {1,2, . . . , n} and C := {C1, C2, . . . , Ck}, where Ci ⊆ V for i ∈ I :=
{1,2, . . . , k}. SetsCi, wherei∈I∗⊆I, arecoversof setV if they satisfy
i∈I∗
Ci=V. (2.1)
If, for instance, V = {a, b, c, d, e, f, g} and C = {C1, . . . , C5}, whereC1 = {a, b, g},C2 = {a, c, g},C3={b, e, g},C4={d, e, f}andC5={a, c, f}, then{C1, C4, C5}is one of covers of V sinceC1∪C4∪C5=V as required by (2.1). Suppose that a weightwi>0is attached to
eachCi. Theset covering problemis a problem of determining covers with minimum weight, and can be formulated as a linear programming:
min
k
i=1
wixi s.t.
k
i=1
aijxi≥1, j= 1, . . . , n, (2.2)
wherexi = 1ifCi is a cover ofV fori = 1, . . . , k, otherwisexi = 0and aij = 1ifi ∈Ci,
otherwiseaij= 0. Herendenotes the number of elements inV. If we setwi= 1 (i= 1, . . . , k),
the minimum covering set forV of previous example is{C3, C4, C5}with minimum weight3.
Connectivity problem of wildlife conservation, which involves a number of conservation sites and wildlife species, can be loosely defined as a problem of selecting a fewest number of connected sites that cover all species.
2.2
Graph Model
Consider a wildlife conservation area which consists ofnsites. In graph theory notation, these sites are denoted by nodes and any two connected nodes are denoted by two adjacent nodes, where road connecting them is an edge. Suppose that there aremspecies inhabited in the area. Based on the work of (Cerdeiraet al., 2005), connectivity problem in the area is solved in three steps: covering, connecting and pruning.
2.2.1 Covering
Fori= 1, . . . , n, define the following binary decision variables:
xi=
1 ; if sitesiis selected
0 ; if otherwise. (2.3)
The covering problem is then aimed to minimize the number of selected sites:
min
n
i=1
wixi s.t.
i∈Kj
xi≥1, j= 1, . . . , m, (2.4)
where constraints in (2.4) ensure that each species populates at least in one selected site. HereKj(j = 1, . . . , m)denotes the set of sites where speciesj inhabited. If the optimal
2.2.2 Connecting
Connecting of unconnected covers is undertaken by transforming the representing nected graph into connected one. In this stage, the shortest path of the respecting uncon-nected graph should be sought by Dijkstra algorithm (Dijkstra, 1959). For a given source node
vsin the graph, the algorithm finds the path with lowest cost, i.e., the shortest path, between
that nodes and every other nodevi. The algorithm divides the nodes into permanently labeled and temporarily labeled nodes. The distance label to any permanent node represents the shortest distance from the source to that node. For any temporary node, the distance label is an upper bound on the shortest path distance to that node. The basic idea of the algorithm is to fan out from nodeviand permanently label nodes in the order of their distances from node
vs. Dijkstra’s algorithm will assign some initial (total) distance labeldand will try to improve
them step by step (Ahujaet al., 1993): 1. distance label of source node:d(vs) = 0. 2. for allvj∈V− {vs}dod(vj) =∞.
3. initial set of visited node:S=∅. 4. initial set of unvisited node:Q=V. 5. whileQ=∅dov∗
= minvi∈Qd(vi).
6. S=S∪ {v∗}
andQ=Q− {v∗}
.
7. for allvi∈A(v∗)do ifd(vi)> d(v∗) +ω(v∗, vi)thend(vi) =d(v∗) +ω(v∗, vi).
8. return.
Steps 1 and 2 assign to permanent label 0 for source nodevs and each other nodevj to temporary label∞. Steps 3 and 4 initially create an empty set of visited nodesSand that of unvisited nodesQconsisting of all the nodes. WhileQis not empty, Step 5 selects an element
v∗of
Qwith minimum distance. Step 6 updatesSandQwith respect tov∗. By Step 7 we
calculate the distance label for each nodeviwhich is adjacent tov∗by considering its weight ω(v∗, v
i). If a new shortest path is found, we replaced(v∗)with the new one. If the destination
node has been marked visited or if the smallest tentative distance among the nodes inQis ∞, then stop. The algorithm has finished. Select the unvisited node that is marked with the smallest tentative distance, and set it as the newv∗then go back to Step 6.
2.2.3 Pruning
In this step,Qshould be pruned to become a minimal connected cover by removing all unused nodes. The procedure consists of two step (Cerdeiraet al., 2005):
Table 1: Conservation sites.
Province Site or district
Jambi (1) Kerinci, (2) Merangin, (3) Sarolangun, (4) Batanghari, (5) Muarojambi, (6) Tanjungjabung Timur, (7) Tanjungjabung Barat, (8) Bungo, (9) Tebo Riau (10) Kampar, (11) Kuantan Singingi, (12) Indragiri Hilir, (13) Indragiri Hulu,
(14) Pelalawan
West Sumatra (15) Pesisir Selatan, (16) Solok, (17) Sawahlunto, (18) Agam, (19) Tanah Datar, (20) Padang Pariaman
(b) Pick a nodeviinQand mark all nodes adjacent tovi.
(c) Temporarily removevi and inspect remaining nodes inQ. If the set of remaining
nodes is a cover and connected graph, then permanently removeviand return to Step 1(b). Otherwise, proceed to Step 2.
2. In this step we inspect nodes ofQthat remain unchecked by Step 1 and then proceed the pruning procedure.
(a) Select an unchecked node inQand mark all adjacent nodes.
(b) Temporarily remove one marked nodevi and inspect remaining nodes inQ. If the
set of remaining nodes is a cover and its graph is connected, then permanently removevi and return to Step 2(a). Otherwise,vi cannot be removed and stop the
process.Qis minimum connected cover.
3
Connectivity Problem of Wildlife Conservation in Sumatra
To illustrate our model we consider a connectivity problem of wildlife conservation in Sumatra, Indonesia. We consider a conservation area spanned by20sites or districts in3provinces as homes for10wildlife species (thus we haven= 20andm = 10), where its map and graph representation are provided by Figure 1. The list of districts is given by Table 1 and that for species including their habitats are provided by Table 2. In the graph conservation sites are denoted by numbered nodes following Table 1. Weight between two adjacent nodes represents the distance between sites in kilometers.
To determine cover sites we solve optimization problem (2.4). Since there are10species considered then we have10constrains inside the problem. Constraint related to golden cat
(j= 5), for instance, can be expressed as follows:
i∈K5
xi≥1 ⇔ x1+x2+x15+x16+x17≥1.
Elements ofKjcan be found in the last column of Table 2. With no relative importance among sites, i.e.,wi= 1for alli= 1,2, . . . ,20, optimal solutions of the problem arexi= 1fori∈ {2,19}
andxi= 0otherwise, which mean that site2(Merangin) and site19(Tanah Datar) constitute
Table 2: Wildlife species and their habitats.
No Local Name International Name Latin Name Habitat (K)
1 Rangkong papan hombill Buceros bicornis 1,2,6,8,9,12,13,15–18
2 Harimau sumatra sumatran tiger Panthera tigris 1–8,11,13,15–20 3 Badak sumatra sumatran rhinoceros Dicerorhinus sumatrensis 1,2,5,7,15,16,17
4 Beruang madu sun bear Ursus malayanus 1–4,8,10,11,14–17,20
5 Kucing emas golden cat Profelis aurata 1,2,15,16,17
6 Siamang sumatran gibbon Symphalangus syndactylus 3,4,6,8–13,18,19
7 Kancil mouse deer Tragulus kanchil 5–14,19
8 Tapir asian tapir Tapirus indicus 1,2,5,7,10,11,13–18
9 Elang alap hawk Accipiter trivirgatus 1,2,15,16
10 Gajah sumatra sumatran elephant Elephas maximus 1,2,15,16,17
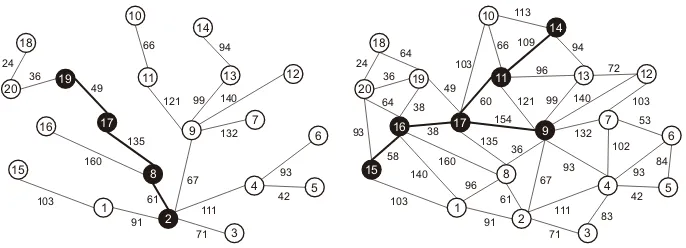
Figure 1: Conservation area and its corresponding graph.
first by seeking the shortest path in between. By applying Dijkstra algorithm we may find all the shortest paths from site2to other sites as depicted by Figure 2 (left). The shortest path between Merangin and Tanah Datar is shown by blackened path2-8-17-19with distance of245
km. In the notion of Dijkstra algorithm we haveQ={2,8,17,19}.
The last stage of the works is then to check whether the graph2-8-17-19provides a connected cover with minimum distance or not. Initial step of pruning is to identify the adjacency set of each node inQand we haveA(2) ={8},A(8) ={2,17},A(17) ={8,19}andA(19) ={17}. If we temporarily remove node2from the list then we found that the set of remaining nodes {8,17,19}is not a cover since hawk is not alive here. Thus node2is unremovable. In the second step of pruning, pick node19and temporarily remove it from the list. Since the set of remaining nodes{2,8,17}forms a cover then node19can be permanently pruned. Over the new set{2,8,17}, by removing node17we discovered that{2,8}is a cover and node17
Figure 2: The shortest path and the Steiner tree.
4
Concluding Remarks
It has been shown that covering-connecting-pruning works well in determining core sites, i.e., connected cover sites with minimum distance, of wildlife conservation area. The effectiveness of this method is worthwhile when we consider complex cases where more sites and more species considered. Another interesting look relates to spatial consideration, where we may impose the possibility selected core sites located in at least two different provinces. Note that Merangin and Bungo obtained in previous problem are both located in Jambi province. To do this we may first modify weightswiin (2.4) such that some sites are more important than
others. For example, putw9 =w14=w15 = 0andwi = 1otherwise. It means that Tebo (in
Jambi province), Pelalawan (in Riau Province) and Pesisir Selatan (in West Sumatra province) have more importance to be considered as covers. Covering by integer linear programming (2.4) in fact provides these three sites as covers. Since there are more than two nodes to be connected, we now have the so-called Steiner tree problem, i.e., to find a tree ofG= (V, E)
that spansH ⊆ V with minimum total distance on its edges. In this caseH = {9,14,15}. Figure 2 (right) depicts the Steiner tree of the problem, which can be obtained using algorithm developed by (Kouet al., 1981; Nascimentoet al., 2012). However, pruning procedure gives
11-17-16as the connected covers with minimum distance of98km along the tree. Now the core sites locate in two provinces: Kuantan Singingi in Riau; Solok and Sawahlunto in West Sumatra.
References
Ahuja, R.K., T.L. Magnanti and J.B. Orlin, 1993.Network Flows: Theory, Algorithms, and Ap-plications, New Jersey: Prentice-Hall.
Cerdeira, J.O., K.J. Gaston and L.S. Pinto, 2005. Connectivity in priority area selection for conservation,Environmental Modeling and Assessment,10: 183–192.
Dijkstra, E.W., 1959. A note on two problems in connexion with graphs,Numerische Mathe-matik,1: 269–271.
Dilkina, B. and C.P. Gomes, 2010. Solving connected subgraph problems in wildlife conserva-tion, in Integration of AI and OR techniques in constraint programming for combinatorial optimization problems,Lecture Notes in Computer Science,6140: 102–116.
Ferreras, P., 2001. Landscape structure and asymmetrical inter-patch connectivity in a metapopulation of the endangered Iberian lynx,Biological Conservation,100: 125–136. Gurrutxaga, M., L. Rubio and S. Saura, 2011. Key connectors in protected forest area networks
and the impact of highways: A transnational case study from the Cantabrian Range to the Western Alps (SW Europe),Landscape and Urban Planning,101: 310–320.
Kou, L., G. Markowsky and L. Berman, 1981. A fast algorithm for Steiner trees,Acta Informat-ica,15: 141–145.
Lu, Y., 2013. Optimization strategy of network connection based on wireless communication technology,International Journal of Applied Mathematics and Statistics,49(19): 507–520. Millspaugh, J.J. and F.R. Thompson, 2009.Model for Planning Wildlife Conservation in large
landscapes, London: Elsevier.
Minor, E.S. and D.L. Urban, 2008. A graph-theory framework for evaluating landscape connec-tivity and conservation planning,Conservation Biology,22(2): 297–307.
Nagamochi, H., 2004. Graph algorithms for network connectivity problems,Journal of the Op-erations Research Society of Japan,47(4): 199–223.
Nascimento, M.Z., V.R. Batista and W.R. Coimbra, 2012. An interactive programme for Steiner trees,arXiv,1210:7788v1, 29 October 2012.
Opdam, P. and D. Wascher, 2004. Climate change meets habitat fragmentation: linking land-scape and biogeographical scale levels in research and conservation.Biological Conser-vation,117: 285–297.
Pascual-Hortal, L. and S. Saura, 2006. Comparison and development of new graph-based landscape connectivity indices: towards the priorization of habitat patches and corridors for conservation,Landscape Ecology,21: 959–967.