AUTOMATIC ASSESSMENT OF ACQUISITION AND TRANSMISSION LOSSES IN
INDIAN REMOTE SENSING SATELLITE DATA
Deepika Roya, B. Purna Kumarib, M. Manju Sarmab, N. Aparnab, B. Gopal Krishnab
aSpace Applications Centre, Indian Space Research Organization, Ahmedabad, India – [email protected] b National Remote Sensing Centre, Indian Space Research Organization, Hyderabad, India-(purnakumari_b, manjusarma_s,
aparna_n,bgk)@nrsc.gov.in
KEY WORDS: Remote Sensing, Transmission Data Losses, Anomaly Detection, Impulse Noise, Line Losses
ABSTRACT:
The quality of Remote Sensing data is an important parameter that defines the extent of its usability in various applications. The data from Remote Sensing satellites is received as raw data frames at the ground station. This data may be corrupted with data losses due to interferences during data transmission, data acquisition and sensor anomalies. Thus it is important to assess the quality of the raw data before product generation for early anomaly detection, faster corrective actions and product rejection minimization. Manual screening of raw images is a time consuming process and not very accurate. In this paper, an automated process for identification and quantification of losses in raw data like pixel drop out, line loss and data loss due to sensor anomalies is discussed. Quality assessment of raw scenes based on these losses is also explained. This process is introduced in the data pre-processing stage and gives crucial data quality information to users at the time of browsing data for product ordering. It has also improved the product generation workflow by enabling faster and more accurate quality estimation.
1. INTRODUCTION
It is pertinent to deliver good quality remote sensing images for reliable and accurate interpretation of data for earth observation applications. Image quality determination is a part of calibration, verification and validation of remote sensing systems. Several parameters of the imaging system and data transmission conditions influence the image quality. The determination of the quality of remote sensing data can, in principle, be defined in terms of spectral, radiometric and spatial aspects. Different metrics are used to define the radiometric, geometric and performance parameters (Ralf Reulkea et al 2014). Apart from imaging system performance related aspects, Remote Sensing (RS) images are affected by different types of noise like Gaussian noise, speckle noise and impulse noise introduced during acquisition or transmission process.
Although link budget estimation is done for all satellite missions and sufficient link margin exists for satellite data transmission, losses may still occur due to disturbances in the transmission link, problems in reception chain or due to sensor anomalies. This paper describes the losses that occur in remote sensing data due to transmission and acquisition losses and sensor anomalies. An automated process to detect these losses is also explained.
National Remote Sensing Centre (NRSC), Indian Space Research Organization (ISRO), Department of Space, Government of India, is the nodal organization for acquisition and distribution of remote sensing data to user community. The quality policy of NRSC is to strive to design, develop and deliver high quality, actionable data products and value added services in a timely, cost effective and efficient manner and facilitate enhanced utilization of remote sensing and geomatics.
In order to achieve the above objectives, NRSC, as a part of inter-centre project – Integrated Multi-Mission Ground Segment for Earth Observation Satellies (IMGEOS), re-engineered all the processes involved in data planning, acquisition, processing and dissemination. This action resulted in huge improvements in the turnaround time of data acquisition to product delivery. Today,
NRSC delivers emergency products within an hour of acquisition and standard products within a day.
Before placing an order for a Remote Sensing data product, the users need to browse through the data to check for availability, cloud cover and quality of the desired data. To meet this requirement, NRSC generates sub-sampled and compressed browse images along with necessary ancillary information and presents them for data selection. In IMGEOS setup, most of the data selection, ordering, processing and dissemination related activities are automated. In this scenario it is important to ensure that all the data that are presented to the user are of good quality. The metadata presented along with the browse chips should carry accurate information about the scene quality to facilitate data selection.
Previously quality assessment of raw data was done based only on frame sync errors along with visual screening of the sub-sampled browse images. This had limitations as only one parameter was being considered for evaluating the data losses. There are various other causes for data losses which need to be assessed and which can degrade the product quality. Also during manual screening there were chances of data losses not being detected as browse images are sub-sampled up to a ratio of 1:24. Being a manual process, screening of large number of browse chips was a time consuming activity. Thus a new process was introduced in the data pre-processing chain with the aim to automate quality assessment of full resolution raw scenes and assist in quick and accurate anomaly detection and correction.
2. METHODOLOGY
which are: Pixel Drop Out due to impulse noise, Spread of Pixel Drop Out, Decoding Errors, Single and Consecutive Line losses (Frame Losses) and Dead/Frozen detectors.
2.1. Pixel Drop Out(PDO)
This type of noise is also known as impulse noise, salt and pepper noise or data drop out. Pixel Drop out (PDO) is a result of random noise in the image which causes sudden variation in brightness or color information in an image. This type of error occurs during data transmission due to low signal levels or interference in the transmission channel (Gonzalez, Woods, 2008).
The assumption in detecting PDOs is that a noise free image will contain smooth variation of intensities whereas in an image corrupted with impulse noise, the noisy pixel will have very high or very low pixel intensity as compared to its neighbors. Thus an impulse can be identified by the height of its brightness jump in comparison with the surrounding pixels (Aizenberg et method can distinguish more number of noisy pixels with fewer mistakes. Even when the noise level is as high as 60%, this method can still identify most of the noisy pixels. Though the number of missed pixels seems to be large in SODID method, they are able to locate more number of noisy pixels even at high densities.
In view of the above, impulse noise detection was done using second order derivative filter based on the Laplacian operator. The spatial filter based on Laplacian operator is most effective in highlighting intensity discontinuities in an image and deemphasizing regions with slow varying intensity levels (Gonzalez, Woods, 2008).
The Laplacian (Gonzalez, Woods, 2008) for a function f(x,y) is defined as:
∇2 ƒ= ∂2ƒ ∂2+
∂2ƒ
∂2 (1)
The second order derivative (SOD) of this function f(x,y) in x-direction is defined as:
∂2ƒ
∂2= � + , + � – , – � , (2)
Similarly in the y-direction, SOD is defined as:
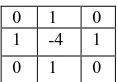
∂2ƒ derivative filter mask as shown in Figure 1.
0 1 0 1 -4 1 0 1 0
Figure 1. Second Order Derivative Filter Mask
Impulse noise detection is done by moving this spatial filter over the entire image. Impulse noise is said to be detected at a point (x,y) on which the mask is centred if the absolute value of the response of the mask at that point exceeds the specified threshold. Such points are given a value of 255 in the noise extracted image while all others are labelled as 0. Thresholds are defined based on the radiometric resolution of the sensor. So the maximum intensity value that a pixel can hold is defined as the threshold for extracting noisy pixels.
2.2. Spread of Impulse Noise
Detection of impulse noise, by itself, does not provide complete information about the quality of the image. It is important to determine the spread of the noisy pixels. If the impulse noise is concentrated within a small region of an image, rest of the image may still be usable if the user’s area of interest lies in the noise-free portion and thus may be offered to the user. If the overall noise is low and distributed, these pixels get corrected during data processing through appropriate methods of convolution. However, if the noise level is high and is distributed evenly, the image may not be usable at all. In case of emergency, where availability of data is more important than image quality, the noisy data can still provide timely information. Information on the spread of noise in image enables the user to decide the usability of the data.
2.3. Decoding Errors
The satellite data are encoded before transmission to the ground station to minimize data corruption during transmission. ISRO adopts appropriate encoding scheme depending upon the data rates, on-board compression technique used and band width. Reed-Solomon(RS) is a widely used encoding scheme for error detection and correction for Indian Remote Sensing satellites. For instance, for Resourcesat-2 satellite, Reed-Solomon encoding scheme RS (255,247) was used. This means that in a block of 255 data symbols, a maximum of 4 symbol errors can be corrected. If the number of errors is more than the correction capability of the code then the data remains uncorrected. Hence it is important to measure these uncorrectable errors and include this parameter while determining the data quality.
2.4. Frame Losses
Each frame of raw data is tagged with a frame sync sequence to mark the beginning of a frame. A bit error in the frame sync sequence indicates that the frame may not be restored correctly depending upon the encoding scheme used. The inability to restore the frame is termed as a frame loss. When the frame length equals the sensor scan line length, up to three consecutive frame losses can be corrected during data processing by approximating intensity values from neighboring lines. However, if more than three consecutive lines are lost, it leads to a blocky effect on the image. Thus this type of loss needs to be quantified.
2.5. Dead/Frozen detector detection
meaning that they may stop functioning and may give no output. In some other case, the output from a detector may be the same irrespective of the area being viewed. Such degraded detectors are known as frozen detectors (Huang,2011). These detector anomalies need to be kept track of, to take corrective action.
3. IMPLEMENTATION
The process has been implemented for Resourcesat-2 satellite, which carries LISS-III, AWIFS and LISS-IV sensors on board the case of Resourcesat-2, a 10 minutes’ satellite pass duration results in 15 GB of raw data. The threads are spawned based on the available computing power in terms of processing units available. The number of CPU/Cores available is determined during run time and the number of threads to be created is thus determined dynamically. Since the sensors are multispectral, each thread works on a single band data and after all the bands are processed completely, their results are merged and the overall scene quality is tagged by the main thread.
Pixel drop outs are assessed using second order derivative filter. The spread is estimated by keeping track of the number PDOs in each line of the raw image. A line is considered to be affected by impulse noise only if the number of PDOs in the line is greater than 0.1% of the total number pixels in a line. Frame sync losses related information is obtained from the frame synchronization and data formatting process. A track of the lines containing frame sync errors is kept and their distribution is arrived at to calculate the number of consecutive frame alerting and further monitoring the performance of the detector.
As per the current quality policy of NRSC, the following thresholds have been used for marking the scene quality as ‘Bad’ if one or more conditions are applicable to the scene.
1. PDOs are more than 0.1% of the total number of pixels in the image
2. PDO spread is more than 0.1% of total number of lines in the image or 9 lines, whichever is greater 3. Number of occurrences of consecutive line losses is
more than 3
4. RS Uncorrectable errors are more than 156 for LISS-4, 258 for LISS-3 and 768 for AWIFS
5. Line losses (single) are more than 10% of the total number of lines in the image
Based on the thresholds described above, each scene is given one of the quality scores: “Good”, “Bad” or “Fail”. “Good” means that there are no anomalies present in the entire scene. “Bad” means that one or all of the above mentioned anomalies are present in the scene. A scene is tagged as “Fail” when it has more than 90% frame sync losses, meaning that the scene is not usable.
All scenes tagged with “Good” and “Bad” quality scores are presented to the users for ordering. Thus users now have a choice to order for scenes tagged as “Bad” quality if they feel that the product can satisfy the needs of his application irrespective of its quality. The scenes marked as “Fail” are not presented to the users at all.
The scene quality parameters are populated into database along with scene definition information. This database is also accessible to many other processes like product quality check, data quality evaluation and monitoring and control systems.
4. RESULTS AND DISCUSSION
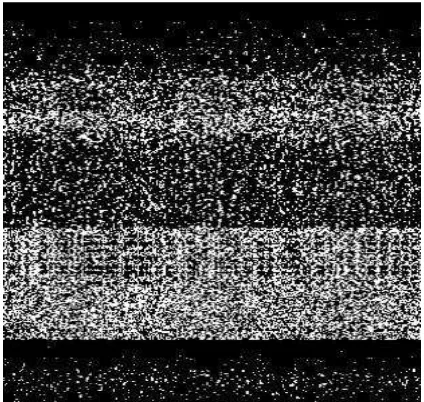
It is observed that using the above methodology, impulse noise and line losses were successfully detected. Figure 2 shows sub-sampled browse image of AWiFS data collected over parts of Oman on 27-Aug-2015 as shown on the User Order Processing System (UOPS) website of National Remote Sensing Centre (NRSC) (B.Lakshmi et al). The scene contains both PDOs and line losses. A warning about the presence of data losses beyond acceptable limits is also displayed to alert the users. Figure 3 shows the area in the inset of Figure 2 in full resolution. Figure 4 depicts the extracted losses from Figure 3 using the methodology described above.
It is observed that during detection of impulse noise, point edges are also likely to get detected. Further, Resourcesat-2 data are compressed using Differential Pulse Code Modulation (DPCM) for LISS-4 and LISS-3 sensors. The DPCM is a lossy compression and renders artefacts when images are decompressed on ground (Pushpakar et al,2013). These artefacts also get detected as spurious PDOs. Thus the impulse noise detected initially is further verified using the information about RS uncorrectable errors to ensure that there are no false hits. If the scene contains no RS uncorrectable errors it is deduced that the PDOs detected were spurious.
Presence of sun glint in AWiFS sensor, at times, also results in spurious detection of PDO in scenes collected over water bodies. Sunglint is a transient anomaly that occurs when sunlight is reflected from the seawater surface directly into the down looking optical sensor (Garaba et al, 2012). In order to eliminate this uncertainty in detecting impulse noise, sun glint was also detected using SWIR band (1.55 – 1.75 microns) data of AWiFS sensor. This is based on the assumption that the water-leaving radiance in this part of the spectrum is negligible and so any signal entering the sensor must be due to sun glint (Kay et al, 2009).
Figure 2 AWiFS image corrupted with impulse noise as shown on NRSC UOPS website with quality indication
Sensor Number of Products generated from 2012-2014
No of browse scenes marked as
Bad through
‘visual inspection’
before Product generation
Residual No of scenes rejected due to
Bad Data quality after
product generation
LISS-3 111999 217 51
AWiFS 199884 220 61
LISS-4 173092 165 59
Table 1. Number of products rejected for Resourcesat-2 during 2012-2014. Many products were rejected after manual
screening
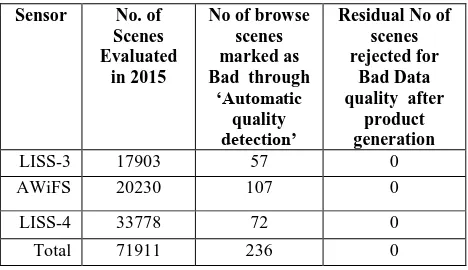
The performance of the automated process is shown in Table 2. It gives details of the number of full resolution images evaluated by this process and the number of scenes found to be corrupted due to data losses during 2015. Out of the 71911 scenes acquired, products were generated for 29974 scenes and it is observed that none of the scenes were rejected after product generation as prior information about scene quality was readily available. This illustrates the effectiveness and accuracy of the automation process which involves early alert and report mechanisms.
Table 2. Number of full resolution scenes evaluated by the automated process
The introduction of this process has automated the quality estimation of raw, full resolution scenes based on 5 quality indicators. This process has thus eliminated manual intervention in qualifying browse chips and has improved the accuracy of quality estimation. This has led to quick quality analysis thus reducing the turnaround time and quicker detection of anomalies enabling faster corrective actions and reducing the load of product generation and quality check system. This will also give better quality information of the data to the users, enabling them to order data products according to their needs.
Table 3 indicates the time taken processing scenes for each sensor for 7 minutes pass duration. This indicates that within few minutes after pre-processing, the browse scene gets tagged with its quality score. This is surely an improvement over the older process which had limitations due to the manual intervention involved.
Table 3. Time taken to evaluate the data losses
5. CONCLUSION
Automatic assessment of data acquisition and transmission losses has helped in quick quality tagging of browse images which is extremely useful for the users while placing order for data products. Image quality related information is presented to the users which enables them to decide whether the data are usable instead of blindly weeding out data with losses. This process has helped to overcome the shortcomings of manual quality estimation of browse scenes related to time and accuracy
of data loss detection. The automated process is more accurate, efficient and unbiased when compared to visual inspection. It has also enabled quick feedback and corrective actions whenever data losses occur through the reporting workflow. In future, the information provided by this process can also be used to characterize the quality of data reception chain. Automated quality estimation process will be even more beneficial for future Remote Sensing missions of ISRO involving higher data rates and more complex data processing.
ACKNOWLEDGEMENTS
The authors extend their deep gratitude towards Deputy Director, SDR&ISA and Director, NRSC, ISRO for their constant encouragement and support.
REFERENCES
B.Lakshmi, B.Radhika, T.SaiKalpana, T.JayaSudha, S.Naseepjan, SobinaBhaumik, RichaGoyal, Amit Kumar Singh, D. Smitha, V.VenuGopal, M. ManjuSarma, 2014, An Innovative Web Application For Satellite Data Ordering, International Journal of Advanced Computer Technology, Vol. 3
Bormin Huang (2011), Satellite Data Compression, Springer
Pushpakar A,Dube N,Dhar D, Ramakrishnan R, 2013, Resourcesat-2 image restoration for differential pulse code modulation compression artifacts, IEEE Second International Conference On Image Information Processing
Igor Aizenberg, Constantine Butakoff, 2004, Effective Impulse Detector based on Rank-Order Criteria, IEEE Signal Processing Letters, Vol. 11, No. 3
Rafael C.Gonzalez, Richard E. Woods, 2008, Digital Image Processing, 3rd edition, Prentice Hall
Ralf Reulkea and Thomas Sauberlichb, 2014, Image Quality of Optical Remote Sensing Data, Proceedings of SPIE Vol. 9250
Shungudzemwoyo Pascal Garaba, Jan Schulz, Marcel Robert Wernand, Oliver Zielinski, 2012, Sunglint Detection for Unmanned and Automated Platforms, Sensors, Volume 12 Issue 9, 12545-12561; doi:10.3390/s120912545
Susan Kay 1, John D. Hedley, Samantha Lavender,2009, Sun Glint Correction of High and Low Spatial Resolution Images of Aquatic Scenes: A Review of Methods for Visible and Near Infrared Wavelengths, Remote Sensing, Volume 1 Issue 4, 697-730