LANDSAT-BASED DETECTION AND SEVERITY ANALYSIS OF BURNED
SUGARCANE PLOTS IN TARLAC, PHILIPPINES USING DIFFERENCED
NORMALIZED BURN RATIO (dNBR)
A. B. Baloloy a,*, A. C. Blancoa, B. S. Ganaa, R. C. Sta. Anaa , L. C. Olaliab
aDepartment of Geodetic Engineering, University of the Philippines, Diliman, Quezon City 1101 bSugar Regulatory Administration, Quezon City 1101
KEY WORDS: Landsat, dNBR, Sugarcane cultivation, Agriculture
ABSTRACT:
The Philippines has a booming sugarcane industry contributing about PHP 70 billion annually to the local economy through raw sugar, molasses and bioethanol production (SRA, 2012). Sugarcane planters adapt different farm practices in cultivating sugarcane, one of which is cane burning to eliminate unwanted plant material and facilitate easier harvest. Information on burned sugarcane extent is significant in yield estimation models to calculate total sugar lost during harvest. Pre-harvest burning can lessen sucrose by 2.7% - 5% of the potential yield (Gomez, et al 2006; Hiranyavasit, 2016). This study employs a method for detecting burn sugarcane area and determining burn severity through Differenced Normalized Burn Ratio (dNBR) using Landsat 8 Images acquired during the late milling season in Tarlac, Philippines. Total burned area was computed per burn severity based on pre-fire and post-fire images. Results show that 75.38% of the total sugarcane fields in Tarlac were burned with post-fire regrowth; 16.61% were recently burned; and only 8.01% were unburned. The monthly dNBR for February to March generated the largest area with low severity burn (1,436 ha) and high severity burn (31.14 ha) due to pre-harvest burning. Post-fire regrowth is highest in April to May when previously burned areas were already replanted with sugarcane. The maximum dNBR of the entire late milling season (February to May) recorded larger extent of areas with high and low post-fire regrowth compared to areas with low, moderate and high burn severity. Normalized Difference Vegetation Index (NDVI) was used to analyse vegetation dynamics between the burn severity classes. Significant positive correlation, rho = 0.99, was observed between dNBR and dNDVI at 5% level (p = 0.004). An accuracy of 89.03% was calculated for the Landsat-derived NBR validated using actual mill data for crop year 2015-2016.
* Corresponding author
1. INTRODUCTION
The average sugarcane production in the Philippines is 81.58 tons/ha, the third highest in the world next to Colombia and Australia (Murthy, 2010). It is the fourth largest agricultural crop by plantation area in the country with major plantations located in Bukidnon, Pampanga, Batangas, Panay, Tarlac and Negros.
Sugarcane is the primary source of sugar and other products such as ethanol, fiber & fuel. It provides livelihood through farming, processing and trading to about 58,996 sugarcane farmers in the country (Fernandez & Nuthall, 2009). To sustain profitability and sustainability in the sugar industry, the production and cultivation of sugarcane is being regulated by the Sugar Regulatory Administration under the Philippines’ Department of Agriculture. Different programs were implemented to increase the efficiency of sugar production such as expansion of cultivated areas, development of better cane varieties, farm inventory and baseline farm mapping, establishment of farm-to-mill roads, irrigation and farm mechanization, and establishment of sugarcane economic zones (SRA, 2012, Fernandez & Nuthall, 2009). In addition, new and specific programs for strengthening research and development services for the sugar industry were recently implemented. In
January 2016, a nationwide project on the development of a Yield Estimation System for Sugarcane (YESS) was launched which aims to generate rapid, realistic and science-based estimates on annual cane production within the municipal and farm-level. This project will also generate and automate satellite-derived products for yield estimation and crop growth monitoring. Part of the system is the development of a workflow for detecting the extent of burned sugarcane areas for each mill district. Other target products are NDVI maps, mature cane maps, leaf-area estimates, ratoon detection and other relevant information that will serve as supplements for the spatial and temporal limitations of field data.
1.1 Sugarcane Burning
control to ensure the safety of workers. Post-fire burning is done to remove the trash and tops generated after harvest and to prepare the land for the next crop year.
Despite some benefits, cane burning can reduce the quantity of sugar recovered from the cane by as much as 5% (Hiranyavasit, 2016). In mill districts like Tarlac, 6% of the measured net weight is automatically deducted to determine the true net weight of burned canes; compared to a standard deduction of 2% for unburned canes (CAT, 1998). Sugar loss from burned cane harvests is mainly due to the burning process, while losses in fresh harvests are due to trash and in-field losses through the primary extractor (Gomez et al., 2006). Total sucrose loss in burned cane is also dependent on the degree of ratoon, with an observed significant higher loss in the third ratoon (Wiedenfeld, 2009).
1.2 Detecting Burned Sugarcane Areas
Removal of burned cane wastes usually occur within few days after harvest in preparation for the next crop season. Since it is difficult to rapidly detect the total burned area in the field, a satellite-based assessment of burned canes is a good alternative as it provides spatially continuous observation. Similarly, it is useful for mill districts with no existing harvest mode monitoring system. Landsat images can be used to determine burned areas and burn severity. A rapid method for mapping burned areas based on differencing the Normalized Burn Ratio (NBR) of pre- and post-fire images was developed by the National Park Service and the U.S. Geological Survey (Key and Benson, 2006). Near infrared and short wave infrared bands can provide the best contrast to isolate burned vegetation and healthy vegetation (Howard et al., 2002). NBR is a sensitive index that can highlight these burned areas using Landsat imagery. The formula for NBR is very similar to that of NDVI except that it uses near-infrared (NIR) and the short-wave infrared (SWIR) wavelengths (Lopez, 1991; Key and Benson, 2006) as shown in Eq. 1.
NBR = (NIR-SWIR) / (NIR+SWIR) (1)
Differenced NBR (dNBR) is computed by subtracting the post-fire scene NBR from a pre-post-fire scene NBR. If there is a dramatic increase in the resulting dNBR, that pixel is identified as potentially burned (Hart, 2015). The range of dNBR values within a fire perimeter is expressed as an index of burn severity. Burn severity refers to the magnitude of cumulative after-fire effects to an ecological community. In this study, we detected the burned sugarcane plots in Tarlac for the crop year 2015-2016 using Landsat 8 images and adapted Key and Benson’s burn severity classification (Key and Benson, 2006) to describe and analyze the burned pixels within the sugarcane plots.
2. STUDY AREA
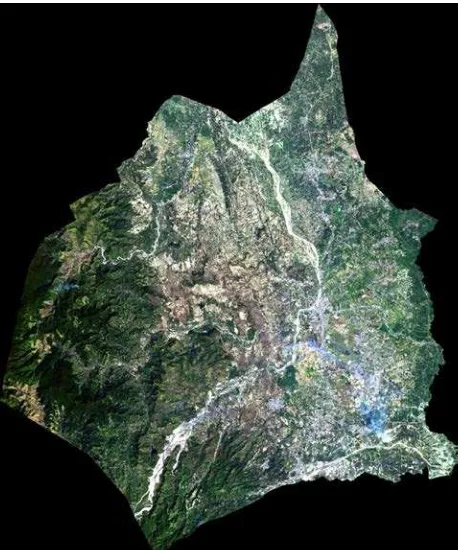
Tarlac is one of the largest sugarcane milling districts in the Philippines, with a total sugar production of 837,467 lkg in crop year 2015-2016. It is a province located in the Central Luzon region of the country, covering a total land area of 2,736.6 km². The eastern part of Tarlac is a plain while western Tarlac is hilly to mountainous (Figure 1). With a dominantly agriculture-based economy, the principal cultivated crops are rice and sugarcane. This study focused only on the 10,785 ha validated sugarcane plots in Tarlac mill district.
3. DATASETS
A total of four Landsat 8 images were downloaded through the United States Geological Survey (USGS) Global Visualization Viewer (http://earthexplorer.usgs.gov/) and served as the primary source of data. The scene covering the entire Tarlac is located in path 116 and row 49. A summary of pre-fire and post-fire images is shown in Table 1. All downloaded Landsat scenes were pre-processed and registered to UTM projection, WGS84 datum.
NBR ID Pre-fire date Post-fire date
Feb to Mar 02/13/16 03/16/16
Table 1. Summary of Landsat 8 Images
The second Landsat image per month was selected except for February as the first Landsat image that month had lower cloud cover. The duration from February to May encompasses the late milling season activities in Tarlac.
Figure 1. Landsat 8 Operational Land Imager (OLI) satellite image (February 13, 2016) of Tarlac, Philippines.
4. METHODS
4.1 Generation of dNBR images
ρλ' = MρQcal + Aρ (2)
NBR was computed using Equation 1 with TOA NIR and SWIR bands as the inputs. The dNBR was computed using Equation 3.
dNBR = NBRpre - NBRpost (3)
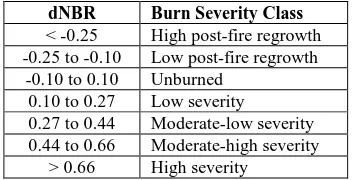
Monthly dNBR was generated for each two consecutive months (pre-fire and post fire); while maximum dNBR was obtained by subtracting the NBR of the earliest available Landsat image from the latest Landsat image. The dNBR values were expressed as burn severity using the index by Key and Benson (2006) with classification range shown in Table 2. The higher the dNBR value, the higher is the burn severity of the source pixel.
dNBR Burn Severity Class < -0.25 High post-fire regrowth -0.25 to -0.10 Low post-fire regrowth
-0.10 to 0.10 Unburned 0.10 to 0.27 Low severity 0.27 to 0.44 Moderate-low severity 0.44 to 0.66 Moderate-high severity
> 0.66 High severity
Table 2. Burn Severity Classes (from Key and Benson, 2006)
4.2 Analysis and Accuracy Assessment
The resulting dNBR images were clipped using the validated sugarcane plots shapefile. Plots with hazy and cloudy pixels were deleted to avoid confusion in the dNBR values (Hart, 2015). The responses of NIR and SWIR bands to burning were analysed using sample burned plots. The total area of monthly and maximum dNBR was calculated per burn severity to determine the scope and trend of burning throughout the milling season. Monthly Normalized Difference Vegetation Index (NDVI) images were generated to compare the relative amount of vegetation when fire has low, moderate or high severity, and if regrowth and unburned areas were detected. The required bands for NDVI are band 4 (red) and band 5 (SWIR), both obtained from the FLAASH (Fast Line-of-sight Atmospheric Analysis of Spectral Hypercubes) corrected Landsat 8 images. To extract the change in vegetation per burn severity, differenced NDVI (dNDVI) was calculated by subtracting the NDVI of post-fire images from the NDVI of pre-fire images. The trend of maximum dNDVI and dNBR (Feb to May) images were compared. Actual mill data on the milled burned and fresh canes during the study period were obtained from Tarlac Mill District Office (Central Azucarera de Tarlac) which served as the validation data for the results. Due to limitations in mill data, accuracy assessment was done between three classes: (1) burned sugarcane, (2) fresh or unburned, and (3) mixed, when both burned and unburned canes detected within a single plot.
5. RESULTS
Analysis of dNBR input bands from pre-fire to post-fire shows that values of Band 4 (NIR) generally decreases while Band 7
(SWIR) increases in the presence of fire (Figure 2). The opposite responses of these two bands provide the best contrast in distinguishing burned from unburned plots (Howard et al., 2002; Key and Benson, 2006). Using sample high-severity burned plots in the Feb to May dNBR, the SWIR band reflectance generated an average increase of 0.098 while NIR band showed an average decline of 8.627.
Figure 2. Change in band reflectance of NIR and SWIR between pre-fire and post-fire images of sample burned plots in
Tarlac.
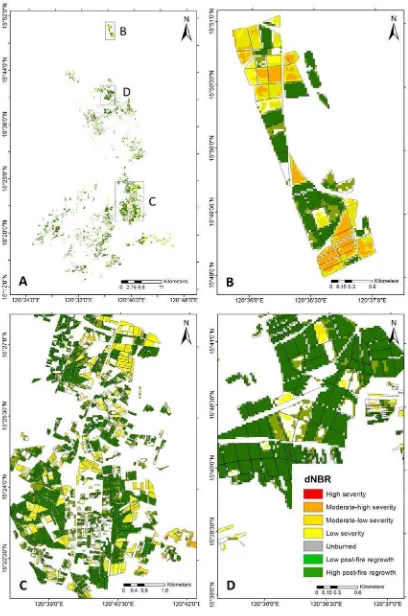
Burn Severity map produced using the maximum dNBR was classified into high, moderate-high, moderate-low and low severity; low and high post-fire regrowth; and unburned (Figure 4). The occurrence of low and moderate to low burns were seen throughout the entire study area (Figure 4A) while moderate to high severity burns were mostly concentrated in the northern portion (Figure 4B). Among the severity classes, ‘low severity burn’ has the highest burn extent (1,004.76 ha) followed by ‘moderate to low severity burn’ (491.94 ha) (Figure 3, February to May). Area observed with high severity burn recorded the lowest area with only 1.8 ha. Overall, only 8.01% of the total cultivated sugarcane area in Tarlac were unburned (792.54 ha) while 75.38% (7,452 ha) exhibited vegetation regrowth from previous burning activities, including those burned in the early and middle milling season.
Figure 3. Total burned area per severity class of monthly dNBR and maximum dNBR (Feb to May) using Landsat 8 Images. Severity classes: High Post-fire Regrowth (High PFR), Low Post-fire Regrowth (Low PFR), Unburned, Low Severity Burn (Low Sev Burn), Moderate to Low Severity Burn (Mod to Low Sev Burn), Moderate to High Severity Burn (Mod to High Sev
Figure 4. Burn Severity maps of Feb to May dNBR for (A) the entire Tarlac; zoomed in images of (B) San Manuel in the north, (C) La Paz and Concepcion in the south and (D) Paniqui and Ramos in the middle
Monthly dNBR was generated to determine the specific month when a certain severity class was dominant. The trend of burned area per severity varies per month as shown in Figure 3.
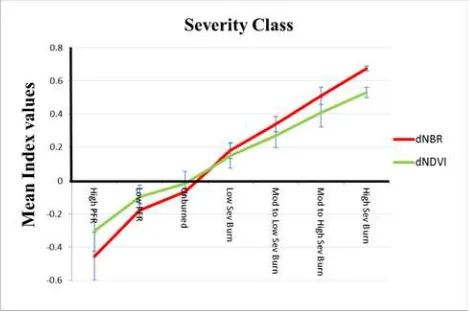
The dNDVI was used to determine the effect of burn severity to vegetation greenness and dynamics. The sensitivity of dNBR and dNDVI in burn detection were then compared. Spearman’s rho correlation revealed that the decline in NDVI due to burning is positively correlated with the burn severity class (rho=0.99) with p-value of 0.0004 at 5% significance level (Figure 5, Figure 6). Highest mean NDVI loss was 0.701, recorded in Feb to Mar (Figure 5) within a high-severity burned area.
Figure 5. Monthly mean dNDVI values per burn severity class
Figure 6. Feb to May mean dNBR and mean dNDVI in Tarlac showing positive correlation (p = 0.004) between indices.
Every milled cane in Tarlac was tagged with data such as date of arrival, measured total weight and method of harvest (burned or fresh). One hundred fifty-five (155) unique plots were obtained from the mill data to validate the generated dNBR maps in the late harvest season of crop year 2015-2016. Three classes were considered: (1) burned cane, (2) fresh or unburned and (3) mixed (see Table 3). Only mill data within the study period (late milling season) were considered for comparison with the dNBR results. Detected burned sugarcane within the validated plots ranged from low to high severity.
Overall accuracy for the Landsat-based burn detection was 89.03% (Table 3). In isolating the burned area from fresh and mixed harvest methods, 90% and 98.43% were obtained for producer’s and user’s accuracy, respectively. The latter is the highest percentage for user’s accuracy among the three classes.
Table 3. Classification confusion matrix for the Feb-May dNBR
6. DISCUSSION
Landsat 8 images were used to extract spatial information on the extent of burned sugarcane areas in Tarlac, Philippines. Sugarcane is commonly cultivated on large extent with enough dimensions for Landsat-based assessment (Aguiar et al., 2011).
NIR and SWIR bands were used to compute dNBR. The increase in the value of SWIR band due to fire (Figure 2) is due to the added signal of charcoal and ash (Hart, 2015) and the removal of water-retaining vegetation structures; while the decrease in NIR bands is caused by vegetation removal or scorching (Schepers et al., 2014). The burn plots used in Figure 2 were obtained within similar burn severity class (high-severity burn) resulting to small inter-sample variation of SWIR values. The post-fire values of NIR and SWIR bands are dependent on the severity of burn which generates varying amount of charcoal and burned vegetation structures.
It can be observed that the severity of burning is usually consistent within an entire sugarcane plot, and within plots that are adjacent to one another (Figure 4). These plots are commonly owned by a single planter who applies similar intra-plot crop management practices. The largest burned areas were recorded (low severity burn) in the early stage of the late milling season in February to March. Within these months, there are remaining mature sugarcanes in the study area and the low severity burns that have taken place can be attributed as pre-harvest burns. As seen on satellite images, pre-harvest burns will register lower severity compared to post-harvest burning since only the lower strata of the sugarcane was burned. This is known as sub-canopy burn, or underburn, which is hardly detectable in satellite imagery but can be reported as low severity burns depending on the density of the upper unburned canopy (Caetano et al., 1995; Medler and Yool, 1999; Rogan and Franklin, 2001). The extent of low severity burn reduced abruptly in Mar to Apr dNBR, while negligibly low severity burns were detected in Apr to May dNBR.
Low and high post-fire regrowth is relatively higher in Apr to May dNBR image (Figure 3). Most planters in Tarlac have already established new plant canes and ratoon prior or within the said months. The rate of vegetation generation is primarily dependent on the severity of previous burn (Delgado et al., 2003) except for annually cultivated areas. Compared to tropical forest regrowth which will take six years to over a
decade to recover (Chazdon, 2003; Tonbul, et al., 2016), sugarcane regrowth is faster due to planting intervention. Towards the middle of the last milling season (Mar to Apr), ‘moderate to low’ and ‘moderate to high’ severity burn were still detected in the dNBR, with burned areas of 251.1 ha and 35.55 respectively. Since most sugarcanes were already milled in March, these burns may result from post-harvest burning when planters burned remaining trash and tops. These trashes were either left on the ground or compiled prior to burning.
Comparison of dNBR and dNDVI showed that the higher the severity of burn, the greater the decrease in vegetation greenness as reflected by the NDVI values (Figure 6). Similar results were reported by Key and Benson (1999); Delgado et al. (2003); Kokaly et al. (2007); Esquin et al. (2008) and Tonbul et al. (2016). Like dNBR, dNDVI is also commonly used for burned sugarcane area mapping. Although these indices are both sensitive to pre- and post-fire changes, previous studies reported that one index is better than the other for a certain severity class. For example, Esquin et al. (2008) found out that dNBR was more sensitive in distinguishing between unburned to moderate classes while dNBR and dNDVI were equally sensitive in separating between unburned pixels. In this study, the dNBR was found to be consistently more sensitive to the pre- and post-fire changes in all burn severity classes (Figure 6).
High NDVI loss was observed in Feb to Mar (Figure 5) after mature sugarcanes were harvested (pre-harvest burning). Meanwhile, the moderate decrease of NDVI values in Mar to Apr suggests that the burned areas were composed of trashes, dried tops and weeds which have lesser initial NDVI values compared to mature sugarcane. The dNDVI recorded in areas with ‘post-fire regrowth’ were negative values implicating an improvement in vegetation density within a month or months after burning. Minimal change in dNDVI values can be observed in unburned sugarcane plots (-0.008 to 0.044) where vegetation was not subjected to pre- and post-harvest burning. Unburned areas generated both negative and positive dNDVI values.
7. CONCLUSION
This study has demonstrated that dNBR is a good index in mapping the spatial extent of burning sugarcane during the harvest season in Tarlac, Philippines. The NIR and SWIR bands generated strong opposite responses to burning, making them effective Landsat bands in burn distinction. Although maximum dNBR can show the overall change in cultivated areas from the start to the end of a milling season, a monthly dNBR is significant to determine the trend and severity of both pre-harvest and post-pre-harvest fires. It can also indicate the start time and rate of sugarcane regrowth. The dNDVI can be used to support dNBR data as they are found to be positively correlated. The workflow used in this study yielded a high accuracy of 89.03% in classifying burned versus unburned sugarcane plots. Observed errors may be caused by the differences between images that are non-attributable to the burn, such as phenological variations in each NBR image. Landsat-based detection of burned sugarcane areas can aid in rapid estimation of burn extent, and must be utilized in the computation of total net weight loss for every area of harvested canes.
ACKNOWLEDGEMENTS
The study was conducted under the Yield Estimation System for Sugarcane (YESS) Project funded by the Sugar Regulatory Administration (SRA), and implemented by the University of the Philippines - Training Center for Applied Geodesy and Photogrammetry (TCAGP).
REFERENCES
Aguiar, D.A., Rudorff, B.F.T., Silva, W.F., Adami, M., Mello, M.P., 2011. Remote sensing images in support of environmental protocol: Monitoring the sugarcane harvest in São Paulo State, Brazil. Remote Sensing, 3 (12), pp. 2682-2703.
Barbosa, P., Caetano, M., Santos, T., 2000. Detection of changes in forest landcover type after fires in Portugal. International Archives of Photogrammetry and Remote Sensing. In Proceedings of the 19th ISPRS Congress and Exhibition, Amsterdam. pp . 126-132.
Caetano, M., Mertes, L., Cadete, L., Pereira, J. M. C., 1995. Assessment of a AVHRR data for characterizing burned areas and post-fire vegetation recovery. In Proceedings of the EARSel Workshop on Remote Sensing and GIS Applications to Forest Fire Management. pp. 49-52.
Central Azucarera de Tarlac (CAT), 1998. A manual on quality control of the Raw Sugar Laboratory Section. pp. 1-7.
Chazdon, R. L., 2003. Tropical forest recovery: legacies of human intervention and natural disturbances. Perspectives in Plant Ecology, Evolution and Systematics, 6, pp. 51- 71.
Delgado, R.D., Lloret F., Pons, X., 2003. Influence of fire severity on plant regeneration by means of remote sensing imagery. International Journal of Remote Sensing, 24(8), pp. 1751-1763.
Esquin, S., Navarro, R., Fernandez, P., 2008. Fire severity assessment by using NBR (Normalized Burn Ratio) and NDVI (Normalized Difference Vegetation Index) derived from Landsat TM/ETM images. International Journal of Remote Sensing, 29(4), pp. 1053–1073.
Gomez, J., Chapple, D., McDonald, L., 2006. Sugar losses in burnt and green cane harvesting in Argentina. Proc. Aust. Soc. Sugar Cane Technol., 28.
Hart, Q.J., 2015. Detection of sugar cane harvest burning using satellite imaging. California Air Resources Board, Agreement 12-409 http://escholarship.org/uc/item/0jd5m384
Hiranyavasit, C., 2016. Corporate sustainability practices in Thai sugar industry. Proceedings of NIDA International Business Conference 2016. pp 8-16. With reports from WWF Action for Sustainable Sugar. Available online:
http://assets.panda.org/downloads/sustainablesugar.pdf
Howard, S., Ohlen, D., McKinley, R., Zhu, Z., and Kitchen, J., 2002. Historical fire severity mapping from Landsat data. Pecora 15/Land Satellite Information IV/ISPRS Commission I/FIEOS 2002 Conference Proceedings.
sensing. Available online: http://nrmsc.usgs.gov/ research/cbi.htm
Key, C.H., Benson, N.C., 2006. Landscape assessment: Remote sensing of severity, the Normalized Burn Ratio; and ground measure of severity, the Composite Burn Index. In FIREMON: Fire Effects Monitoring and Inventory System, RMRS-GTR, Ogden, UT: USDA Forest Service, Rocky Mountain Research Station.
Kokaly, R.F., Rockwell, B.W., Haire, S.L, & King, T.V.V., 2007. Characterization of post-fire surface cover, soils, and burn severity at the Cerro Grande Fire, New Mexico, using hyperspectral and multispectral remote sensing. Remote Sensing of Environment, 106, pp. 305–325.
Lopez Garcia, M.J., Caselles,V., 1991. Mapping burns and natural reforestation using Thematic Mapper data. Geocarto International, 1, pp. 31-37.
Medler, M. J., Yool, S. R., 1997. Improving Thematic Mapper based classification of wildfire induced vegetation mortality. Geocarto International, 12, pp. 49-58.
Murthy, S. R. S., 2010. Economics of Sugarcane production and processing. Department of Economic Analysis and Research, National Bank for Agriculture and rural development.
Padilla-Fernandez M.D., Nuthall P.L., 2009. Technical efficiency in the production of sugarcane in Central Negros area, Philippines: An application of data envelopment analysis. J. ISSAAS 2010. 15(1), pp. 77-90.
Philippine Statistics Authority. "Province: Tarlac". Philippines: National Statistical Coordination Board. Retrieved June 2016.
Ripoli T.C.C., Molina W.F., Ripoli M.L.C., 2000. Energy potential of sugarcane biomass in Brazil. Sci Agric. 2000, 57: 677-681.http://dx.doi.org/10.1590/S0103-90162000000400013
Rogan, J., Franklin, J., 2001. Mapping wildfire burn severity in Southern California forests and shrublands using Enhanced Thematic Mapper imagery. Geocarto International, 16(4).
Schepers, L., Haest, B., Veraverbeke, S., Spanhove, T., Vanden Borre, J., Goossens, R., 2014. Burned Area Detection and Burn Severity Assessment of a Heathland Fire in Belgium Using Airborne Imaging Spectroscopy (APEX). Remote Sensing. 6(3), pp. 1803-1826.
Schroeder, W., Olivia, P., Giglio, L., Quayle, B., Lorenz, E., &
Morelli, F. (2015). Active fire detection using landsat-8/OLI data. Remote Sensing of Environment, http://dx.doi.org/10.1016/j.rse.2015.08.032.
Sugar Regulatory Administration, 2012, Sugarcane industry roadmap. Available online: http://www.sra.gov.ph/wp- content/uploads/downloads/2012/12/sugarcane-industry-roadmap_nov12-1.pdf (accessed on 3rd April 2016).
Tonbul, H., Kavzoglu, T., Kaya, S., 2016. Assessment of fire severity and post-fire regeneration based on topographical features using multitemporal landsat imagery: a case study in Mersin, Turkey. The International Archives of the
Photogrammetry, Remote Sensing and Spatial Information Sciences, 41-B8.
United States Geological Survey (USGS). Using the USGS Landsat 8 product. Available at: http://landsat.usgs.gov