SUPERVISED CLASSIFICATION PROCESSES FOR THE CHARACTERIZATION OF
HERITAGE ELEMENTS, CASE STUDY: CUENCA-ECUADOR
J. C. Briones a, V. Heras a *, C. Abril b, E. Sinchi a
a Universidad de Cuenca, Architecture and Urbanism Faculty, Av 12 de Abril & Agustín Cueva, Cuenca, Ecuador - (juan.briones, veronica.heras, edison.sinchit)@ucuenca.edu.ec
b Carleton University, 1125 Colonel By Drive, Ottawa, K1S 5B6 Canada - [email protected]
Commission II
KEY WORDS: Preventive conservation, Monitoring, Imagery classification, Support Vector Machines, Roof structures, morphological mathematic
ABSTRACT:
The proper control of built heritage entails many challenges related to the complexity of heritage elements and the extent of the area to be managed, for which the available resources must be efficiently used. In this scenario, the preventive conservation approach, based on the concept that prevent is better than cure, emerges as a strategy to avoid the progressive and imminent loss of monuments and heritage sites. Regular monitoring appears as a key tool to identify timely changes in heritage assets. This research demonstrates that the supervised learning model (Support Vector Machines - SVM) is an ideal tool that supports the monitoring process detecting visible elements in aerial images such as roofs structures, vegetation and pavements. The linear, gaussian and polynomial kernel functions were tested; the lineal function provided better results over the other functions. It is important to mention that due to the high level of segmentation generated by the classification procedure, it was necessary to apply a generalization process through opening a mathematical morphological operation, which simplified the over classification for the monitored elements.
* Corresponding author
1. INTRODUCTION
1.1 General Background
Conservation of cultural sites in Latin America has traditionally been focused on the protection and restoration of existing monuments and buildings. However, heritage conservation plans are moving towards the preservation through preventive monitoring and maintenance based strategies. As Van Balen (2011) mentions, preventive conservation in cultural heritage aims to avoid or mitigate the damages to a heritage property by understanding its risks and harmonizing the responsibility among actors and involved stakeholders. It also promotes maintenance as a preservation strategy based on continuous monitoring of the heritage site.
However, these concepts are not new; since the Athens Charter (ICOMOS 1931), continuing with the Venice Charter (ICOMOS 1964), and the more recent Burra Charter (ICOMOS 1999); different reflections on maintenance and monitoring have been made to World Heritage Sites (WHS). Since the early nineties, the World Heritage Committee reviewed different management procedures for World Heritage Sites (WHS). In this regard, measures to strengthen the control to follow up the changes over time and establish successful management strategies were suggested and implemented through processes of reactive and periodic monitoring.
However, with 1052 properties officially listed, the management and control problems persist (UNESCO, 2017). This situation is not different for WHS in South America, where the conservation of the cultural world heritage confronts
different kinds of threats, limited annual budgets and complex conservation decisions (Heras, 2014).
For the case of the city of Cuenca located in the southern Andes of Ecuador at 2500 ma.s.l.; which offers unique landscapes, fusion of different cultures and architectural qualities that have deserved its recognition as WHS in 1999 by the UNESCO (UNESCO, 1999). In the city, different architectural styles and traditional building typologies are still present in some of their aesthetic qualities such as: balconies, traditional windows or doors carpentries, roof structures, colonial courtyards, orchards and inner gardens. Some of these elements can be easily recognized from guided visits through the historic centre. However, some of them could only be observed from areal views.
The described qualities have been under threat in the last years because of the rapid development experienced by Latin American cities. Transformations due to new functions, improvised adaptations, façade alterations, among other actions represent significant hazards for the heritage values of Cuenca. Moreover, the described alterations clearly demonstrate the vulnerability of the current control procedures, discontinuity in between the periodic monitoring processes established by the UNESCO and a lack integrated heritage management tools between the local and national institutions responsible for the protection of heritage sites in Ecuador.
technologies are tested for improving the monitoring process. Based on the described intentions, other experiences were study. Huang & Zhang (2013), for example, focus their research on the extraction and classification of urban elements by the use of mathematical morphology, algorithms and high-resolution images. The results show a prominent coming for their application in heritage conservation. Thus, this research will show in the following paragraphs some of the implemented essays in a small area of the historic centre of Cuenca.
1.2 Study area
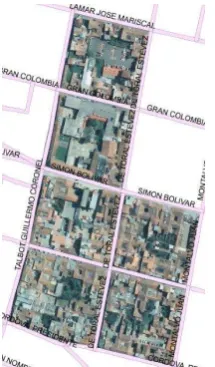
For the development and methodology application, a building block of the historic centre of Cuenca was selected as study area (see figure 1 (a) and (b)). The selection was carefully done by identifying a building block of the city that present the following conditions: a) major number of registered alterations (Heras, Barsallo, Abril, & Briones, 2016) and b) the selected area have sufficient historical and current information for the required analyses.
Figure 1(a). Rectified image of the selected building block Source: SIGTIERRAS, 2013
Figure 1(b). Rectified image of the selected building block Source: Municipalidad de Cuenca, 2016
In the selected building block, the researchers identified the heritage values by the used of the Nara Grid (Van Balen, 2007). Thus, historical, aesthetic and social values appear as
outstanding elements of this area. Nevertheless, for monitoring purposes two levels of categorization were recognized. The first level is related to the values and specific attributes related to those values. Such as: the material of roof structures, the existing greenery of the building block and the geometry of the urban layout are elements related to historical and aesthetic values and therefore need to be monitored. The second categorization level is connected to some delicate discriminations that can be done to some attributes like the material of the roof structures. It means, that different roof textures can be separated e.g. traditional tiles, industrial tiles or glass.
2. MATERIALS AND METHODS
2.1 Imagery classification as a tool for heritage monitoring
In order to accomplish the image categorization, the supervised classification technique was experimented in aerial photographs of different historical periods of the selected study area. The classification used the Supported Vector Machines (SVM) algorithm and some kernel functions (Vapnik, 2013) were also included. The quality of the classification was evaluated using a confusion matrix. Their exactitude and the kappa index that establish the accuracy level between two independent observations was calculated. The results showed the suffered changes occurred in some heritage elements as signs of deeper alterations in the urban layout and will be described in detail in the following sections.
In addition, it is important to mention that SVM is a machine-learning algorithm introduced for Vapnik at 90’s decade for to data cluster, regression and multi classification. Currently, this technique is being applied in different fields such as artificial vision, character recognition and time series analysis. Nevertheless, SVM as classifier is considered within linear classification algorithms, because each class is separated through a margin called hyperplane. In order to perform classification results, this hyperplane must be located to the maximum distance as possible of the cases more difficult to classify, which are called support vectors, as it is shown in figure 2.
Figure 2. Separation margin should be as far as possible of the hardest classification cases (support vectors)
Source: Authors, 2016
paper, the classification is tested with the lineal, polynomial and Gaussian functions, in order to establish which of them presents better results.
Figure 3. Use of kernel function to transform the original space into a space with different characteristics.
Source: Authors, 2016
2.2 Classification process
The elements to be classified are defined according to their materiality, the details are shown in Table 1.
Level 1-classification: by elements
Level 2-classification: by materials Element Description Material Description
1 Roof
greenery 20 Vegetation
4
Table 1. Heritage elements and materials Source: Authors, 2016
Two rectified images of 2013 and 2016, have been considered. These images were taken from an UAV with different spatial resolution: 30cm/pixels and 2.5cm/pixels, respectively. Due to the high spatial resolution, the last image offers very detailed characteristics on the geometry and texture of the elements to be monitored (roof structure, inner garden or pavements). The research used the classification algorithm (SVM) with different types of functions. The performance of the algorithm was evaluated by estimating overall accuracy (OA) and the kappa index.
Supervised classification algorithms require a set of positive samples for each -heritage- element. These samples are known as regions of interest (ROI), which are polygons whose identification corresponds to the identified material described in table 1.
According to Cohen (1960), the value of the kappa index k=1 indicates total agreement between the two observers over the same image. Therefore, in the present research the training models were adjusted to a kappa index greater than k=0.9.
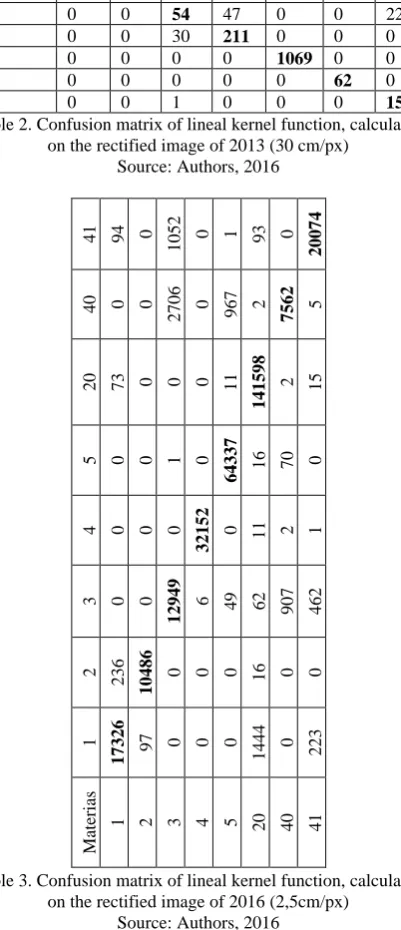
Table 2 and table 3 show the confusion matrices on which subsequent calculations are based. The first matrix corresponds to the analyses of the rectified image of 2013, while the other matrix was calculated with the rectified image of 2016. In both cases the lineal kernel function was used.
Materials 1 2 3 4 20 40 41
Table 2. Confusion matrix of lineal kernel function, calculated on the rectified image of 2013 (30 cm/px)
Source: Authors, 2016
Table 3. Confusion matrix of lineal kernel function, calculated on the rectified image of 2016 (2,5cm/px)
Source: Authors, 2016
To obtain the kappa index, the overall accuracy (OA) showed in equation 1, was calculated. This percentage is considered as an accurate measurement for classification of heritage elements. The calculation is done by adding the samples from the diagonal column of the confusion matrix. As it was mentioned before, the calculations are finished when both observers coincide in their classification for the total observations.
From each observer in every class the random probability (P) is calculated (See equation 3). Therefore, if there are two observers A and B, the individual probabilities (p) of each of them must be calculated (See equation 2).
(2) The classification accuracy depends on the separation between each class when a p-dimensional space is given. However, these classifiers try to find separation margins with linear functions. It is important to say that it has limitations in problems where there are multiple classes and the margin is small due to the sample similarity (Duda, Hart, & Stork, 2012).
The obtained results for each of the used kernel methods (KM) (Muller, 2001) are showed in table 4:
Table 4. Classification results Source: Authors, 2016
Once the described procedure and calculations were performed, the lineal function showed better results; it means, an accuracy level (OA) of 97%.
2.3 Generalization process
The process consists on grouping categories for the classified elements. This operation is known as generalization and allows eliminating the noise generated by very small elements that are not classified; for example: vehicles on the streets.
As it was described before, the rectified image had a high-resolution (2.5 cm/pixel), which caused a highly segmented classification. In addition, it was important to consider that at this stage the research only classified general elements like roofs structures, inner gardens and pavements. Therefore, it was opportune to apply a function of morphological opening (Haralick, Sternberg, & Zhuang, 1987). It allowed to objects smaller than 25 cm in length can be assigned to larger adjacent classifications. It means that all the elements within the structuring element1 should be eliminated to recover the original size of the larger elements.
This transformation implies that the recovered elements will present a round shape because the structuring element is a circle. It can be solved by an operation known as reconstruction opening that allows to recover the original shape of morphologically transformed elements (Meyer & Beucher, 1990). However, for the purposes of the present study no such reconstruction was necessary.
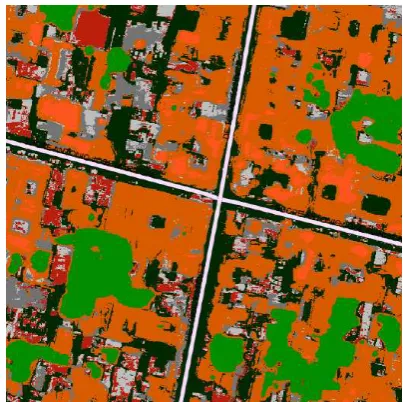
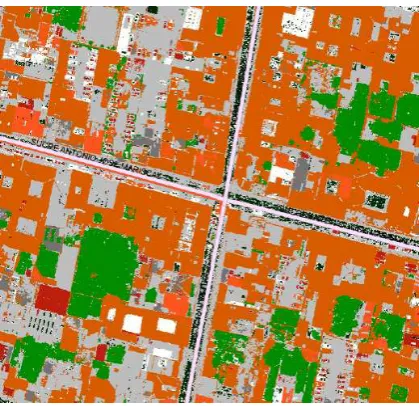
Figure 4 (a) and (b) show the obtained results after removing elements less than 25 cm, avoiding an over segmentation at the time of the raster file.
Figure 4. (a) 2013 raster image, 30cm/px, This image was classified and generalized with the SVM lineal function.
Source: Authors, 2016
1 Predefined shape, drawing conclusions about how to fit this shape in
the study image (Zhang, Q., Qin, R., Huang, X., Fang, Y., & Liu, L., 2015).
Pol
ynomial 0,9143 0,9143 0,8335 0,8763
Figure 4. (b) 2016 raster image, 2,5cm/px. This image was classified and generalized with the SVM lineal function.
Source: Authors, 2016
3. RESULTS
An important outcome of the research is the estimation of the occupation area of the monitored elements within the study area. The results are presented in Table 5.
Materials Lineal
Traditional tiles 29.085,80 27.808,90 4 Industrial tiles 3.137,08 3.247,60 4 Cement tiles 6.860,07 12.394,80 81
Zinc 4.386,40 3.437,13 22
Vegetation 7.365,78 19.993,30 171 Cobble 19.864,40 7.448,87 63 Concrete 6.663,57 3.032,49 54
2016 image
Traditional tiles 31.143,10 32.978,50 6 Industrial tiles 4.644,88 4.274,54 8 Cement tiles 24.324,90 27.291,90 12
Zinc 1.295,18 1.088,90 16
Glass 3.969,95 4.192,18 6
Vegetation 6.989,34 6.244,96 11
Cobble 2.393,23 1.018,69 57
Concrete 2.604,31 275,13 89
Table 5: Area for each study element according to the respective used image identify the building materials that caused mayor confusion while image classification. The results presented by the confusion matrix were the following:
Materials Lineal
Table 6: Classifier precision percentages, identified by its materials. Source: Authors, 2016
Table 6 shows the performance of each classifier for the studied building materials. In the 2016 image, the polynomial classifier presented clear problems distinguishing between concrete and cement tiles with 2% of accuracy level. The linear classifier has a higher performance; its worst accuracy level corresponds to 78% when distinguishing between the same building materials. In addition, the results of the lower-resolution 2013 image with a smaller number of samples, shows that the polynomial classifier had problems distinguishing between concrete and cement tiles with 46% accuracy, as well as between cement tiles and zinc with a 59% accuracy. For the linear classifier the worst result occurs when distinguishing between cement tiles and zinc.
If the results of tables 5 and 6 are compared the differences between the linear and polynomial classifiers remain high for the identification of cement tiles and concrete building materials in both 2013 and 2016 images. It is also aligned to the distinction problems that were previously described. Nevertheless, it is important to mention that the distinction of vegetation in the image 2013 presents a relevant difference between the linear and polynomial classifier. In the 2016 image, this difference is considerably reduced. From these results, it can be stated that the SVM classifier is more accurate with a larger number of samples and on a higher resolution image.
Based on the previous results, the images obtained with the linear classifier were considered for other analyzes that could corroborate the effectiveness of the tool for monitoring changes in the study area.
Materials Area (m2) Traditional tiles 1415
Industrial tiles 328 Cement tiles 1780
Vegetation 441
Cobble 101
Concrete 162
Table 7: Distribution of areas where there were previously zinc roofs
Source: Authors, 2016
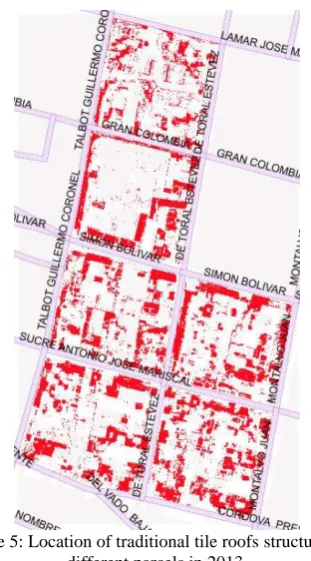
In addition, table 5 shows that the surface of traditional tiles has increased in approximately 2000 m2 if it is compared to the surface registered in the year 2013. For monitoring purposes, the location of these changes can be detailed and followed through time. For example, figure 5 displays red areas that represent roof structures covered with traditional tiles and that previously were covered by other materials.
Figure 5: Location of traditional tile roofs structures, in different parcels in 2013.
Source: Authors, 2016
In line to previous mentioned, new possibilities for improvements of control tools to support preventive conservation practices in World Heritage Sites have been showed. The selected case study illustrates the potentials of imagery classification to automate monitoring procedures.
Other studies from Benediktsson, Pesaresi, & Arnason (2003); Huang, Zhang, Qang, Zhang, & Li (2007) and Huang & Zhang (2013), presented different strategies for urban elements extraction and classification. Clearly, their research objectives and applications were different to heritage conservation. Nevertheless, it has been verified that the used strategies can easily be specialized for the implementation and improvement of monitoring tools in WHS.
4. CONCLUSIONS
The SVM algorithm applied on the 2016´s high-resolution rectified image, obtained a classification and an agreement degree kappa of 96% over the total samples and against the 94% accuracy of the 2013´s image. In addition, the lineal function presented better results and higher accuracy levels. The difference between the obtained results is related to the resolution of the rectified images. These tests were executed with rectified images with a resolution of 30cm/pixels against 2,5cm/pixels images.
Once the areas for each element were obtained, there was a marked difference of the accuracy level between the 2013´s image (30cm/px) and the 2016´s image (2,5cm/px). By using the lineal and polynomial kernel functions, the first function presents areas with a difference of 80% for cement tiles, 170% for vegetation and over 54% for concrete and cobble. The same comparison was made with the 2016´s image. In this case, the areas differences do not exceed 20%, except for concrete and cobble elements. Clearly, this type of classification requires high resolution images to obtain better results. Nevertheless, with elements such as concrete and cobble there is still a considerable difference between the two images that need to be studied.
Future tests could include other features such as material textures, height of building elements and reflectance values, which could discriminate elements, due to lighting factors and their similar colour levels.
It is also important to mention that computational processing using image classifiers are definitively less intensive compared to other algorithms such as neural networks, as it requires fewer samples compared to a neural network. Nevertheless, other tests in bigger areas (more than one building block) is suggested. Furthermore, it is relevant to mention that the study area has no a ground truth. In this research, a ground truth of the study area between 3 and 5 regions of interest (ROI) was used for each element. However, for future studies it is necessary to create a complete ground truth for all the building blocks of the monitoring area.
The high-resolution of the rectified images need also have to be considered. Very small elements were classified, which introduced noise to the raster file. In this scenario, it is recommended to use morphological operations, to obtain a clearer final classification and to approximately keep the original geometry of each classified element.
The present study allows to verify the usefulness and feasibility of the SVM algorithm in relation to monitoring processes of built heritage elements of the city of Cuenca. Therefore, the implementation of the described tools can overcome existing gaps between information management and preventive conservation practice.
REFERENCES
Benediktsson, J. A., Pesaresi, M., & Arnason, K., 2003. Classification and feature extraction for remote sensing images from urban areas based on morphological transformations. IEEE Transactions on Geoscience and Remote Sensing, 41(9),
1940–1949. Available:
https://doi.org/10.1109/TGRS.2003.814625
Cohen, J., 1960. A coefficient of agreement for nominal scales.
Duda, R. O., Hart, P. E., & Stork, D. G., 2012. \iPattern Classification, John Wiley & Sons p.49-51.
Haralick, R. M., Sternberg, S. R., & Zhuang, X., 1987. Image Analysis Using Mathematical Morphology. IEEE Transactions on Pattern Analysis and Machine Intelligence, PAMI-9(4),
532–550. Available:
https://doi.org/10.1109/TPAMI.1987.4767941
Heras, V., Barsallo, M. G., Abril, C., & Briones, J. C., 2016. Heritage inventory as the base for a monitoring system in the world heritage city of Cuenca. Structural Analysis of Historical Constructions: Anamnesis, diagnosis, therapy, controls - Proceedings of the 10th International Conference on Structural Analysis of Historical Constructions, SAHC 2016, 181–184.
Heras, V., Zalamea, O., and Steenberghen, T., 2013. “A GIS Based Tool for a Preventive Conservation Management
Approach” In: Reflections on Preventive Conservation,
Maintenance and Monitoring by the PRECOM³OS UNESCO Chair, edited by K. Van Balen and A. Vandensande, 86-93, Levuen: ACCO.
Huang, X., & Zhang, L., 2013. An SVM Ensemble Approach Combining Spectral, Structural, and Semantic Features for the Classification of High-Resolution Remotely Sensed Imagery. IEEE Transactions on Geoscience and Remote Sensing, 51(1),
257–272. Available:
https://doi.org/10.1109/TGRS.2012.2202912
Huang, X., Zhang, L., & Li, P., 2007. Classification and Extraction of Spatial Features in Urban Areas Using High-Resolution Multispectral Imagery. IEEE Geoscience and Remote Sensing Letters, 4(2), 260–264. Available: https://doi.org/10.1109/LGRS.2006.890540
ICOMOS, 1999. The Burra Charter. Australia: ICOMOS-Australia. Available: http://australia.icomos.org/wp-
content/uploads/The-Burra-Charter-2013-Adopted-31.10.2013.pdf
ICOMOS, 1964. The Venice Charter [Online]. Venice, Italy:
ICOMOS. Available:
http://www.international.icomos.org/hist_eng.htm.
ICOMOS, 1931. The Athens Charter [Online]. Athens, Greece. Available: http://www.icomos.org/docs/athens_charter.html.
Meyer, F., & Beucher, S., 1990. Morphological segmentation. Journal of Visual Communication and Image Representation, 1(1), 21–46. http://doi.org/10.1016/1047-3203(90)90014-M
Muller, K., 2001. An introduction to kernel-based learning algorithms.
UNESCO, 2017. “World Heritage List Statistics” Retrieved from: http://whc.unesco.org/en/list/stat#s1 (Last consulted 27/01/ 2017).
UNESCO, 1999. Adopted at The World Heritage Committee meeting at its 23th Session, 29 November – 4 December, Marrakesh-Morocco.
Van Balen, K. 2008., “The Nara Grid: An Evaluation Scheme
Based on the Nara Document on Authenticity”. APT bulletin,
49 (2): 39-45.
Van Balen, K., 2011. “Preventive Conservation in the International context of the PRECOM3OS network”. In Proceedings of the International Conference on Preventive Conservation of Architectural Heritage, October 29-30, Nanjing - China.
Vapnik, V. 2013., \iThe nature of statistical learning theory. Springer Science & Business Media. Pag 190-193