ESTIMATION OF GRASSLAND USE INTENSITIES BASED ON HIGH SPATIAL
RESOLUTION LAI TIME SERIES
S. Asam a, b, *, D. Klein c, S. Dech c
a Institute for Applied Remote Sensing, EURAC Research, Viale Druso, 1, 39100 Bolzano, Italy – [email protected] b Department of Remote Sensing, Institute of Geography, University of Wuerzburg, Oswald-Külpe-Weg 86, 97074 Wuerzburg,
Germany
c German Aerospace Center (DLR), German Remote Sensing Data Center (DFD), Oberpfaffenhofen, 82234 Weßling, Germany – (doris.klein, stefan.dech)@dlr.de
KEY WORDS: Leaf area index (LAI), radiation transfer modeling, RapidEye, Alpine area, grassland, management intensity
ABSTRACT:
The identification and surveillance of agricultural management and the measurement of biophysical canopy parameters in grasslands is relevant for environmental protection as well as for political and economic reasons, as proper grassland management is partly subsidized. An ideal monitoring tool is remote sensing due to its area wide continuous observations. However, due to small-scaled land use patterns in many parts of central Europe, a high spatial resolution is needed. In this study, the feasibility of RapidEye data to derive leaf area index (LAI) time series and to relate them to grassland management practices is assessed. The study area is the catchment of river Ammer in southern Bavaria, where agricultural areas are mainly grasslands. While extensively managed grasslands are maintained with one to two harvests per year and no or little fertilization, intensive cultivation practices compass three to five harvests per year and turnover pasturing.
Based on a RapidEye time series from 2011 with spatial resolution of 6.5 meters, LAI is derived using the inverted radiation transfer model PROSAIL. The LAI in this area ranges from 1.5 to 7.5 over the vegetation period and is estimated with an RMSE between 0.7 and 1.1. The derived LAI maps cover 85 % of the study area’s grasslands at least seven times. Using statistical metrics of the LAI time series, different grassland management types can be identified: very intensively managed meadows, intensively managed meadows, intensively managed pastures, and extensively managed meadows and moor. However, a precise identification of the mowing dates highly depends on the coincidence with satellite data acquisitions. Further analysis should focus therefor on the selection of the temporal resolution of the time series as well as on the performance of further vegetation parameters and indices compared to LAI.
1. INTRODUCTION
The identification and surveillance of agricultural practices, especially of management intensities, is relevant for a range of ecological, conservation, and political issues. In the alpine region, livestock farming is the predominant agricultural land use, and at the same time, various different pasturing and mowing intensities exist. The ecological relevance of grassland usage intensity is linked to exchange fluxes of water, energy, and gases between the land surface and the atmosphere. Knowledge on use intensities can hence improve greenhouse gas inventories (Schaller et al. 2011). In addition, the conservation status of grassland needs to be monitored to assess the ecological value of landscapes. Traditional and other extensive types of agricultural land use can maintain the biodiversity of grassland landscapes. Especially semi-natural, extensively used grasslands play an important role as habitats with a high conservation value (Öster et al. 2008; Sullivan et al. 2010). Intensification or abandonment of these grassland managements on the other hand can cause biodiversity loss (Henle et al. 2008). Furthermore, knowledge on mowing and pasturing intensities are important for political and economic reasons, as proper grassland management is partly subsidized in the EU.
The monitoring of agricultural management intensities often relies on remote sensing data, as they provide repetitive and area wide continuous observations. Due to the small-scaled land use patterns in the alpine areas of central Europe, the used remote sensing images need a high spatial resolution, which becomes increasingly feasible with relatively new sensors such as RapidEye, Landsat 8, and, soon, Sentinel-2. Nevertheless, the potential of satellite imagery for the inventory of grassland use intensity on individual fields has barely been assessed (Franke et
al. 2012). Remote sensing based research on managed grassland mainly focused on extent, status, and primary production assessment (see e.g. Seaquist et al. 2003, Mutanga et al. 2004, Boschetti et al. 2007, Vescovo and Gianelle 2008), but only rarely on grassland management. In addition, mostly large-scale biomes such as semi-arid or subtropical grasslands have been assessed (Numata et al. 2007, Kurtz et al. 2010). Another issue is the temporal resolution of grassland observations, since with high spatial resolution data the coverage of a certain study area at regular intervals is often impeded, especially in areas prone to frequent cloud cover such as the Alpine area.
2. STUDY AREA
The study area is the catchment of the river Ammer in the Bavarian alpine upland covering 770 km2 (see Fig.1). This catchment constitutes the TERENO Prealpine Observatory (http://teodoor.icg.kfa-juelich.de). The rural land cover of the study area is representative for the European alpine upland. The landscape is dissected by small settlements, forest patches and small-scale agricultural patches. These agricultural areas are mainly grasslands used for pasturing and mowing. In the alpine upland, many pastures are cultivated using rotational grazing and cutting hayfield systems. With the grazing and/or vegetation cuttings followed by rapid re-growth, these grasslands undergo multiple growing cycles within a single vegetation period (Wohlfahrt and Cernusca, 2002). Apart from the intensively used grasslands, i.e. habitats consisting of few, mesophilic species, there are also extensively managed grassland types in the Ammer catchment which consist of rarer species that are more adapted to very humid, dry, cold, or nutrient poor conditions. Two European agro-environmental schemes aiming at the preservation of biodiversity are implemented in the area: the High Nature Value (HNV) farmland indicator and the habitats Natura 2000 directive. These extensively managed grasslands are semi-natural grasslands maintained with one to two harvests per year and no or little fertilization.
3. DATA AND METHODS
3.1 Remote Sensing data
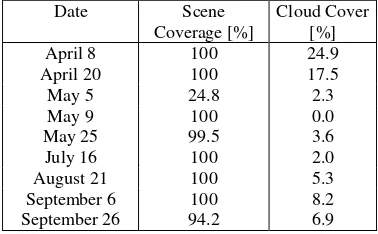
All analyses conducted in this study are based on a RapidEye time series consisting of nine images acquired between April and September 2011 (see Tab. 1). The RapidEye constellation consists of five satellites located in the same sun-synchronous orbital plane. The sensors are push broom scanners with five spectral bands in the visible (blue [440 – 510 nm], green [520 – 590 nm], red [630 – 685 nm]) and infrared (red edge [690 – 730 nm] and near infrared [760 – 850 nm]) domain. The spatial resolution of RapidEye level 1B images is 6.5 m.
The preprocessing of the level 1B data consisted of a transformation into UTM (WGS 84 datum) projection by using a nearest neighbor algorithm; orthorectification using RPCs associated with the RapidEye data and a 30 m Shuttle Radar Topography Mission (SRTM) digital elevation model (DEM); precise georeferencing using ground control points; and finally a topographic and atmospheric correction using ATCOR (Richter and Schläpfer 2012).
The individual RapidEye images cover the Ammer catchment to different extents. Clouds further reduce the spatial information
available individually for each scene (see Tab. 1). The resulting number of observations per pixel is illustrated in Fig. 1. A lower number of observations is given in some areas of the southern half of the study area, which is part of the Bavarian Limestone Alps, due to higher cloud occurrence close to the mountains.
3.2 Field measurements
In situ LAI measurements have been collected during four weeks contemporaneous to the RapidEye data acquisitions in May, July, and September 2011. The measurements were arranged within a two-stage nested design (Morisette et al. 2006) resulting in 20 - 33 plots per time step. LAI was measured at 20 points on two transects within each plot using a LAI-2000 Plant Canopy Analyzer (PCA) (LI-COR Biosciences, Lincoln, NE, USA), and corrected afterwards using an empirical relationship that was established between LAI-2000 measurements and destructive LAI samplings from 14 of the above mentioned locations at the respective same days. The LAI in situ values per plot cover a data range from 1.5 to 7.4 with a mean of 3.6. For more details on the field measurements the readers can refer to Asam et al. (2013). At the same time information on the status of management of the observation sites have been noted.
3.3 Land cover classification
All water bodies, snow covered areas, clouds, and cloud shadows were masked manually in the RapidEye images. The same water mask was applied to all images, whereas all other masks were created scene-specifically. A grassland mask was derived in a next step based on a ‘random forest’ land cover classification
Date Scene
Coverage [%]
Cloud Cover [%]
April 8 100 24.9
April 20 100 17.5
May 5 24.8 2.3
May 9 100 0.0
May 25 99.5 3.6
July 16 100 2.0
August 21 100 5.3
September 6 100 8.2
September 26 94.2 6.9
Figure 1. Location of the study area covering the Ammer catchment in the Bavarian alpine upland and number of RapidEye observations during 2011.
(Breiman 2001). For the classification, three RapidEye images with a high scene coverage and only little cloud cover were used (May 9, July 16, and September 6). A multi-temporal classification approach was chosen because some of the land cover classes, for example “winter wheat” and “grasslands”, show similar spectral signatures in advanced development stages, but distinctly different phenologies. The scenes were stacked into one data frame together with three VIs derived for each scene respectively, namely the Normalized Difference Vegetation Index (NDVI), the Soil Adjusted Vegetation Index (SAVI), and an adjusted NDVI with the red edge band substituting the red band, resulting in a 24 layer feature space. The training and validation data, in total about 83000 pixels, were collected in situ
during the field campaigns and complemented by visual interpretation within the RapidEye scenes using Google Earth imagery in order to increase the number and diversity of land cover units used for classifier training. The number of trees within the random forest was set to 500 in order to achieve convergence. The overall classification error of the areas which are covered by all three images (86.1 % of the study area) is 3.4 %. No distinction between grassland types could be made at this stage, due to the relatively low number of field campaigns conducted (see above) and the very high heterogeneity of the grassland fields.
3.4 LAI derivation
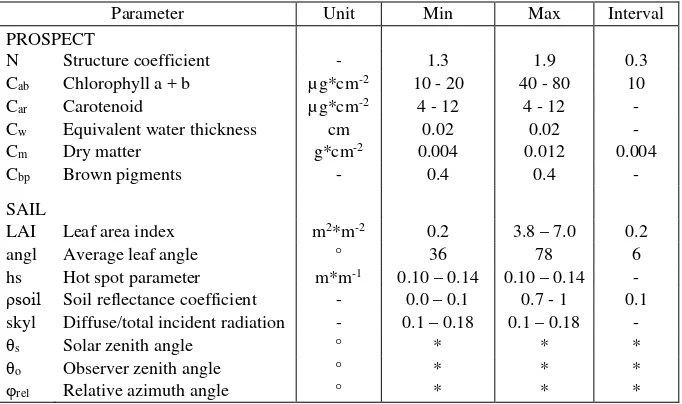
LAI is derived from the RapidEye data using the inverted radiation transfer model (RTM) PROSAIL (Jacquemoud et al. 2009). RTMs simulate the interactions of radiation with vegetation elements and the soil while traveling through the canopy, i.e. absorbance, reflectance and transmittance are considered. Based on these processes, the radiation leaving a canopy can be related to the spectral and structural properties of the canopy. In order to derive LAI, the RTM is first run in forward mode to calculate reflectances for given specific canopies and observation configurations. Therefor different multiple canopy realizations are implemented using varying combinations of input parameter values. Based on a global sensitivity analysis, the influence of each parameter on the spectral domains covered by the RapidEye bands was identified
first, which was used to determine the sampling interval of each parameter. PROSAIL was then characterized by its leaf and canopy variables based on values collected in the field and on literature values (e.g. Weiss et al. 2000, Darvishzadeh et al. 2008, Feret et al. 2008; Table 2). Additionally, the local, i.e. topographically corrected, viewing and illumination were considered in this process. For all parameters, a uniform distribution was used. The parameterization resulted in 33516 to 198450 variable combinations for the different RapidEye time steps. This was mainly caused by the small sampling intervals and the differing value ranges of the LAI parameter, since this range is larger in summer than during spring and autumn (see Table 2). These values were stored in look up tables (LUTs) together with the respective calculated reflectances. After calculating the reflectances of these multiple canopy realizations, the model was inverted, i.e. for each pixel of the satellite image the parameter set (including LAI) which produced the reflectances most similar to the reflectances measured by the remote sensing sensor in all bands was selected. Additionally to the original spectral bands, two VIs, namely the ratio vegetation index (RVI, Jordan, 1969) and the Curvature index (Conrad et al., 2012), have been used as input features to invert the RTM. For the inversion a cost function based on the normalized root mean square error (RMSE) was applied and the median of a multiple solution sample (0.5 % of all LUT entries) was extracted as solution.
3.5 Assessment of Management Intensities
In a next step the LAI time series is analyzed regarding their suitability to discriminate four different classes of grassland use intensities:
• ‘Very intensively managed meadows’ that undergo four or more harvests per year,
• ‘Intensively managed meadows’ that undergo two to three harvests per year,
• ‘Intensively managed pastures’ that are alternately grazed and cut, and
• ‘Extensively managed meadows and moor’ that are cut at most once a year due to the framework regulation of
Parameter Unit Min Max Interval
the Natura 2000 directive (Bundesamt für Naturschutz, 2013).
To prevent usage intensity underestimation due to a low number of RapidEye observations, the further analysis are only conducted on areas for which at least seven observation were available, so that theoretically at least one observation is available every three to four weeks. Considering the grassland areas, the available RapidEye data cover 85 % of the study area’s grasslands at least seven times (see green signatures in Fig. 1). For these pixels, basic statistical properties of the LAI time series were derived in order to capture the following characteristics of the differently used grassland areas.
First of all it can be observed that grassland areas on which the human impact is kept small, i.e. extensively managed areas such as moors, flood plains, and fallow lands, show a low LAI variability since neither a quick biomass accumulation nor abrupt LAI decreases take place. This low LAI variability is identified using the standard deviation. In addition to this basic distinction between extensively managed meadows and other management forms, different levels of variability indicate differing numbers of mowing events, enabling the identification of intensively and very intensively managed meadows. Hence, the standard derivation � of each pixel’s time series of the length �= 7 to 9 is derived in order to detect the overall variability of the LAI values:
A measure that is calculated in a similar way is the ‘Mean Absolute Spectral Dynamic (MASD)’ index introduced by Franke et al. (1012). Also in this formula, � is the number of observations, but in addition the observation date � is taken into account for a direct comparison of LAI values to the respective prior value. Thus a distinction between LAI time series with continuously increasing LAI values and fluctuating LAI time series should be improved. The MASD is hence a detailed measure for LAI level changes with respect to the prior condition, i.e. the number of harvests and the strength of a change, and should therefore be useful to distinguish intensively managed pastures from intensively managed meadows which are assumed to be characterized by more abrupt changes. Since MASD was adapted to the usage with LAI values instead of spectral reflectances in this study, it becomes the ‘Mean Absolute LAI Dynamic (MALD)’:
In a last step each pixel’s accumulated productivity should be measured to distinguish meadows and pastures. Since no continuous (e.g. daily) LAI time series exists due to the high spatial resolution, instead of accumulating the single values, the area under curve (AUC) was calculated using a linear trapezoidal method over the � time steps ��:
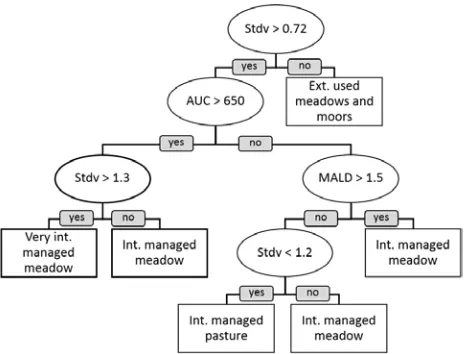
The statistical measures were then used in the rule set of a decision tree in order to classify the grassland use intensities (see Fig. 2). The structure as well as the thresholds applied in the
decision tree have been adapted empirically based on the grassland management types observed at the 20 repeatedly visited field measurement plots (see section 3.2). One advantage of a decision tree is that one class which includes different occurrences due to different evironmental factors or varying harvesting times, such as the ‘intensively managed meadows’, can be identified based on different rule sets.
4. RESULTS AND DISCUSSION
4.1 LAI time series
Based on the above described model set-up of the inverted PROSAIL model a high spatial resolution LAI time series with a maximum of nine LAI measurements (or less in case of cloud occurrence) was generated for the Ammer catchment. The LAI was validated for the four images for which contemporaneous field measurements exist resulting in root mean square errors (RMSEs) ranging from 0.73 and 1.14 and a relative RMSE in the range of 20 - 30 %. A similar error rate is expected for the other five LAI maps since the filed measurements cover the complete growing season.
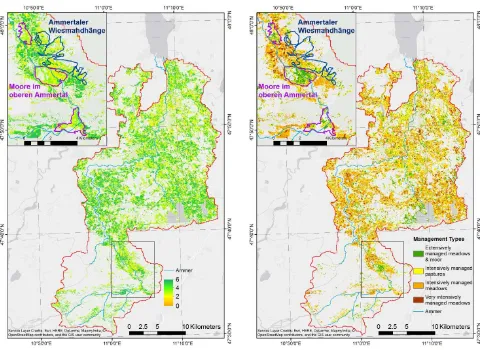
Figure 3 displays the LAI map derived from the September 6, 2011 scene and gives an impression of the landscape structure and spatial variability of LAI. In the mountainous south-western part of the catchment, only few grassland areas exist. They can be distinguished into valley bottom areas with a high LAI, and mountain pastures with overall lower LAI, which are not intensively used due to the topography and climatic conditions. Following the further course of the Ammer River, conventionally managed grasslands with LAI values around 5 can be distinguished from dry and calcareous Natura 2000 habitats such as the ‘Ammertaler Wiesmahdhänge’ or moor areas ‘Moore im oberen Ammertal’ with a comparably lower LAI (Fig.3, upper left zoom). In the alpine foreland to the north, significantly more areas are covered by grassland. These meadows and pastures have an overall higher LAI, as they profit from more nutrient rich soils and higher temperatures. The map also displays the partly strong spatial differences in between fields resulting from different managements.
4.2 Grassland Management Intensities
Since continuous field observations with regard to management intensities were only available at few selected points, and since this information has been used to build the decision tree, only a qualitative accuracy assessment could be conducted in this study
(see Fig. 4). However, from the in situ observations as well as from the spatial patterns of the resulting classification it can be concluded that the different management intensities could be reasonably distinguished. For example Fig. 4 shows that fewer very intensively managed meadows (red signature) are located in the more alpine parts of the study area but in the northern half instead. Also, extensively managed meadows and moors (green signatures) are mapped where they would be expected, i.e. at Natura 2000 sites, at fallow lands e.g. of abandoned gravel pits, and close to lakes and rivers.
Although some redundant information is carried in the standard deviation, AUC, and MALD (the correlation coefficients between the layers range between 0.33 and 0.78), they show different sensitivities for differently managements. Especially the AUC and the standard deviation highlight specific conditions such as an accumulation of biomass on intensively used but not too often cut meadows, or the distinction between fields purely used for fodder generation and those also used for pasturing, which show a lower variability.
Nevertheless, the performance of the presented methodology relies on a precise capture of the moving dates, which in turn highly depends on the coincidence with the acquisition time of the satellite data. Figure 5 illustrates exemplarily the timing of
cutting events with respect to the LAI time series derived from the RapidEye images for the in situ measurement site near Fendt (47°49'58.48"N, 11° 3'38"E). At this site, the dates of the mowing events are derived from a hemispherical camera installed on the site. While the first, third, and fourth mowing are well reproduced, the second and the last harvest remain unrecognized. It can be assumed that the insufficient acquisition Figure 3. Grassland LAI in the Ammer catchment on
September 6, 2011 including a zoom on the grassland sites in the Ammer valley with the Natura 2000 habitats hay meadows (orange outline) and moors (purple outline). While the intensively used grasslands at the valley bottom have LAI values around four to five, the Natura 2000 sites, which are subject to more extensive management, show distinctively lower LAI values.
Figure 4: Map of the derived grassland management types including a zoom on the grassland sites in the Ammer valley with the Natura 2000 habitats hay meadows (orange outline) and moors (purple outline). Pixels for which the LAI time series was shorter than 7 points in time are left blank.
frequency observed on this plot is a limiting factor also on other sites within the Ammer catchment. With two to three harvests normally taking place on very intensively managed meadows in the Bavarian alpine upland between the beginning of June and end of August, as well as one more harvest often scheduled for October, some of these events are very likely unnoticed given the above described time series. This suggests that an acquisition frequency of two to three weeks as well as a time series covering also the month of October are a requirement for a precise mapping of management intensities in the Bavarian alpine upland.
5. CONCLUSION AND OUTLOOK
In this study, the feasibility of very high spatial resolution LAI time series for the assessment of agricultural grassland usage intensities was analyzed. With the LAI providing comparable and physically meaningful measures of vegetation growth and sudden LAI reductions due to harvests, different management types could be distinguished by using statistical time series parameters. The high spatial resolution, allowing for the delineation of every single field and therewith a high pixel purity, enabled an adapted establishment of a decision tree rule set for the small-scaled heterogeneous landscape. However, it was also shown that the used time series has too large gaps during June/July and October to cover every harvest on very intensively managed meadows. While a higher acquisition frequency is preferable, further analysis should also focus on the optimal selection of remote sensing time steps. Also the performance of other vegetation parameters or indices could be tested.
The most important next step however is the establishment of a field observations data base against which the derived categorization can be quantitatively assessed.
ACKNOWLEDGEMENTS
We thank the German Aerospace Agency (DLR) for providing data from the RapidEye Science Archive (RESA) under the RapidEye project 468. This work was supported by the MICMoR research school of the Helmholtz association (http://www.micmor.kit.edu/).
REFERENCES
Asam, S., Fabritius, H., Klein, D., Conrad, C., Dech, S., 2013. Derivation of leaf area index for grassland within alpine upland using multi-temporal RapidEye data, International Journal of Remote Sensing, 34 (23), 8628-8652.
Boschetti, M., Bocchi, S., & Brivio, P. A., 2007. Assessment of pasture production in the ItalianAlps using spectrometric and remote sensing information. Agriculture, Ecosystems and Environment, 118, 267–272.
Breiman, L. 2001. Random Forests, Machine Learning 45(1), 5–
32.
Bundesamt für Naturschutz, 2013. Steckbriefe der Natura 2000 Gebiete. 8431-371 Ammergebirge (FFH-Gebiet). Online available at: http://www.bfn.de/.
Conrad, C., Fritsch, S., Lex, S., Löw, F., Rücker, G., Schorcht, G., Sultanov, M., Lamers, J., 2012. Potenziale des ‘Red Edge’ Kanals von RapidEye zur Unterscheidung und zum Monitoring landwirtschaftlicher Anbaufrüchte am Beispiel des usbekischen Bewässerungssystems Khorezm. In E. Borg, H. Daedelow, R. Johnson (Eds.), RapidEye science archive (RESA). Vom Algorithmus zum Produkt (pp. 203–217). GITO.
Darvishzadeh, R., Skidmore, A., Schlerf, M. and Atzberger, C., 2008. Inversion of a radiative transfer model for estimating vegetation LAI and chlorophyll in a heterogeneous grassland, Remote Sensing of Environment 112, 2592-2604.
Feret, J.-B., François, C., Asner, G.P., Gitelson, A.A., Martin, R.E., Bidel, L.P., Ustin, S.L., Le Maire, G. and Jacquemoud, S., 2008. PROSPECT-4 and 5: Advances in the leaf optical properties model separating photosynthetic pigments, Remote Sensing of Environment 112, 3030–3043.
Franke, J., Keucka, V., Siegert, F., 2012. Assessment of grassland use intensity by remote sensing to support conservation schemes. Journal for Nature Conservation 20 (3), 125 – 134.
Henle, K., Alard, D., Clitherow, J., Cobb, P., Firbank, L., Kull, T., McCracken, D., Moritz, R.F.A., Niemelä, J., Rebane, M., Wascherk, D., Watt, A., Young, J., 2008. Identifying and managing the conflicts between agriculture and biodiversity conservation in Europe – A review. Agriculture, Ecosystems and Environment, 124, 60–71.
Jacquemoud, S., Verhoef, W., Baret, F., Bacour, C., Zarco-Tejada, P., Asner, G., François, C., Ustin, S., 2009. PROSPECT + SAIL models: a review of use for vegetation characterization, Remote Sensing of Environment, 113, 56-66.
Jordan, C.F., 1969. Derivation of leaf-area index from quality of light on the forest floor. Ecology 50 (4), 663–666.
Kurtz, D. B., Schellberg, J., & Braun, M., 2010. Ground and satellite based assessment of rangeland management in sub-tropical Argentina. Applied Geography, 30, 210–220.
Morisette, J., Baret, F., Privette, J., Myneni, R., Nickeson, J., Garrigues, S., Shabanov, N., Weiss, M., Fernandes, R., et al., 2006. Validation of global moderate-resolution LAI products: a framework proposed within the CEOS land product validation subgroup, IEEE Transactions on Geoscience and Remote Sensing 44, 1804-1817.
Mutanga, O., Skidmore, A., Prins, H., 2004. Predicting in situ pasture quality in the Kruger National Park, South Africa, using continuum-removed absorption features. Remote Sensing of Environment 89 (3), 393–408.
Numata, I., Roberts, D. A., Chadwick, O. A., Schimel, J., Sampaio, F. R., Leonidas, F. C., 2007. Characterization of pasture biophysical properties and the impact of grazing intensity using remotely sensed data. Remote Sensing of Environment, 109, 314–327.
Öster, M., Persson, K., & Eriksson, O., 2008. Validation of plant diversity indicators in semi-natural grasslands. Agriculture, Ecosystems & Environment, 125, 65–72.
Richter, R., and D. Schläpfer, 2012. Atmospheric / Topographic Correction for Satellite Imagery: ATCOR-2/3 User Guide”, DLR-IB 565-01/12.
Schaller, L., Kantelhardt, J., Droesler, M., 2011. Cultivating the climate: Socio-economic prospects and consequences of climate-friendly peat land management in Germany. Hydrobiologia, 674, 91–104.
Sullivan, C. A., Skeffington, M. S., Gormally, M. J., & Finn, J. A., 2010. The ecological status of grasslands on lowland farmlands in western Ireland and implications for grassland classification and nature value assessment. Biological Conservation, 143, 1529–1539.
Verrelst, J., Rivera, J.P., Leonenko, G., Alonso, L., & Moreno, J., 2014. Optimizing LUT-based RTM inversion for semiautomatic mapping of crop biophysical parameters from Sentinel-2 and -3 data: Role of cost functions. IEEE Transactions on Geoscience and Remote Sensing 52 (1), 257–269.
Vescovo, L., and Gianelle, D., 2008. Using the MIR bands in vegetation indices for the estimation of grassland biophysical parameters from satellite remote sensing in the Alps region of Trentino (Italy). Advances in Space Research 41 (11), 1764– 1772.
Weiss, M., Baret, F., Myneni, R.B., Pragnère, A. and Knyazikhin, Y., 2000. Investigation of a model inversion technique to estimate canopy biophysical variables from spectral and directional reflectance data, Agronomie 20, 3-22.