ON THE CHALLENGES IN STEREOGRAMMETRIC FUSION OF
SAR AND OPTICAL IMAGERY FOR URBAN AREAS
M. Schmitt a, X.X. Zhu a,b
a Technical University of Munich (TUM), Signal Processing in Earth Observation, 80333 Munich, Germany – [email protected] b German Aerospace Center (DLR), Remote Sensing Technology Institute, 82234 Wessling, Germany – [email protected]
Commission VII, WG VII/6
KEY WORDS: Data fusion, stereogrammetry, synthetic aperture radar (SAR), optical imagery, multi-sensor matching, urban areas
ABSTRACT:
This paper discusses the challenges arising if SAR and optical imagery shall be fused for stereogrammetric 3D analysis of urban areas. In this context, a concept for SAR and optical data fusion is presented, which is meant to enable the reconstruction of urban topography independent of the type of the available data. This fusion is modelled in a voxelized object space, from which 3D hypotheses are projected into the available datasets. Among those hypotheses then the one showing the greatest SAR-optical similarity is chosen to be the reconstructed 3D point. Within first experiments, it is shown that the determination of similarity between high-resolution SAR and optical images is the major challenge within the framework of the proposed concept. After this challenge has been solved, the proposed method is expected to allow 3D reconstruction of urban areas from SAR-optical stereogrammetry for the first time. It is expected to be beneficial, e.g., for rapid mapping tasks in disaster situations where optical images may be available from geodata archives, but instantaneous data can only be provided by daylight- and weather-independent SAR sensors.
1. INTRODUCTION
Currently, we are living in the “golden era of Earth observation”, characterized by an abundance of airborne and spaceborne sensors providing a large variety of remote sensing data. In this situation, every sensor type possesses different peculiarities, designed for specific tasks. One prominent example is the German interferometric SAR mission TanDEM-X, whose task is the generation of a global digital elevation model (Krieger et al., 2007). In order to do so, for every region of interest highly coherent InSAR image pairs acquired by the two satellites of this mission are needed. The same holds for optical stereo sensors such as RapidEye, which additionally require cloudless weather and daylight during image acquisition (Tyc et al., 2005). Eventually, this means that there is a huge amount of data in the archives of which possibly a large potential remains unused, because information currently can only be extracted based within those narrowly defined mission-specific configurations. If, e.g., a second coherent SAR acquisition is not (yet) available, or if one image of an optical stereo pair is obstructed by severe cloud coverage, the mission goal – topography reconstruction – can currently not be fulfilled.
In order to enable the reconstruction of urban topography independent of the type of the available data, this paper presents a concept for stereogrammetric fusion of SAR and optical imagery for urban surface model generation. SAR-optical stereogrammetry was first investigated 25 years ago by the group of Raggam et al. (1990, 1992, 1994) exploiting low-resolution imagery of rural areas and conventional sparse forward intersection as known from classical photogrammetry. In contrast, the fusion presented in this paper is inspired by previous work on multi-aspect multi-baseline InSAR data fusion (Schmitt & Stilla, 2014). In analogy, the stereogrammetric fusion is modelled in a voxelized object space, from which 3D hypotheses are projected into the available datasets. Among those hypotheses then the one showing the greatest SAR-optical similarity is chosen to be the reconstructed 3D point. In this
regard, the determination of similarity between very high resolution SAR and optical images, considering their strong geometric and radiometric differences, is identified to be the main challenge.
2. STEREOGRAMMETRIC FUSION CONCEPT
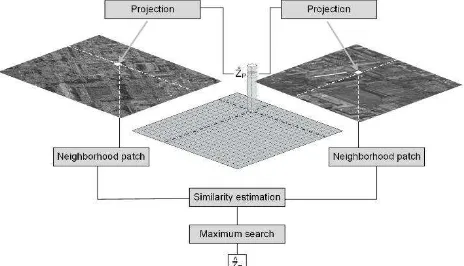
The goal of the proposed stereogrammetric fusion concept is to allow the joint exploitation of arbitrary optical and SAR image data for 3D reconstruction. Its major advantage is that no preliminary coarse registration of the images is necessary, as the matching process is carried out by modelling the imaging geometries of the sensors and connecting homologue image patches via hypotheses in object-space. A sketch of the method is shown in Fig. 1.
Figure 1. Sketch of the object space-based stereogrammetric fusion procedure.
Starting from height hypotheses in the voxelized object space, the corresponding image points are determined by back projection using range-Doppler equations for SAR and central projection equations for optical data. These projected image points can be
The International Archives of the Photogrammetry, Remote Sensing and Spatial Information Sciences, Volume XLI-B7, 2016 XXIII ISPRS Congress, 12–19 July 2016, Prague, Czech Republic
This contribution has been peer-reviewed.
considered hypothetical tie points corresponding to the current height hypothesis. For sake of simplicity, we refer to them as projected tie points (PTPs) in the remainder of this text. Around both PTPs reasonably large image patches are extracted, from which information or features can be extracted, which can then be used for the determination of similarity between the PTPs. Since the whole object space is subdivided into voxels of suitable size (i.e. corresponding to the available image resolutions and the desired accuracy level), a column of height hypotheses is generated for each grid cell. Each element of each column is filled with the similarity value between the patches around the PTPs. In the end, for each column the height hypothesis, which belongs to the maximum similarity value, is chosen as height estimate for the respective grid cell. Thus, in the end a 2.5D height map is created.
3. FIRST EXPERIMENTS
In order to provide a basis for further discussion, some first experiments have been carried out on real spaceborne and airborne test data.
3.1 Test Data
For the experiments presented in this paper, two very high resolution datasets have been used, which have been pre-processed in order to show comparably large, approximately squared pixels.
3.1.1 Optical Imagery:
As an example for modern very high resolution optical remote sensing data, a panchromatic image acquired by the Worldview-2 sensor has been used. The image was acquired on July 22, 2015 with mean off-nadir angle θ = 13.7° and a mean pixel spacing (ground sampling distance) of 0.49 m . A subset of the image is shown in Fig. 2 (a).
3.1.2 SAR Imagery:
Since current spaceborne SAR data still lacks the high degree of details offered by optical imagery of comparable resolution (Stilla, 2007), an airborne SAR image acquired on June 11, 2013 with mean off-nadir angle θ = 55° by the MEMPHIS sensor has been used for testing. MEMPHIS is operated in Ka-band (carrier frequency: 35 GHz, wavelength: 8.5 mm) and provides a resolution of 8.2 cm in azimuth and 16.7 cm in range direction. For further processing, the single look complex MEMPHIS data have been filtered by the nonlocal NL-SAR filter (Deledalle et al., 2015). Afterwards, the resulting despeckled amplitude image was transformed to dB and reduced to approximately square pixels of 50.0 cm in slant range and 47.9 cm in azimuth. The resulting test image is shown in Fig. 3 (a).
3.2 Preliminary Results
The basic working principle of the proposed stereogrammetric fusion concept is demonstrated on an easily distinguishable building of the Ludwig Maximilian University of Munich (LMU). As described in Section 2, height hypotheses from the interval [0m; 30m] above ground level have been projected into both the optical and the SAR image in order to iteratively calculate the similarity values from the PTP patches corresponding to each of the height hypotheses. For this very first study, the similarity was calculated in the following manner:
Step 1:
Each patch (whose size was set to N = 101× 101 pixels in order to incoporporate information of a larger area of about 2500 m²
(a)
(b)
Figure 2. Panchromatic Worldview-2 image with a mean pixel spacing of 49cm. (a) Overview. (b) Detail view.
The red line indicates the projection history of the PTPs. The red cross shows the finally determined tie point.
around each PTP) is transformed to its maximum moment of phase congruency covariance by the algorithm of Kovesi (1999). The corresponding phase congruency images can be seen as an indicator of edge strength based on local frequency information. Therefore, the image patches can be compared based on their edge-based structural content rather than pure radiometric information. An example for the phase congruency images is shown in Fig. 4.
Step 2:
Dense SIFT features (Liu et al., 2011) are calculated for each of the phase congruency patches, as they are invariant with respect to scale, rotation, translation and illumination conditions. This yields a SIFT feature vector fSIFT for each pixel of the image
patch.
Step 3:
The sample covariance matrices COPT and CSAR, respectively, are
calculated from the N feature vectors by
� =1� ∙ � , (1)
×
×
The International Archives of the Photogrammetry, Remote Sensing and Spatial Information Sciences, Volume XLI-B7, 2016XXIII ISPRS Congress, 12–19 July 2016, Prague, Czech Republic
This contribution has been peer-reviewed.
(a)
(b)
Figure 3. Nonlocally filtered SAR image acquired by the MEMPHIS sensor with a mean pixel spacing of 49cm. (a) Overview. (b) Detail view. Azimuth is from left to right, range from bottom to top. Again the red line indicates the projection history of the PTPs and the red cross shows the finally determined tie point.
(a) (b)
Figure 4. Phase congruency images of the PTP patches of (a) the optical image and (b) the SAR image.
where G is a matrix concatenating the N feature vectors. Afterwards, the similarity between COPT and CSAR is determined
by
� = ‖� − �� ‖�, (2)
Figure 5. Similarity function of the height hypotheses from the search interval [0; 30]. The peak located at a height of 24m is marked with a circle.
where ‖∙‖� denotes the Frobenius norm. The resulting similarity function is shown in Fig. 5. It can be seen that the height hypothesis leading to the greatest similarity value is 24 m, although it is notable that the second largest similarity value, which is located at 21 m, is only slightly smaller. The height of the building extracted from Google Earth is approximately 22 m, so that we can consider this a reasonable match. In addition, this shows that the similarity function should be interpolated before peak detection in order to allow off-grid optimization results.
4. DISCUSSION
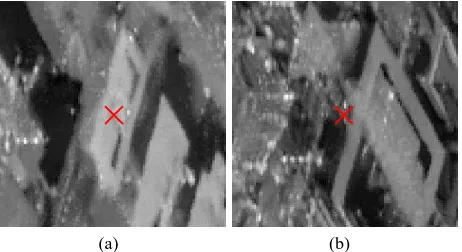
Although the proposed framework eases the non-trivial problem of image matching between optical and SAR images by joining it with the 3D reconstruction step and restricting the search area to very small portions of the original images, still determining the similarity between optical and SAR data remains a critical challenge that will remain at the core of any future research work. While the similarity measure employed in Section 3 of this paper worked for the easily distinguishable LMU building, this needn’t necessarily be the case for other, more complicated structures. An example is shown in Fig. 6. This building belongs to the northern part of the main campus of Technical University of Munich (TUM). Although still of rather regular shape, it is surrounded more densely by other high buildings leading to strongly different appearance in both sensor types.
(a) (b)
Figure 6. A different homologue area, which should be found to be similar in order to match the red crosses in the patch centers. It is obvious that similarity is much harder to be determined here than in the exemplary case illustrated in Section 3.
×
×
×
×
The International Archives of the Photogrammetry, Remote Sensing and Spatial Information Sciences, Volume XLI-B7, 2016 XXIII ISPRS Congress, 12–19 July 2016, Prague, Czech Republic
This contribution has been peer-reviewed.
To illustrate the even more difficult situation when spaceborne SAR imagery is to be used instead of airborne SAR imagery, both example scenes are also extracted from TerraSAR-X data and shown in Fig. 7. These data were acquired in 300 MHz high resolution spotlight mode and were processed with an original pixel spacing of 85 cm in azimuth and 45 cm in range direction. Similarly to the MEMPHIS data, also the TerraSAR-X image was non-locally filtered and converted to logarithmic scale, before the pixel spacing was approximately squared to 85 cm in azimuth and 91 cm in slant range. It is obvious that the process of similarity determination will be even more difficult than in the airborne SAR case.
(a) (b)
Figure 7. The test areas also extracted from a TerraSAR-X high resolution spotlight mode image. (a) The LMU subset. (b) The TUM subset. The red crosses in the patch center should correspond to the red crosses in the optical images shown in Figs. 2 and 6, respectively.
Based on the presented considerations, we can identify three main points for future research endeavours aiming at an operational stereogrammetric fusion of urban areas:
1) Since the degree of details in SAR and optical imagery of comparable resolutions is not similarly comparable, the resolution of the SAR data should be better than the resolution of the optical data for enhanced comparability.
2) Since optical and SAR images are not comparable from a radiometric point of view and also show strongly different imaging geometries causing different projection effects, similarity between the two image types can only be determined from a look at larger structural similarities (e.g. the outlines of clearly distinguishable buildings). It is therefore probably advisable to carry out the matching not in the original image domain, but rather in some feature domain (e.g. in edge images or phase congruency images).
3) Even if the problem of similarity determination is satisfyingly solved, there will probably always be image parts that are not visible in the image of the other sensor, e.g. caused by shadowing or occlusion effects. It will therefore be necessary to exclude such image parts from further processing using a suitable reliability measure.
5. SUMMARY AND CONCLUSION
This paper has discussed the potential of stereogrammetrically fusing SAR and optical remote sensing imagery showing complex urban areas. In order to do so, a concept for backprojection-based voxel space reconstruction has been presented, and preliminary results for the determination of similarity between optical and SAR image patches have been demonstrated. By carrying out the matching and stereogrammetric reconstruction steps simultaneously, the
challenge of determining homologue points in both sensor types is eased to a certain extent. However, it has been shown that similarity determination is still a non-trivial task, which needs to be in the center of future research. This step was shown to be even more challenging for meter-resolution spaceborne SAR imagery than for decimeter-resolution airborne SAR data.
ACKNOWLEDGEMENTS
The authors want to thank Fraunhofer FHR, and University of Zurich (Remote Sensing Laboratories), for providing the MEMPHIS test data, and European Space Imaging for providing the Worldview-2 image. Futhermore, they want to thank Gerald Baier of TUM-SiPEO for filtering the SAR data.
This work is supported by the Helmholtz Association under the framework of the Young Investigators Group “SiPEO” (VH-NG-1018, www.sipeo.bgu.tum.de).
REFERENCES
Deledalle, C.-A., Denis, L., Tupin, F., Reigber, A., Jäger, M., 2015. NL-SAR: a unified non-local framework for resolution-preserving (Pol)(In)SAR denoising. IEEE Transactions on Geoscience and Remote Sensing 53 (4), pp. 2021-2038
Kovesi, P., 1999. Image features from phase congruency. Videre: A Journal of Computer Vision Research 1 (3), pp. 2-26
Krieger, G., Moreira, A., Fiedler, H., Hajnsek, I., Werner, M. Younis, M., Zink, M., 2007. TanDEM-X: a satellite formation for high-resolution SAR interferometry. IEEE Transactions on Geoscience and Remote Sensing 45 (11), pp. 3317-3341
Liu, C., Yuen, J., Torralba, A., 2011. SIFT flow: dense correspondence across scenes and its applications. IEEE Transactions on Pattern Analysis and Machine Intelligence 33 (5), pp. 978-994
Raggam, J., Almer, A., 1990. Mathematical aspects of multi-sensor stereo mapping. In: Proceedings of IEEE International Geoscience and Remote Sensing Symposium, College Park, MD, USA, pp. 1963-1966
Raggam., J., Almer, A., Strobl, D., 1992. Multisensor mapping using SAR in conjunction with optical data. In: International Archives of the Photogrammetry, Remote Sensing and Spatial Information Sciences, Washington D.C., USA, Vol. XXIX, Part B2, pp. 556-563
Raggam, J., Almer, A., Strobl, D., 1994. A combination of SAR and optical line scanner imagery for stereoscopic extraction of 3-D data. ISPRS Journal of Photogrammetry and Remote Sensing 49 (4), pp. 11-21
Schmitt, M., Stilla, U., 2014. Maximum-likelihood estimation for multi-aspect multi-baseline SAR interferometry of urban areas. ISPRS Journal of Photogrammetry and Remote Sensing 87, pp. 68-77
Stilla, U., 2007. High resolution radar imaging of urban areas. In: Fritsch, D. (ed.): Photogrammetric Week ’07: 149–158.
Tyc, G., Tulip, J., Schulten, D., Krischke, M., Oxfort, M., 2005. The RapidEye mission design. Acta Astronautica 56 (1-2), pp. 213-219
×
×
The International Archives of the Photogrammetry, Remote Sensing and Spatial Information Sciences, Volume XLI-B7, 2016 XXIII ISPRS Congress, 12–19 July 2016, Prague, Czech Republic
This contribution has been peer-reviewed.
![Figure 5. Similarity function of the height hypotheses from the search interval [0; 30]](https://thumb-ap.123doks.com/thumbv2/123dok/3281714.1402372/3.595.323.521.69.226/figure-similarity-function-height-hypotheses-search-interval.webp)