www.elsevier.nlrlocaterjappgeo
Application of the Hartley transform for interpretation of gravity
anomalies in the Shamakhy–Gobustan and Absheron oil- and
gas-bearing regions, Azerbaijan
Fakhraddin A. Kadirov
)Department of Geophysics, Institute of Geology, Azerbaijan Academy of Sciences, H. CaÕid pr., 29A, Baku, Azerbaijan
Department of Geophysical Engineering, Black Sea Technical UniÕersity, 61080 Trabzon, Turkey
Received 21 July 1999; accepted 14 April 2000
Abstract
Gravity data acquired in the Shamakhy–Gobustan and Absheron oil- and gas-bearing regions were filtered using a
Ž . w
Hartley transform HT and Butterworth filter. The HT, originally introduced by Hartley Hartley, R.V.L., 1942. A more
Ž . x
symmetrical Fourier analysis applied to transmission problems. Proc. IRE, 30 2 , pp. 144–150 , is an integral transform
Ž .
method similar to the Fourier transform FT with a number of properties being similar to the properties of FT. The HT is a real transform. It is an alternative procedure to the discrete FT since one complex operation is equal to four real operations. The experiments show that the discrete HT is twice as fast as the discrete FT. The power spectrum of the HT analysis of the Bouguer gravity values in the Shamakhy–Gobustan and Absheron regions suggests that a gravity field may be separated into long- and short-wavelength components. The power spectrum indicates a depth of 24.5 km for the long component and 3.2 km for the short one. No relationship has been revealed between the gravity anomalies and the surface tectonics. The regional anomalies are interpreted to be related with elevation and the sinking of the crystalline basement.q2000 Elsevier
Science B.V. All rights reserved.
Keywords: Gravity anomaly; Hartley transform; Power spectrum; Filtering; Oil and gas fields; Absheron peninsula
1. Introduction
Ž . Ž .
Tsimmelzon 1965 and Gadjiyev 1965
studied and interpreted the gravity anomalies of the area using elliptic and quadratic pallets. In
Ž . Ž
this work, a Hartley transform HT Hartley,
)Department of Geophysics, Institute of Geology, Azer-baijan Academy of Sciences, H. Cavid pr., 29A, Baku, Azerbaijan. Fax:q7-99412-97-52-83,q7-99412-97-52-85.
Ž .
E-mail address: [email protected] F.A. Kadirov .
.
1942 has been utilized to determine local and regional gravity anomalies of the Absheron and Shamakhy–Gobustan oil and gas fields. There are similarities between HTs and Fourier
trans-Ž .
forms FTs , however, the former is faster and Ž
requires less computer memory Bracewell,
. 1983; Saatcilar et al., 1990 .
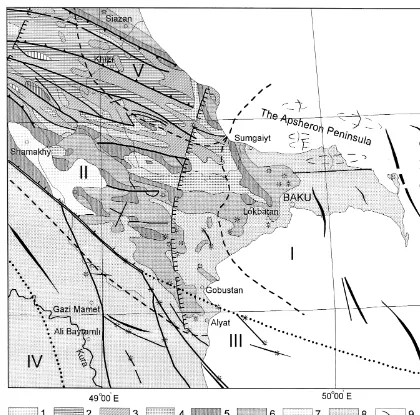
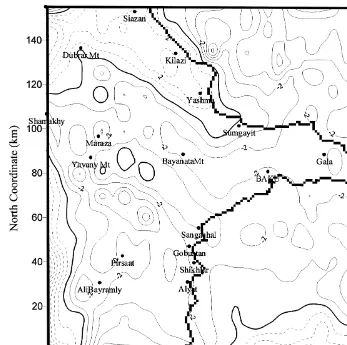
The study area is located in the southeast side of the Great Caucasus mega-anticlinorium. The region has specific geologic structures and tec-tonics. Fig. 1 gives the tectonic and geological
Ž .
scheme of the area Agabekov et al., 1972 . In
0926-9851r00r$ - see front matterq2000 Elsevier Science B.V. All rights reserved. Ž .
Fig. 1. Tectonic and geological scheme of the study area. Alpine geosynclinal sub-complexes: 1 — early geosynclinal epoch
Žg AJ ., late geosynclinal epoch: 2 — lower epoch g AJŽ 1 yK ap , 3 — middle epoch g AK al. Ž 2 yK , 4 — upper.
1 1 – 2 2 3 1 2 1 2
Ž 3 . Ž 1 1.
epoch g AP2 1 – 2 . Alpine orogenesis sub-complexes: 5 — early orogenesis sub-epoch o AP1 3yN , 6 — early orogenesis1
Ž 2 2 2. Ž 3 .
upper epoch o AN1 1yN2 , 7 — late orogenic epoch up to 800 m o AN2 2yQ , 8 — late orogenic epoch 800 m and
Ž .
greater O . Structural elements, fold types and dislocations with a break in continuity: 9 — axes of large anticlinal folds,2
10 — scale-shaped folds, 11 — tectonic nappe, 12 — buried folds, 13 — normal faults with thousands of meters of amplitude, 14 — normal faults with hundreds of meters of amplitude, 15 — crustal faults manifested at the surface by thrusts and overfaults, 16 — buried faults, 17 — thrusts and overfaults with thousands of meters of amplitude, 18 — buried flexure, 19 — mud volcano. Oil- and gas-bearing regions: I — Absheron region, II — Shamakhy–Gobustan region, III — Baku Archipelago, IV — Lower Kura region, V — near-Caspian region.
the region, mud-volcanic and diapir folds are widespread. The Tengi–Beshbarmag
anticlino-rium, Shahdag – Khyzy, Zakatala – Govdag,
Shamakhy–Gobustan synclinoria, Absheron and
the Lower Kura basins are the main tectonic
Ž .
Shamakhy–Gobustan region, some parts of the Baku Archipelago, the Lower Kura and near-Caspian oil- and gas-bearing regions. Intensive subsidence in the Shamakhy–Gobustan syncli-norium began in the Cretaceous and Paleogene periods. The great thicknesses of the Paleo-gene–Neogene deposits and the clearly ex-pressed boundaries of their occurrence, repre-sented in the west by Zangi and in the east by Goradil thrusts, lend support to this subsidence. A comparison of geological and geophysical data from the Shamakhy–Gobustan synclino-rium indicates that the structural features of the Mesozoic and Cenozoic strata are discordant. The synclinorium is considered as a superim-posed trough of complicated structure. Its south-west boundary is made up of the Lengebiz– Alyat anticline zone. The present structure of the Lengebiz–Alyat zone was formed in the late Pliocene–Quaternary period. The Absheron per-iclinal trough is superimposed in character and represents an extreme eastern structural element of the Great Caucasus mega-anticlinorium. In the west, the trough is limited by the Yashma flexure, the origin of which is related to the Cenozoic subsidence of the Caspian basin. As a consequence, substantial sinking of the Ab-sheron peninsula and of the North AbAb-sheron aquatorium, along with the islands and banks, occurred. Simultaneously, the eastern part of the
Ž
Sham akhy – G obustan synclinorium the
.
Jeyrankechmez depression , composed of Paleo-gene and Miocene sediments, was involved in this process.
According to borehole and geophysical data, the depth of the Mesozoic top within the study area varies in the range of 1–10 km. In the central part of the Jeyrankechmez depression, the top of the Paleogene–Miocene complex lies below 3–4 km and that of the Mesozoic is within 8–10 km. The Lower Kura basin is the deepest among the basins of the Kura basin system. The major part of the Lower Kura basin is covered with Quaternary strata. The bound-aries of the Lower Kura basin are the West Caspian fault and the Lengebiz–Alyat rise in
the southwest and northeast, respectively. In the Lower Kura basin, the thickness of the sedimen-tary pile is around 15 km, of which over 8 km is made up of the Pliocene–Quaternary sediments. The study area is an element of the Alpine-folded belt of Eurasia. The Great Caucasus and the Kura basin experienced tectonic evolution spanning the Late Proterozoic to the Anthropo-gene period. In Anthropo-general, three periods are differ-entiated in the geological evolution of Azerbai-jan: Baikalian, Hercynian and Alpine. The area along the Great Caucasus axis and its south slope is supposed to belong to the Paleozoic
Ž .
geosyncline Azizbekov et al., 1972 .
2. Gravity data in the study area
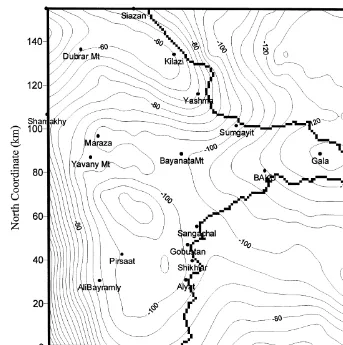
Gravity data obtained in Azerbaijan made it possible to compose a gravity map at a scale of 1:500,000. To build the gravity map, a density
of 2.67 grcm3 was assumed to perform the
Bouguer correction. Gravity observation error
amounts to "0.07–0.1 mGal on land, and
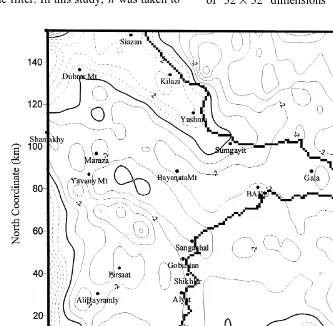
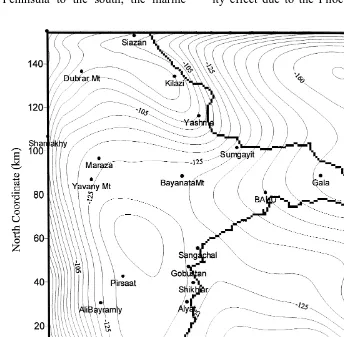
Fig. 2. Bouguer gravity map for the study area. Contour interval is 5 mGal.
anomalies clearly outlined in the map. A com-parison of the Bouguer gravity anomalies with the tectonic and geological scheme of the area suggests no relationship between surface tecton-ics and gravity distribution.
The following are the objectives of the paper:
Ø application of the HT for spectral analysis of the gravity data on the Shamakhy–Gobustan and Absheron oil- and gas-bearing regions and evaluation of the mean depths of discrete density boundaries;
Ø separation of the gravity field into its re-gional and local components using the But-terworth filter;
Ø revealing the impact of the crystalline base-ment on the character of the regional anoma-lies.
3. Theoretical formulation
Ž .
The 2-D HT of a real function f x, y is
defined as:
` `
H u,
Ž
Õ.
sH H
f x , y Cas uxŽ
.
Ž
.
y`y`
=Cas
Ž
Õy d xd y,.
Ž .
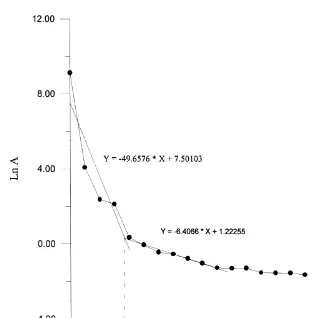
1 where:Fig. 3. Power spectrum of the Bouguer gravity anomaly in the study area.
The inverse transform can be obtained by
Ž .
interchanging the positions of f x, y and
Ž . Ž .
H u,Õ in Eq. 1 and replacing d xd y with
d udÕ as below:
` `
f x , y
Ž
.
sH H
H u,Ž
Õ.
Cas uxŽ
.
y`y`
=Cas
Ž
Õy d ud.
Õ.Ž .
2Ž . Ž . Ž .
Let H u,Õ sE u,Õ qO u,Õ , where
Ž . Ž .
E u,Õ and O u,Õ are even and odd functions
defined as:
` `
E u,
Ž
Õ.
sH H
f x , y cos uxŽ
.
Ž
yÕy d xd y.
y` y`
H u,
Ž
Õ.
qhŽ
yu,yÕ.
s
Ž .
32
and:
` `
O u,
Ž
Õ.
sH H
f x , y sin uxŽ
.
Ž
yÕy d xd y.
y` y`
H u,
Ž
Õ.
yHŽ
yu,yÕ.
s ,
Ž .
42 where
` `
H
Ž
yu,yÕ.
sH H
f x , y CasŽ
.
Ž
yux.
y` y`
=Cas
Ž
yÕy d xd y..
Ž .
5 Ž2-D HTs and FTs are related by Bracewell, 1986; Mohan and Anand Babu, 1994; Saatcilar
. et al., 1990 :
F u,
Ž
Õ.
sE u,Ž
Õ.
yiO u,Ž
Õ.
,Ž .
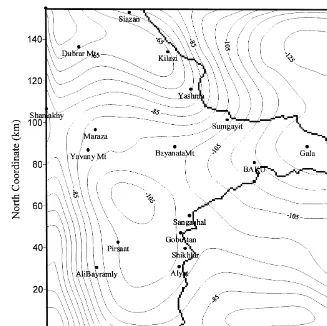
6Fig. 4. Results of the low-pass filtering of the gravity data on the study area using 2-D HT.
Ž . Ž .
where F u,Õ is the FT of f x, y . The
ampli-tude and phase spectra associated with the HT are both physically and mathematically similar to those of the FT but differ numerically. In general, the amplitude spectra of the FT and HT give the same information. The 2-D discrete HT
Ž . Ž .
of an image f x, y represented by an M=N
Ž . matrix is defined in accordance with Eq. 1 as
Ž .
below Sundararajan, 1995 :
My1 Ny1 1
X u,
Ž
Õ.
sÝ Ý
f x , y Cas uxŽ
.
Ž
.
MN xs0 ys0
=Cas
Ž
Õy ..
Ž .
8Its inverse is given as below: My1 Ny1
f x , y
Ž
.
sÝ Ý
H u,Ž
Õ.
Cas ux CasŽ
.
Ž
Õy ..
us0 Õs09
Ž .
Ž .
The results obtained from Eq. 10 are
rear-Ž .
ranged to get the 2-D HT by Rao et al., 1995 : 1
H u,
Ž
Õ.
s X u,Ž
Õ.
qX MŽ
yu,Õ.
2qX u, N
Ž
yÕ.
yX MŽ
yu, NyÕ.
for u/0,Õ/0
Ž .
10and:
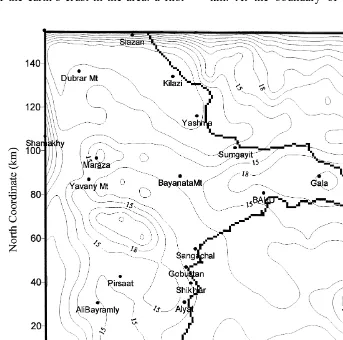
Fig. 5. Results of the high-pass filtering of the gravity data on the study area using 2-D HT. Dashed and solid lines show positive and negative local anomalies, respectively.
The Hartley amplitude coefficients are calcu-lated from positive and negative coefficients as given below:
1r2
2 2
H
Ž
u,Õ.
qHŽ
Nu,Mv.
A u,
Ž
Õ.
sŽ .
11 2for Nu and MÕ defined as:
Nusu
MvsÕ for us0 andÕs0,
Nusu
12
Ž .
MvsMyÕ for us0 andÕ/0,
NusNyu
MvsÕ for u/0 andÕs0.
With these coefficients, even and odd Hartley coefficients can also be calculated.
H u,
Ž
Õ.
qH Nu,MvŽ
.
E u,
Ž
Õ.
s2
13
Ž .
and:
H u,
Ž
Õ.
yH Nu,MvŽ
.
O u,
Ž
Õ.
s . 2Ž . Ž .
E u,Õ and O u,Õ are even and odd Hartley
coefficients, respectively. The Hartley ampli-tude and phase spectrum values can be calcu-lated with these coefficients as shown below:
1r2
2 2
O u,
Ž
Õ.
Q
Ž
u,Õ.
sarctan y ,Ž .
14E u,
Ž
Õ.
Ž . Ž .
where A u,Õ and u u,Õ are the amplitude and
phase spectra of the HT.
To separate regional and residual anomalies of the Bouguer gravity field, HT and
Butter-Ž .
worth filters are used Kulhanek, 1976 . The
ˆ
ideal low-pass Butterworth filter is given by: 1
HB
Ž .
k s ,Ž .
15 2 nk
1q
)
ž /
kcwhere ks2prl is the wave number, kcs
2prlc is the cut-off wave number and n is the degree of the filter. In this study, n was taken to
be equal to 1. The procedure of filtering is: using the HT transform, the gridded gravity data are converted to space-frequency Hartley do-main. In this domain, row by row followed by column by column Butterworth filters are ap-plied using a suitable cut-off frequency. Then, the produced filters are multiplied by the spec-trum of data in the Hartley domain. Finally, by taking the inverse transform, we return to the space domain.
4. Application to real data
The HT was applied to the gravity data grid
of 32=32 dimensions with grid spacing at
every 5 km in the study area. The calculated power spectrum curve is displayed in Fig. 3. The power spectrum of the gravity data shows a cut-off wave number separating two domains of high- and wavelength information. The low-and high-wave number parts of the power spec-trum, associated with deep and shallow gravity sources, were taken as representing the regional and residual anomalies, respectively. Two linear segments shown on the plot are suggestive of the existence of discrete density boundaries, with the slopes being the estimates of their
Ž
mean depths Bhattacharyya, 1966; Spector and .
Grant, 1970 . The present power spectrum indi-cates a depth of 24.5 km for the long-wave-length component and a depth of 3.2 km for the short wavelength component. These depth val-ues are well-correlated with the results of seis-mic studies previously carried out in the region. The cut-off wave number is determined by the crossing point of fitted straight lines approx-imating the power spectrum data in the high-and low-wavelength domains. A cut-off wave
number of k s0.142 kmy1 is found from the
c power spectrum.
Fig. 4 shows the results of low-pass filtering
arranged for a k s0.142 kmy1 wave number.
c
The gravity low north of Absheron is preserved in the regional Bouguer anomaly map. The re-sults of the high-pass filtering process are pre-sented in Fig. 5. A large positive anomaly is
Ž
evident northwest of the region from Sumgayit .
to Siazan , the so-called Dubrar positive
anomaly. A maximum local anomaly value of 7 mGal is noted in the Kilazi locality. Another extensive positive anomaly lies parallel to the Great Caucasus axis covering an area from the Yavany Mt. to Sangachal, where the highest value is equal to 3 mGal. In the southwest, a large positive anomaly located within the Kura Plateau is noted. The Absheron–Central
Gobus-Ž .
tan negative anomaly as low as y7 mGal is
seen to the east and south of the Dubrar Mt. positive-anomaly region. The Absheron nega-tive anomaly extends towards the north. A row of closed negative anomalies begins from
Gob-ustan and goes towards Shamakhy. The results of the high-pass filtering through the FT are displayed in Fig.6. As can be seen, the contours presented in Figs.5 and 6 are very similar.
5. Model of basement and its gravity effects in the study area
The depth occurrence of the pre-Mesozoic crystalline basement surface has been studied with the aim of interpreting the gravity anoma-lies in the Absheron and the Shamakhy– Gobustan regions. The density-vs.-depth rela-tionship in the part of the earth’s crust overlying
the crystalline basement can be approximated
Ž .
by a quadratic function Bhaskara Rao, 1986 :
Dr
Ž .
z sa qa zqa z2,Ž .
160 1 2
where z represents the depth, measured positive
in the downward direction, a0 represents the
extrapolated value of the density contrast at the surface, and a and a are the constants of the1 2 quadratic function. The constants are first solved by the least squares method on the data of
Ž density available from borehole profiles down
.
to 5 km and other geophysical information
sources.
The geological, geophysical and borehole in-formation available suggest a general four-layer structure of the earth’s crust in the area: a first
layer of Cenozoic deposits with a density of rs2.20–2.40 grcm3; a second one of Meso-zoic deposits, rs2.60–2.72 grcm3; a third
one of metamorphic and granite rocks, rs
2.66–2.85 grcm3; and the fourth one of basaltic 3 Ž
rocks, rs2.90 grcm Gadjiyev, 1965;
.
Volarovich et al., 1966 . The thicknesses of these layers vary substantially over the region, making up around 42 km in total.
In the study area, a considerable density con-trast of y0.35 grcm3 at a 2-km depth within the Neogene complex is documented by bore-hole survey. The next density contrast ofy0.27 grcm3 occurring at the Cenozoic and Mesozoic boundary is located at an average depth of 5 km. At the boundary of the crystalline
ment, occurring at an average depth of 15 km, the density contrast is taken to be equal to
y0.15grcm3. Besides the layered model is the included density contrast at the boundary of the
Ž 3.
low-velocity zone y0.40 grcm .
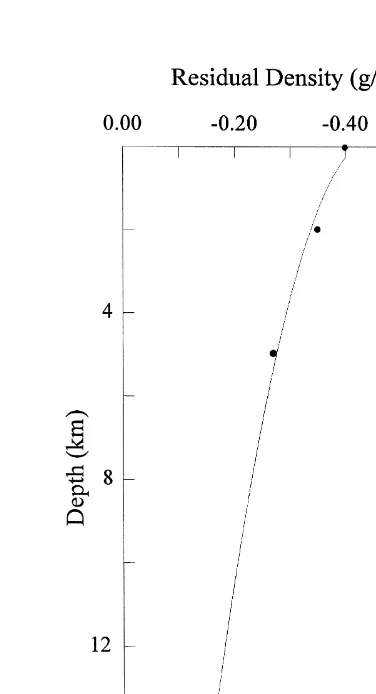
Taking the mean thicknesses of the Cenozoic and Mesozoic as equal to 5 and 10 km, respec-tively, with the density contrast between them at
y0.27 and y0.15 grcm3 at the surface of the
crystalline basement, a density-vs.-depth
quadratic relationship has been established. The
values so obtained are a0s y0.4009, a1s
0.03091, and a2s y0.00094. This
approxima-tion funcapproxima-tion is graphically shown in Fig. 7. Deep sounding of the subsurface with seis-mic methods shows that from the north of the Absheron Peninsula to the south, the marine
continuation of the Jeirankechmez depression, the thickness of the Pliocene deposits progres-sively increases. These deposits have the lowest density, being within 2.0–2.2 grcm3 on aver-age. Such a north-to-south trend in thickness, with quiescent bedding of the underlying strata, must be accompanied by a decrease of the gravity field in the same direction. At a distance of 50 km, the thickness of the Pliocene unit grows to as large as 7 km. With an average of
0.3-grcm3 density difference between the
Pliocene and the underlying strata, a 7-km-thick unit must provide a negative gravity field of 89 mGal. However, observed anomalies of the gravity field in the Bouguer reduction in the indicated direction increase. The negative grav-ity effect due to the Pliocene complex is
pensated for by a positive gravity effect caused by the southward elevation of the denser rocks ŽGadjiyev, 1965 . Thus, an increase in the thick-. ness of the young deposits is accompanied by elevation of the denser and older complexes. By subtracting the linear regional effect of 30 mGal due to the elevation of the denser and older rocks from the map of the gravity field anomaly in the Bouguer reduction, we obtain a ‘‘resid-ual’’ gravity map of the study area. The depth
Ž .
map of the basement Fig. 8 is estimated from the inversion of the ‘‘residual’’ gravity field
Ž .
constrained with the density model Fig. 7 by Ž
using the GR3DSTR program Bhaskara and
.
Ramesh, 1991 . Calculations for the basement depth maps were performed at specified 10 iterations. The recalculated gravity effect based
Ž .
on the depth-to-basement map Fig. 8 is dis-played in Fig. 9. Apart from the regional shift of 30 mGal, the map agrees well with the regional-anomaly map. As can be seen, higher values on the map correspond to the Yavany Mt.-Alyat area where the mean depth is around 23 km. The mean depths in the Absheron penin-sula and the Dubrar zone are 20 and 6 km, respectively. The data presented are well-corre-lated with the results of seismic exploration
ŽGadjiyev, 1965; Aksyonovich et al., 1962;
.
Radjabov, 1978 . Comparison of the Bouguer-gravity-anomaly maps, regional-anomaly map and calculated gravity anomalies with regard to the above reduction shows that a major part of the regional anomaly is due to the crystalline basement.
6. Conclusions
Using complex numbers is unavoidable when the FT is applied to real geophysical measure-ments. The real HT does not require operations with complex numbers, being in this way a better alternative to the FT. The results obtained by applying both transforms are in good agree-ment.
Analysis of the gravity field power spectrum for the Absheron and the Shamakhy–Gobustan regions allows estimation of the average depths of sources varying from 24.5 to 3.2 km. A depth of 24.5 km is associated with the crystalline basement surface, and that of 3.2 km with a surface within the Cenozoic deposits.
The maximum depth of subsidence of the
Ž .
crystalline basement 23 km is noted in the area of Yavany Mt.–Pirsaat–Gobustan and around Gala. In the zones of Dubrar Mt. and Yavany Mt.–Sangachal, the crystalline base-ments occurs at 6 and 12 km, respectively.
The major part of the regional anomalies is caused by the topography of the pre-Mesozoic crystalline basement.
Acknowledgements
I would like to thank H. Karsli and N. Maden of the Black Sea Technical University, Turkey, for their support in the computing and in the preparation of the manuscript. I also thank M. Tagiyev of the Geology Institute of Azerbaijan for his assistance in the preparation of the En-glish version of the manuscript.
References
Geological State Committee, Geology Institute, Azerbaijan Academy of Sciences, Agabekov, M.G., Azizbekov, Sh.A., Akhmedbeyli, F.S., Gadjiev, T.G., Grigoryants, B.V., Mamedov, A.V., Shikalibeyli, E.Sh., 1972. Tec-tonic scheme of Azerbaijan, 1:1,000,000. In:
Az-Ž .
izbekov, Sh.A. Ed. , Geology of the USSR, Azerbaijan
Ž .
vol. XLVII Nedra, Moscow, in Russian .
Aksyonovich, G.I., Aronov, L.E., Galperin, E., Kosmin-skaya, I.P., Gegelgants, A.A., 1962. Deep Seismic Sounding in Central Part of the Caspian Sea. Publishing
Ž
House of USSR Academy of Sciences, Moscow, in
.
Russian .
Azizbekov, Sh.A., Agabekov, M.G., Grigoryants, B.V., Shikalibeyli, E.Sh., Mamedov, A.V., 1972. The history
Ž .
of the geological evolution. In: Azizbekov, Sh.A. Ed. , Geology of the USSR, Azerbaijan vol. XLVII Nedra,
Ž .
Bhaskara Rao, D., 1986. Modelling of sedimentary basins from gravity anomalies with variable density contrast.
Ž .
Geophys. J. R. Astron. Soc. 84 1 , 207–212.
Bhaskara Rao, D., Ramesh Babu, N., 1991. A fortran-77 computer program for three-dimensional analysis of gravity anomalies with variable density contrast. Com-put. Geosci. 17, 655–667.
Bhattacharyya, B.K., 1966. Continuous spectrum of the total magnetic anomaly due to a rectangular prismatic body. Geophysics 31, 97–121.
Bracewell, R.N., 1983. Discrete Hartley transform. J. Opt. Soc. Am. 73, 1832–1835.
Bracewell, R.N., 1986. The Fourier Transform and Its Applications. McGraw-Hill Book Co., New York , 474 pp.
Gadjiyev, R.M., 1965. Deep Geologic Structure of
Azer-Ž .
baijan. Azerneshr, Baku, 205 pp. in Russian . Hartley, R.V.L., 1942. A more symmetrical Fourier
analy-Ž .
sis applied to transmission problems. Proc. IRE 30 2 , 144–150.
Kulhanek, O., 1976. Introduction to Digital Filtering inˆ
Geophysics. Elsevier, Amsterdam, 169 pp.
Mohan, N.L., Anand Babu, L., 1994. A note on 2D Hartley transform. Geophysics 59, 1150–1155. Radjabov, M.M., 1978. Study of the structure of the
earth’s crust-consolidated complex of the Azerbaijan using deep seismic sounding and refracted wave-corre-lation method data. The Structure of the Earth’s Crust
and Upper Mantle in the Central and East Europe.
Ž .
Naukova Dumka, Kiev, pp. 205–211, in Russian . Rao, B.N., Rama, K.P., Markandeyulu, A., 1995. Mapros
— a computer program for basement mapping and filtering of gravity and magnetic data using a Hartley transform. Comput. Geosci. 22, 197–218.
Saatcilar, R., Ergintav, S., Canitez, N., 1990. The use of the Hartley transform in geophysical applications. Geo-physics 55, 1488–1495.
Shikhalibeyli, E.Sh., 1972. Location of Azerbaijan in gen-eral structure of the Caucasus and surrounding folded
Ž .
region. In: Azizbekov, Sh.A. Ed. , Geology of the USSR, Azerbaijan vol. XLVII Nedra, Moscow, pp.
Ž .
286–290, in Russian .
Spector, A., Grant, F.S., 1970. Statistical models for inter-preting aeromagnetic data. Geophysics 35, 293–302. Sundararajan, N., 1995. 2-D Hartley transforms.
Geo-physics 60, 262–267.
Tsimmelzon, I.O., 1965. Geological interpretation of the local gravity anomalies of the Absheron peninsula and the Near-Caspian region. Explor. Min. Geophys. 38,
Ž .
13–24, in Russian .
Volarovich, M.P., Bayuk, E.I., Salekhli, T.M., Guseynov, F.G., 1966. Compressional wave velocities in sedimen-tary rocks of Azerbaijan under confining pressures to 4000 kgrcm2. Transactions of Institute of the Earth’s
Ž
Physics vol. 37 Nauka, Moscow, pp. 130–139, 204, in
.