*Corresponding author. Tel.:#44-161-295-5000; fax:# 44-161-295-5559.
E-mail address:[email protected] (W. Wang).
A data de"ciency based parameter estimating problem and case
study in delay time PM modeling
A.H. Christer, C. Lee, W. Wang*
Centre for OR and Applied Statistics, University of Salford, Salford M5 4WT, UK
Abstract
This paper describes a modeling study of preventive maintenance (PM) policy of production plant in a local company with a view to improving current practice. The model developed is based upon the delay time concept where because of an absence of PM data, the process parameters and the delay time distribution were estimated from failure data only using the method of maximum likelihood. Particular attention is paid to the problem arising during the parameter estimating process because of the inadequate recording of PM data and the implied correlation between model parameters. An objective estimation process has been adopted here as far as possible. The case of data de"ciency explored in the study is important because it is a relatively general situation in practice. An inspection model is"nally proposed to identify the best inspection policy based upon the estimated model parameters and the delay time distribution. It is concluded that the company has other problems to attend to before the inspection problem is "nally solved, and a structured review of maintenance engineering practice is recommended. 2000 Elsevier Science B.V. All rights reserved.
Keywords: Delay time modeling; Preventive maintenance; Parameter estimation; Modeling
1. Introduction
This paper reports on a maintenance and inspec-tion study of Tea bag producinspec-tion lines with a local company. At the time of the study, a planned main-tenance (PM) system was operated consisting of regular inspections with corrective actions as required. Here, we regard PM as a joint service and inspection activity. Of interest to management was whether or not the existing PM practice contrib-uted to reducing downtime, and whether or not
a more appropriate PM schedule was possible. To establish the relationship between PM and operat-ing measures such as downtime, the delay time concept has been used; see the works of Christer and Waller [1] and Christer [2]. The delay time concept regards the failure process as a two-stage process with the"rst stage being when a detectable
defect arises, and the second stage when the defect leads to a failure. The time lapse from the time of
the "rst possible identi"cation of a defect to the
point of a repair being essential is called the delay time. If an inspection is carried out during the delay time period of a defect, the defect may be identi"ed
and removed.
One of the key issues in the delay time model of preventive maintenance is the estimation of the
Fig. 1. A#owchart of the production process of a tea
produc-tion line.
Table 1
The PM plans of the P1 production line
Lines Machine PM period PM downtime (h)
P1 IMA 5/6 weekly 8
3 monthly 16
ME 5/6 weekly 8
Europack 5/6 weekly 8
delay time parameters which are usually the rate of occurrence of defects, the distribution of underlying delay time h of a defect, and the probability of identifying and removing a defect at PM. Applied studies using the delay time concept within indus-trial situations in which the model parameters are estimated from the synthesis of subjective opinions of maintenance engineers have been reported [1,3}5]. A recent development in delay time
modeling has established that these parameters can also be adequately estimated using objective data obtained from maintenance records of failures and records of defects found at PM [6,7]. For complex machinery with many components, some modeling has been carried out for actual plant using the delay time concept with objective estimation of para-meters [8,9]. This study attempts to use the objec-tive estimation technique, but with failure data only, and not failure and PM data.
We are particularly interested in this applied study because it is a useful vehicle to address a com-mon parameter estimation problem that arises when inadequate records of PM activities are kept.
2. The production plant and maintenance practice
The Tea pack production plant consists of four main production lines, called Pl, N1, N2 and N3. The P1 line consists of the following three primary machines, the IMA machine, the Marden Edwards and the Europack. N1, N2 and N3 production lines also have similar types of machines. The"rst stage
of the production process is the IMA machine which forms a continuous tea bag strip. Here tea bag paper runs on a continuous belt with tea drop-ping onto the paper, and the strip is cut and sealed into separate tea bags by the Marden Edwards machine. These bags are shrunk, packed in boxes and wrapped by Europack machine. Finally, prod-ucts are moved by a conveyor system to the storage depot. A#ow chart of the production process of the
P1 line is shown in Fig. 1.
The company has two di!erent planned
preven-tive maintenance schedules, the"rst operates every
5/6 week and lasts 8 hours, and the second, called the extended maintenance plan, is for the IMA machine only and runs every 3 month with 16 hours
downtime. This additional attention is because the IMA machine is a more complicated high-speed machine. The PM plan of the production line is shown in Table 1 and includes routine maintenance and inspection. However, no record is kept of PM activity other than the date; information such as the number of defects identi"ed and repaired is
current-ly not recorded. Essentialcurrent-ly, vital factual informa-tion needed to quantify the impact of PM is lost. This is not an uncommon observation, but imposes a problem in model parameter estimation, which will be discussed later.
3. The maintenance data
Two sources of data are available from company records. One is a spread sheet "le which includes
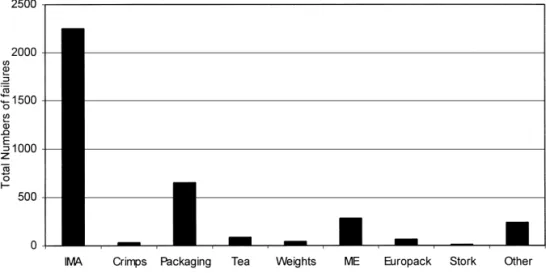
Fig. 3. Downtimes of P1 line. Fig. 2. Failure frequency of P1 line.
major breakdowns. This information is, however, included in the spreadsheet data set.
All stoppages per shift are recorded by the pro-duction line operator for the spread sheet"le. These
data include the planned downtime, the routine production stoppages, and unexpected stoppages. These data are used to calculate the company's
pro-duction e$ciency. The plant operates 24 hours a day
(three shifts), 5 days per week, with sometimes an extra 12 hours of production on Saturday or Sunday. In this study, we focus on the key machines in the P1 line as a pilot study, since the other lines have a similar structure.
4. Failure data analysis
The failure data from the spreadsheet is available over an 11 month period. It consists of the failure mode, downtime periods during each hour of each shift, the date and the plant operator's name. Figs. 2
and 3 below show the major failure areas of P1 line. The detailed data can be found in Appendix A.
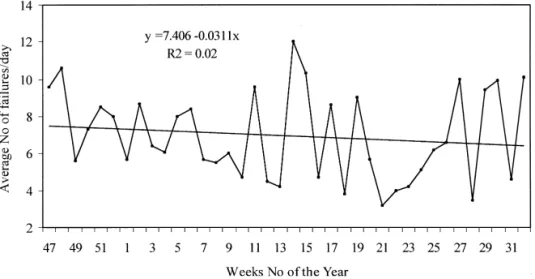
Fig. 5. Trend analysis of IMA downtime data since the start of PM. Fig. 4. Trend analysis of IMA failure data since the start of PM.
accounts for 61.5% of total breakdowns and 55.6% of the total downtime for the production line. In the remainder of this paper, we concern ourselves with only the IMA machine of the P1 line since most failures have occurred on this machine.
Figs. 4 and 5 show the average number of failures and downtime since the beginning of the data col-lection period of the IMA machine. Based upon
at-test, we accept the hypothesis that the failure occurrence rate per week is constant from the data of Fig. 4. The same is true for the data of Fig. 5. These"ndings are important since a constant
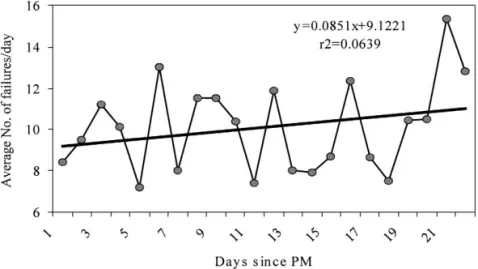
Fig. 6. The e!ectiveness of PM for the IMA.
Fig. 7. The e!ectiveness of PM for the IMA.
We wish to investigate whether or not the 5/6 weekly PM has any e!ect in reducing failures.
Given e!ective PM, it is expected that the number
of failures per day would have an increasing trend following the last PM. An indication of the e!
ec-tiveness of PM for the IMA machine is shown in Figs. 6 and 7. It can be seen that the number of failures of the IMA machine increases slightly, but the average downtimes decrease since the last PM. It would, however, not be correct to imply from these "gures that the PM performed for the IMA
might be e!ective in reducing the number of
fail-ures, but not in reducing the downtime due to failures. An evident trend line is exaggerated by scale, and the trend in Figs. 6 and 7 are actually
very weak, which suggests that the PM might be imperfect in that some defects present are not recognised and cause subsequent failures. Based upon a t-test we accept the hypothesis that the average number of failures per day and average downtimes per day since the last PM of the IMA machine are both constant and, as in the case of Figs. 4 and 5, the trend lines of Figs. 6 and 7 may be assumed to have zero slope, see Table 4 in Appendix B for details.
5. General model assumptions
The "rst objective of this study is to build a
statistical model describing the operating process under which the data was recorded, which is used to estimate the parameters of the delay time model, e.g. the defect arrival process and the delay time distribution. Having a delay time model for the process by which defects and failures arise, a maintenance model for decision-making may be constructed. Based upon the data analysis and previous experience, Christer [2], the following assumptions are proposed for the estimation model.
P(t,t#*t"u)" (b) Defects are assumed to arise independent of
each other.
(c) The delay time of a failure is independent of its origin and has pdf f()) and cdf F()).
Assumptions (b) and (c) are common in delay time modeling since they greatly simplify the modeling work and have been validated by real-world observations.
(d) Inspections carried out at PM are assumed to be imperfect in that a defect present can only be identi"ed with a probabilityr. Also, the
prob-ability of detection of a defect is independent of the number of times it may have been pre-viously inspected and not detected. Assump-tion (d) recognises that inspecAssump-tion work during PM might be imperfect. The simpler assump-tion of perfect inspecassump-tion is inconsistent with the observation of a more or less constant failure rate after PM.
(e) All identi"ed faults are recti"ed by repairs or
replacements during the time of the PM. (f) Failures are identi"ed immediately, and repairs
or replacements are made as soon as possible.
Assumptions (e) and (f) embody the mainten-ance practice currently adopted.
6. Parameter estimation
6.1. Likelihood formulation
It is assumed for the moment that observations of the number and downtime of failures, and of the number of defects identi"ed and removed at PM
are available. We de"ne the notation for modeling
the likelihood of this data. We use the following notations:
j the rate of occurrence of defects within the system.
h the delay time of a fault with pdf
f()) and cdfF()).
r the probability of detecting a defect at PM, if it is present.
t
G time of thei"1, 2, ith PM from new,
2,n,2 t failure time from new.
*t a time period to be de"ned.
In the above notation, we assumet
L\(t)t
L.
Consider the probability of a failure over (t,t#*t) resulting from a defect arising at time u,u(t, that is,P(t,t#*t"u). The defect could have
arisen since the last inspection,t
L or during several
inspection periods before, but have not been detec-ted, see Fig. 8.
We have [9] that
The mean number of failures over (t,t#*t), for t
L\(t)t
L is, therefore, given by
Fig. 8. The failure process of a defect arising in (t G\,tG).
Changing the variable of integration and rearrang-ing the sequence, after some manipulation we have for the expected number of failures over period (t,t#*t),
In a similar way, it is seen that the expected number of defects found at PM timet
L, EN(tL), is given by
(see also Christer and Wang [9]). Since these de-fects are assumed to arise according to a Poisson process, as a generalization of Proposition 3.3.2 in Ross [10], the number of failures in (t,t#*t) also
follows a Poisson process [9]. Therefore, the prob-ability of m failures over (t,t#*t), where
It can be shown [9] that the number of defects identi"ed and removed at PM also follows a
Pois-son distribution, and we have
P(ndefects identi"ed and removed att L)
"[EN(tL)]Le\#,
RL
n! . (6)
If the observed events are the number of failures in each working day and the number of defects
identi-"ed at PM times, the likelihood function of the
observed events may be formulated in the following way. Suppose thatn
Gdefects have been observed at
theith PM time (n"1, 2,2,l), and the PM
inter-val (t
L\,tL) is now divided intoknon-overlapping
subintervals of equal length*t, as 1 day, namely,
ILH"[t
the mean number of failures occurring in ILH over (t
LH denote the number of failures
occur-ring in ILH, over (t
L\,tL) and let mL denote the
defects identi"ed and removed att
L. We have from
The likelihood function for these observations is, therefore,
¸"J
L
(P(m
Ldefects identi"ed and removed att L)
;I
H
P(m
Substituting from Eqs. (9) and (10) into Eq. (11), and taking the logarithm, we have that
Log¸
wherelis the number of PMs.
6.2. Results of the modelxt
In this study, we seek to"t a model to the data
from the IMA plant. Possible models forf()) could
be exponential or mixed delta-exponential, or Weibull or mixed delta-Weibull distribution. In this study, we consider 4 models for the delay time distribution, that is (1) exponential, (2) mixed exponential, (3) Weibull and (4) mixed delta-Weibull distribution. Previous studies have shown that the negative exponential and Weibull distribu-tions to be appropriate [2], and are therefore adopted here. Other options are always possible. If the above chosen models do not produce a good"t
to the data, the search would need to continue. The reason to choose a mixed delta distribution is the possibility that some defects may have a zero delay time, while other defects have a stochastic delay time. This situation may be modeled by the mixed delay time distribution with a pdf. Given by (1!p)f(h)#pd(h), where f(h) is the pdf. of the
non-identically zero delay time h,d(h) is the Dirac delta function, and pis the proportion of defects that have zero delay time.
Eitherway, we have a problem when"tting the
likelihood formulation to the data. Since PM data is not available, the likelihood function does not converge for 3 out of 4 of the targeted distributions, namely exponential, the mixed delta-exponential and Weibull. The reason for this is the strong cor-relation between model parameters when the PM data is not available, particularly betweenrand the rest of parameters. For example, a pro"le of failure
could be attributed to relatively highjandrvalues, or relatively low j and r values. This problem
would not have arisen had of the inspection data had been available. The problem may be solved by
"xingrat an appropriate level and maximizing the
likelihood function in terms of the other para-meters. This shifts the problem to deciding the value ofr, which is usually done using a subjective survey technique. Here, we adopt the one value of
rthat was obtainable from the likelihood function in the one case that converged, i.e.,r"0.071. This
seemed very low to the authors, but we accept it for now and return to it later.
In maximum log likelihood estimation, the good-ness of "t of values of parameters of a speci"c
model may be measured by the expected log hood, namely, the larger the expected log likeli-hood, the better is the"t of model of parameters.
The log likelihood is usually regarded as an estimator of expected log likelihood. The para-meters set that maximizes the likelihood is not necessarily the best"t to the data, since the more
parameters one has, the larger the likelihood func-tion can become. Because of this, the choice of the distribution from a family of plausible distributions for h is made using the criterion of minimum Akaike Information Criterion (AIC) [6]. AIC is derived under the assumption that the true distri-bution can be described by the given model when its parameters are suitably adjusted. A model which minimizes the AIC is considered to be the most appropriate model:
AIC
"!2x(maximum log likelihood of the model)
#2x(number of free parameters of the model).
Although the value of the AIC may be the lowest of the options considered, if the chi-squared test for a goodness of"t is not acceptable at some signi"
-cance level, the chosen model may be invalid. For this reason we also need to consider the chi-squared goodness of"t test, which is given by
s" I
where the range of data is divided intoksuitable classes, n
Table 2
Models and"tted values of parameters based upon IMA machine data
Models Exponential
distribution
Mixed
delta-exponential
Weibull distribution
Mixed delta-Weibull
ROCOD (jK) 9.518 9.745 9.535 9.853
Scale (a() 1.816 1.816 6.981 1.223
Shape (bK) 1.482 15.326
p( 0.023 0.032
r 0.071 0.071 0.071 0.071
Maximum log likelihood !1118.138 !1118.138 !1119.995 !1116.282
s 2.135 3.790 2.226 5.098
AIC 2240.276 2242.276 2245.990 2242.564
pis the proportion of zero delay times in the model, ROCOD is the rate of occurrence of defects,ris the probability of a defect identi"ed and recti"ed at PM.
Denotes the optimal choice for the criterion.
Fig. 9. Histogram of failures for IMA.
class, andn(
Gis the expected number of events in the
ith class calculated from the"tted model. IfN
(IH)
denotes the observed number of failures in thejth class, using Eq. (13), thechi-squaredtest statistic in our case is simply
s" I
G
(N
(IH)!EN (IH))
EN(IH) , (14)
and the number of degrees of freedom is k!v,
wherevis the number of model parameters.
Givenr"0.071, Table 2 shows the"tted values
of parameters, their AIC values and the results of chi-squared test statistic. From Table 2, exponen-tial distribution is selected as having the lowest AIC andsstatistic.
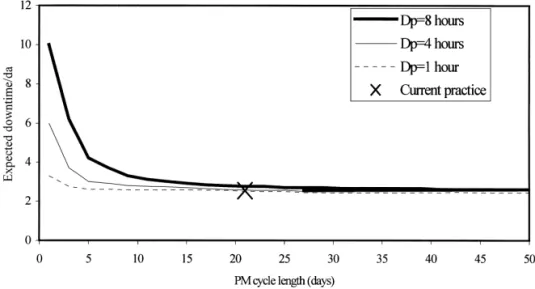
Fig. 10. Expected downtime against PM cycle length.
IMA with the model predictions, see Fig. 9. To check the validity of this"t, we compare the
chi-squared test statistic with the critical value of the chi-squared distribution table. Since the critical
s value, s is 7.815, we can conclude with
s"2.135 that the model"t is acceptable.
7. The PM model
Based on an acceptable model for the failure and PM process of the IMA, a PM model of the main-tenance practice of the machine can be established. We model the downtime since the major concern of the company is to reduce the downtime caused by failures and PM activities. The conventional down-time measure is the expected downdown-time per unit time over a long period. The key issue in the model is the expected number of failures over di!erent PM
cycles which is given in Eq. (1). Ifd
denotes the mean downtime per failure and
d
denotes the mean duration of PM activity, it
follows that the long-term measure of the expected downtime per unit time, ED(¹), is
ED(¹)"dEN( ¹)#d
¹ . (15)
Using the "tted model parameters of Table 2,
we obtain the result of the model output shown in
Fig. 10. It should be noted that not all 8 hours PM time is dedicated to the inspection of the IMA plant, which may only occupy a small portion of the total PM time. For this reason, we setd
"1,
4 and 8 hours in Fig. 10, which also indicates the observed downtime level of the current practice. This is very close for the various cases. It can be seen from Fig. 10 that there is no indication of any inspection element of periodic PM being
bene"cial to the IMA plant concerned if the PM
inspection downtimes are 1, 4 or 8 hours. This strongly suggests that the current PM policy for IMA may not be appropriate and an alternative way needs to be found to reduce downtime due to failures.
Discussion with engineers revealed that one of the reasons for PM not being as good as expected is the lack of proper inspection at PM, which is re#
ec-ted by the low value ofr. If the inspection element of PM is enhanced, or the e$ciency of inspection is
increased to r"0.85, say, an optimal PM cycle
solutions such as re-design or maintenance solutions such as an improved and deeper inspec-tion, can reduce downtime. A snapshot approach can assist with and inform all of these develop-ments.
8. Conclusions
The study reported here is only a pilot one which needs further re"nement and extension. However,
it shows the importance of OR modeling in aid of maintenance decision-making. The problem addressed here has generality since incomplete data, particularly lack of PM data, is a common problem in industry.
A model has been developed showing the e!
ec-tiveness of the current maintenance concept. It has been revealed that the inspection element of PM is virtually nonexistent, with only 7% of the total defects being identi"ed. This demonstrates one of
the strengths of modeling in that it both identi"es
and quanti"es the nature of the problem to
be addressed. A constant defect arrival rate used here is, as one would expect, for multi-component complex plant with many failure modes. The tendency towards constant rate of arri-val of defects in complex plant has been observed in other case studies [2], and is anticipated from the theory.
In this study the objective method of parameter estimation is used. Based upon the estimated delay time distribution, a PM model has been established to give the recommended PM interval if it is applic-able. It is reassuring to note how good the"t of the
model is to current practice. This is a standard check to be expected of any modeling exercise. However, the model shows that the inspection ele-ment of PM does not contribute to the plant con-cerned, since the total downtime caused by failures and PM is higher than that to be expected from a breakdown only maintenance policy. Two of the reasons for this may be attributable to the fact that the mean delay time is small (about 1/2d), and the fact that the manual PM occupies a relatively long production downtime. However, the model also shows that if the PM activity can with little down-time identify defects, a "nite optimal PM policy
may exist. In particular, the model shows that the current probability value of a defect being
identi-"ed at PM is 7%, which whilst rather low, has been
accepted by the management as realistic and clearly suggests that the current inspection may not be useful for the IMA machine. It could be that the wrong types of elements are being inspected, or perhaps the wrong type of inspection technique is being applied. Since the mean delay time is short and most failures are recurrent ones, designing out weak points in troublesome components units might also be a useful option. Eitherway, engineer-ing attention is required and the snap-shot model suggested by Christer and Whitelaw [11] can be considered to highlight the true nature of problems to be addressed, and to inform and aid engineering choice. Su$ce it to say, with the current
mainten-ance practice, the indications are that the plant is being overmaintained.
To date, only the e$ciency of the 5/6 weekly PM
activities for the IMA has been considered here. There is, of course, the question of the appropriate-ness of the three monthly PM check on the IMA, and this still needs to be considered.
Acknowledgements
The authors wish to thank Mr. Thomas of the Aero. Mechanical Engineering Dept. at Salford University for the initial contact with the company concerned. The research reported here has been supported in part by EPSRC under grant No. GRlL20801.
Appendix A
As mentioned in text we provide detailed data here in the form of a table (Table 3).
Appendix B
Table 3
The number and downtime of failures
Component Failure mode Number of
failures
Downtime (min)
Average downtime per failure
IMA Bad stacking 505 13 513 26.76
Cartons jam/former/over-load 411 3420 8.30
Running on one paper reel 372 936 2.52
Alignment problem 220 2368 10.76
Starting up 219 1562 7.13
Paper extraction 208 2033 9.77
Pad/cutter cleaning 82 1678 20.46
Filling gum 79 290 3.67
Vacuum 51 1089 21.35
T-plate broken 18 600 33.33
Stacking light 18 176 9.78
Centre knife 17 671 39.47
Tea in seams 17 160 9.41
Carton light 11 135 12.27
Cutter change 7 1835 262.14
Tension roller 6 72 12.00
Pusher plate broken 5 120 24.00
Loli-pop stick bent 4 18 4.50
break on reel too tight 1 130 130.00
Crimps Heater/light problem 31 1372 44.26
Packaging Lids not inter-locking 227 1335 5.88
Paper reel snapping/not splicing 220 2535 11.52
Paper jamming 98 973 9.93
Poor cartons 96 966 10.06
Waiting for materials 13 480 36.92
Tea Tea feed/blockage/no tea 60 2741 45.68
Move tea 14 168 12.00
Check magnets 9 59 6.56
Weights Re-calibrate check-weigher 39 424 10.87
ME Boxes sticking together 224 1339 5.98
Cellophane alignment 23 442 19.22
Lift/elevator jam 21 192 9.14
Missing wraps 9 136 15.11
ME stopping mid-cycle 6 110 18.33
Europack Jamming 49 760 15.51
Not sealing/bad wrap 20 1124 56.20
Stork Conveyor 9 133 14.78
Other Waiting for engineer 35 2453 70.09
No operator 19 1220 64.21
Side plates 13 350 26.92
No agency 4 32 8.00
Other 168 5160 30.71
References
[1] A.H. Christer, W.M. Waller, Delay time models of indus-trial inspection maintenance problems, Journal of the Operational Research Society 35 (1984) 401}406.
[2] A.H. Christer, Development in delay time analysis for modeling plant maintenance, Journal of the Operational Research Society 50 (2000) 1120}1137.
[3] A.H. Christer, W.M. Waller, An operational research approach to planned maintenance: Modeling P.M. for a vehicle#eet, Journal of the Operational Research Society
35 (1984) 967}984.
[4] J.B. Chilcott, A.H. Christer, Modeling of condition-based maintenance at coal face, Journal of Production Econ-omics 22 (1991) 1}11.
[5] M.I. Desa, Bus#eet maintenance modeling in a developing
country, Ph.D. Thesis, Department of Mathematics and Computer Science, University of Salford, UK, 1995. [6] R.D. Baker, W. Wang, Estimating the delay-time
distribu-tion of faults in repairable machinery from failure data,
IMA Journal of Mathematics Applied in Business and Industry 3 (1992) 259}281.
[7] R.D. Baker, W. Wang, Developing and testing the delay time model, Journal of the Operational Research Society 44 (1993) 361}374.
[8] A.H. Christer, W. Wang, R.D. Baker, J. Sharp, Modeling maintenance practice of production plant using the delay time concept, IMA Journal of Mathematics Applied in Business and Industry 6 (1995) 67}84.
[9] A.H. Christer, W. Wang, A delay time based maintenance model of multi-component system, IMA Journal of Mathe-matics Applied in Business and Industry 6 (1995) 205}222.
[10] S.M. Ross, Stochastic Processes, Wiley, New York, 1983. [11] A.H. Christer, J. Whitelaw, An operational research approach to breakdown maintenance: Problem recogni-tion, Journal of the Operational Research Society 34 (1983) 1041}1052.