Rp23,725 - BUY
+62 21 2554 8827Prasetya Gunadi
Reuters TPIA.JK Bloomberg TPIA IJ
Priced on 23 March 2017
Jakarta Comp @ 5,563.8
12M hi/lo Rp23,850/3,550
12M price target Rp30,100
±% potential +27%
Shares in issue 3,287.0m
Free float (est.) 3.2%
Market cap US$5,853m
3M average daily volume
Rp53.4bn (US$4.0m)
Foreign s'holding 38.3%
Major shareholders
PT Barito Pacific Tbk 45.0% Siam Cement PCL 30.6%
Stock performance (%) 1M 3M 12M
Home field advantage
Great position to address Indonesia’s structural shortage
Chandra Asri (TPIA IJ) is by far Indonesia’s largest petrochemical company. While strong spreads magnified its capacity upgrade in 2015, future upgrades will focus on downstream products to improve its overall ASP. Structural shortages in Indonesia also provide a boost as imported polymers are priced at a 10%-25% premium over the global benchmark. Even though the industry is susceptible to spread movements, the company is in the driver’s seat to capitalize on the country’s long-term shortage. We value the company at a target price of Rp 30,100/share and initiate coverage with a BUY recommendation.Better liquidity as strong spreads amplify improved capacity
TPIA’s timely capacity upgrade was magnified as high spreads lifted the company’s earnings c.11x from 2015 to 2016. The strong growth saw its
share price gain 499% last year making it the 12th largest market cap
company in the country. Previously, liquidity was an issue since only 4% was floated. However, with the company its planning to issue rights for 280m new shares which could dilute existing shareholders by 7.85%; this concern is partly addressed.
Indonesia is paying a premium for imports due to plant shortages
Indonesia is paying a 10%-25% premium for the Ethylene/Propylene Polymer products it imports. Imports grew 3.4x/4.1x from 10 years ago as domestic capacity has been insufficient to meet strong demand. Over the next three years TPIA will continue to upgrade its downstream product capacity to boost both volume & ASPs, partially offsetting the higher expected naphtha prices.
Spreads a risk, but Indonesia’s structural shortage an opportunity
Similar to every other petrochemical company, TPIA is susceptible to shrinking spreads should naphtha prices rally without corresponding improvements in olefin prices. However, what makes TPIA unique is it is the biggest player in a severely underserved domestic market which could absorb its production even if it grew multiples by its current size.
Initiating coverage with an Rp 30,100/sh target price and BUY rating
The biggest in Indonesia
Chandra Asri (TPIA IJ) is Indonesia’s largest Petrochemical producer. In short, it makes different types of intermediate and finished products used to make plastics and polymers. It has significant value add compared to peers because it makes the intermediary products itself thanks to its naphtha cracker.
At the moment it has the only active naphtha cracker used for polymer production in the country. Therefore, it is in the best position to benefit from the shortage of domestic supply which results premium import price. The produces different types of chemicals that could be categorized into four groups;
1. Olefin (32% of revenue)
o 4 products; Ethylene, Propylene, Pygas and Mixed C4
o Need Naphtha as raw material to make Polyolefin
o Product is used as raw material to make polyolefin or sold
directly to other petrochemical companies
2. Polyolefin (46% of revenue)
o 2 products; Polyethylene and Polypropylene
o Need Ethylene and Propylene as a feed to make Polyolefin
o Used as raw material to make consumer packaging
3. Styrene Monomer (15% of revenue)
o 2 products; Styrene Monomer and Toluene
o Need Ethylene and Benzene to make Styrene Monomer
o Used as raw material to make polystyrene and synthetic
rubber (along with Butadiene)
4. Butadiene (7% of revenue)
o 2 products; Butadiene and Raffinate
o Need Mixed C4
o Used as raw material to make synthetic rubber (along with
Styrene Monomer)
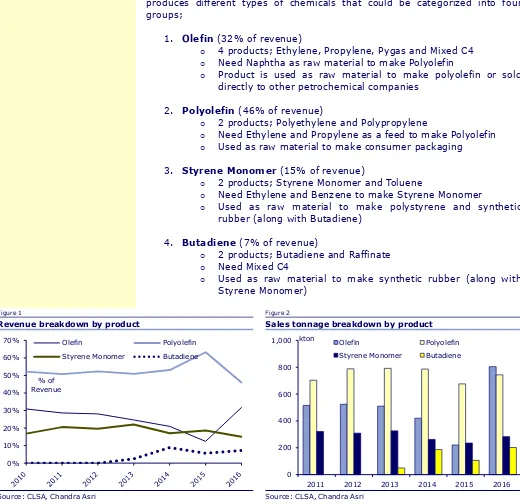
Figure 1 Figure 2
Revenue breakdown by product Sales tonnage breakdown by product
Source: CLSA, Chandra Asri Source: CLSA, Chandra Asri
Within the Olefin products, Ethylene contributes the largest portion of the revenue. The ethylene and propylene sold are the ones in excess of the 0%
10% 20% 30% 40% 50% 60% 70%
% of Revenue
Olefin Polyolefin Styrene Monomer Butadiene
0 200 400 600 800 1,000
2011 2012 2013 2014 2015 2016 kton
Olefin Polyolefin Styrene Monomer Butadiene
volume needed to produce polyethylene and polypropylene. The C4 amount is smaller because the bulk of the C4 is used to make Butadiene.
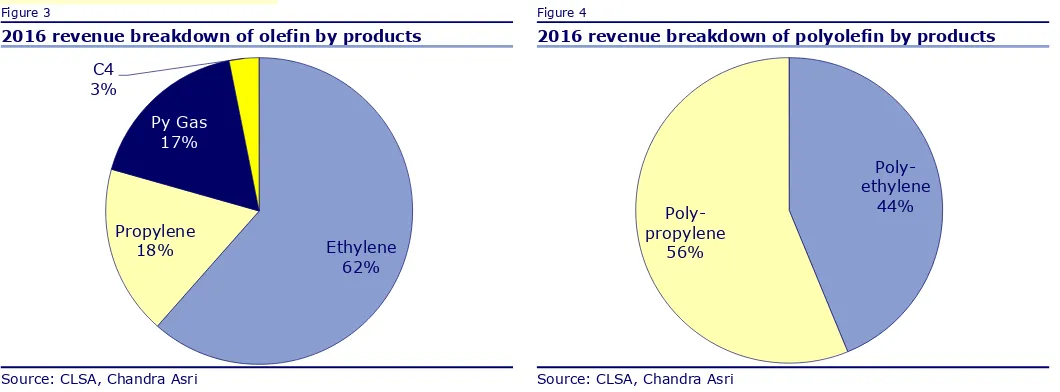
Figure 3 Figure 4
2016 revenue breakdown of olefin by products 2016 revenue breakdown of polyolefin by products
Source: CLSA, Chandra Asri Source: CLSA, Chandra Asri
The ultimate goal for the company is to produce as much downstream products as it can. In the next few years, the company plans to upgrade its Polyethylene (from 336ktpa to 400 ktpa in 20CL) and Polypropylene (from 480 ktpa to 560 ktpa in 18CL) production capacity.
Figure 5
Operational flow, more upgrades in the coming years
Ethylene 62% Propylene
18% Py Gas
17% C4
3%
Poly-ethylene
44%
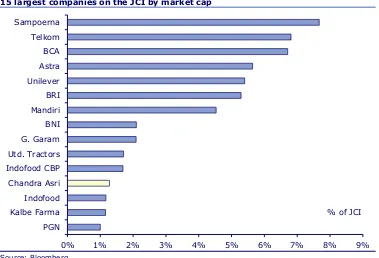
The company surprised the market when it significantly outgrew the JCI Index, (499% vs 15%) for 2016. The rally was partly driven by the capacity upgrade and strong spread expansion due to lower naphtha prices.
Thanks to the strong rally, TPIA is now the number 12 market cap company in the index. It now accounts for 1.3% of the JCI.
Figure 6
15 largest companies on the JCI by market cap
Source: Bloomberg
Rights issue to increase liquidity
Despite the strong rally market participation was limited because liquidity was low. Only 4.2% of the stock was floated to the market. Barito Pacific (BRPT IJ) and its affiliates own the majority of 65.2%, while SCG Chemical own 30.6%.
SCG Chemical acquired the stake in 2011 from an affiliate of Temasek (22.9%) and Barito Pacific (7.7%) for US$442m. This was equivalent to Rp 4,088/sh.
Fortunately, the liquidity problem is going to be addressed soon. In a statement released to the public on Friday 24 March, the company intend to issue a maximum of 280,000,000 new shares with Pre-emptive rights. This is equivalent to 7.8% of the new total shares.
In the statement, the company said that it is issuing new shares to fulfil the listing requirement from the exchange that need controlling and non-principal shareholders to have at least 7.5% of the total shares.
The company also said that proceed from the share issuance will be used for capex. Using the closing price on 24 March of Rp 23,850/sh, the amount to be raised would be Rp 6.68 trillion. This is equivalent to US$501m, if we used Rp 13,327/USD.
0% 1% 2% 3% 4% 5% 6% 7% 8% 9% PGN
Kalbe Farma Indofood Chandra Asri Indofood CBP Utd. Tractors G. Garam BNI Mandiri BRI Unilever Astra BCA Telkom Sampoerna
% of JCI
Strong jump to 12th
position in a year
Possible 7.85% dilution through the proposed rights issue
Figure 7 Figure 8
Shareholders breakdown: before rights issue Shareholders breakdown: post-rights issue
Source: Chandra Asri, * Marigold Resources is subsidiary of Barito Pacific, ** Magna Resources is a shareholder of Barito Pacific,
Source: Chandra Asri. * Marigold Resources is subsidiary of Barito Pacific, ** Magna Resources is a shareholder of Barito Pacific,
Overview of operation in 2016
Looking beyond liquidity, the company had a strong 2016. Considering the fairly technical nature of the business, we will explain in broad strokes first before going into detail.
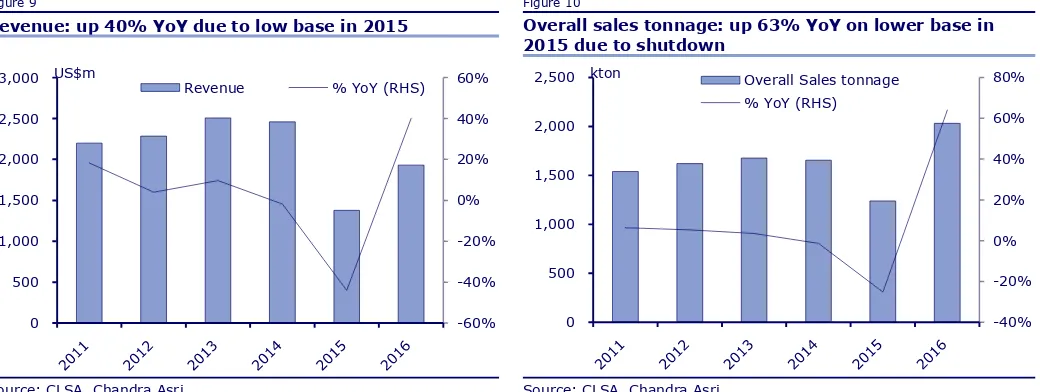
In 2016, Revenue grew 40% YoY as cracker shutdown in parts of 2015 lead to lower base effect. The cracker was shutdown to allow cracker and ethylene upgrade to take place. As the upgrade was complete, sales tonnage increased by 23% compared 2014, the year prior the shutdown.
Figure 9 Figure 10
Revenue: up 40% YoY due to low base in 2015 Overall sales tonnage: up 63% YoY on lower base in 2015 due to shutdown
Source: CLSA, Chandra Asri Source: CLSA, Chandra Asri
The strong volume offset the decline in overall ASP (-17% YoY) for the Barito
Revenue % YoY (RHS)
-40%
Plus, the completion of the ethylene capacity upgrade means the company no longer need to buy as much ethylene to feed into its polyethylene plant. As a result, the average cost of raw material and finished product per ton came down -30% YoY.
Figure 11 Figure 12
Overall ASP: Decline in products prices as crude dropped
Cost per ton: Lower naphtha price and ethylene purchase volume
Source: CLSA, Chandra Asri Source: CLSA, Chandra Asri
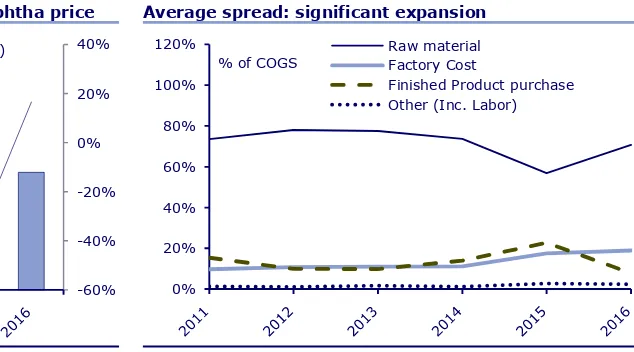
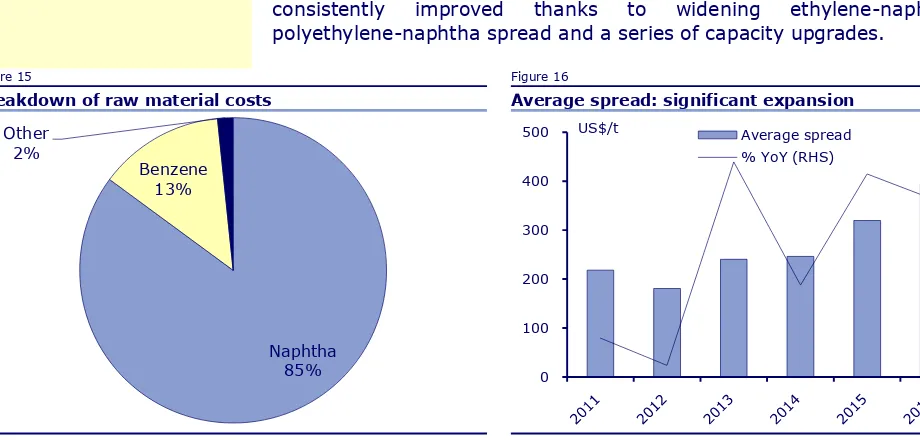
Raw material and movement in finished products account for 71% and 8% of the company’s COGS. So, even though manufacturing cost (19% of COGS) grew 26% YoY, overall COGS decline 17% YoY.
Within raw material, naphtha account for 85% of raw material cost even though prices of naphtha fell. Benzene is used to produce Styrene Monomer which is later used to produce synthetic rubber (Styrene Butadiene).
Figure 13 Figure 14
Cogs: Only up by 17% YoY due to lower naphtha price Average spread: significant expansion
Source: CLSA, Chandra Asri Source: CLSA, Chandra Asri
Given its weight, the cost is most sensitive to naphtha prices. Which means the overall spread is also dependent on naphtha prices. Naphtha is a refined petroleum product which is derived from crude after it went through refining. Since most producers in the region have to import its naphtha supply, the impact of naphtha prices is similar across producers.
The key here is despite the decline in ASP, the decline in cost was even faster. Because of that spread expanded by 23% YoY in 2016. Spread has
-40%
2,000 US$/t Overall ASP % YoY (RHS)
consistently improved thanks to widening ethylene-naphtha and polyethylene-naphtha spread and a series of capacity upgrades.
Figure 15 Figure 16
Breakdown of raw material costs Average spread: significant expansion
Source: CLSA, Chandra Asri Source: CLSA, Chandra Asri
As a result of the widening spread and operating leverage, Ebitda grew 249% YoY as Ebitda margin increased from 10% to 26%. Meanwhile, NPAT grew c.11x YoY as net margin improved from 2% to 16%.
We may see slight spread expansion in 17CL as production of polyolefin products increases. The company managed to get premium price for polyolefin in Indonesia given the lack of supply.
Figure 17 Figure 18
Ebitda: 249% YoY growth on widening spread Npat: 11x growth from a very low base
Source: CLSA, Chandra Asri Source: CLSA, Chandra Asri Naphtha
85% Benzene
13% Other
2%
-20% -10% 0% 10% 20% 30% 40%
0 100 200 300 400
500 US$/t Average spread % YoY (RHS)
0% 10% 20% 30% 40%
0 100 200 300 400 500
600 US$m Ebitda % Ebitda Margin (RHS)
-10% -5% 0% 5% 10% 15% 20% 25% 30% 35%
(100) (50) 0 50 100 150 200 250 300
Shortage means premium pricing
Indonesia is a net importer of crude which is the raw material for naphtha. The country also lacks enough refineries and has to import refined petroleum including naphtha. Therefore, it comes as no surprise that the country is also a net importer of olefins and its derivatives.
Over the past 10 years, imports of both ethylene and propylene have been somewhat stable. This is because the consumption of these intermediate chemical is dependent on the production capacity to convert these product into other more usable products. The flat growth means there has not been an increase in the production capacity for these products.
Figure 19 Figure 20
Indonesia ethylene imports are related to PE producer capacity which has not grown much
Indonesia propylene are related to PP producer capacity which has not grown much
Source: CLSA, government of Indonesia Source: CLSA, government of Indonesia
Because of the stable consumption and significant supply from domestic and neighbouring countries, the average import prices for ethylene and propylene have kept track with the benchmark prices.
Figure 21 Figure 22
Ethylene import price is near the benchmark Propylene import price is near the benchmark
Source: CLSA, government of Indonesia Source: CLSA, government of Indonesia
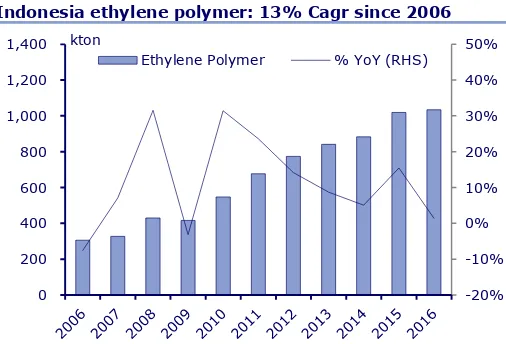
However, if look at consumption in polymer derivatives of ethylene and propylene, imports have grown 3.4x and 4.1x over the past 10 years. Demand increase as real consumption increase, and because domestic production could not keep up, so would import.
-20%
1,000 kton Ethylene % YoY (RHS)
-100%
500 kton Propylene % YoY (RHS)
-10%
2,000 US$/ton Ethylene Import Price Benchmark Ethylene Price
Figure 23 Figure 24
Indonesia ethylene polymer: 13% Cagr since 2006 Indonesia propylene polymer: 15% Cagr since 2016
Source: CLSA, government of Indonesia Source: CLSA, government of Indonesia
Not surprisingly, judging by the strong growth and lack of domestic supply to address the demand, import premium over benchmark prices have escalated. We saw similar trend in the company’s result which implied premium prices relative to benchmark for both polyolefin.
Figure 25 Figure 26
Ethylene polymer price: expanding premium Polypropylene polymer price: expanding premium
Source: CLSA, government of Indonesia Source: CLSA, government of Indonesia
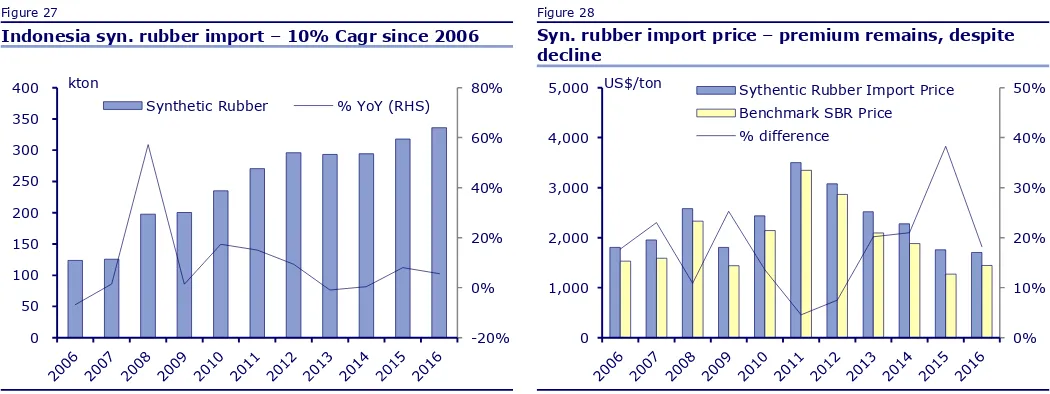
The same trend can be seen with other chemical products that requires more processing. One of those products is Synthetic Rubber. There are many types of synthetic rubber products. In the past 10 years, demand grew 1.7x.
The prices of synthetic rubber have fallen for the past 5 years due as weak rubber prices highlight substitution risk. But despite the falling rubber prices and availability of rubber in Indonesia, premium to import price remains.
-20%
Ethylene Polymer % YoY (RHS)
-10%
Propylene Polymer % YoY (RHS)
-10%
2,500 US$/ton Ethylene Polymer Price Benchmark Polyethylene Price
Figure 27 Figure 28
Indonesia syn. rubber import – 10% Cagr since 2006 Syn. rubber import price – premium remains, despite decline
Source: CLSA, government of Indonesia Source: CLSA, government of Indonesia
Looking at the domestic Petrochemical landscape, Chandra Asri has the prime position to profit from this structural shortage. The shortage is significant enough that multiples of Chandra Asri is needed in the country in the next 10 years.
Its closest competitor, Lotte Chemical Titan (FPNI IJ), is planning to build a naphtha cracker with the accompanying olefin and its derivatives facilities next year, the construction is likely to take 4-5 years. The country is likely to remain in shortage even after this construction is complete.
Figure 29
Indonesia petrochemical production capacity – Chandra Asri is the largest by far
Source: Chandra Asri
-20% 0% 20% 40% 60% 80%
0 50 100 150 200 250 300 350 400 kton
Synthetic Rubber % YoY (RHS)
0% 10% 20% 30% 40% 50%
0 1,000 2,000 3,000 4,000
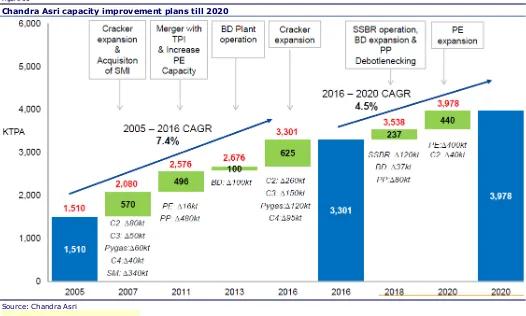
From 2016 to 2020, the company plans to increase its downstream capacity to fully monetize the cracker expansion it did at the end of 2015. This includes the SBR joint venture with Michelin (45:55, TPIA:Michelin), and Butadiene and Polypropylene upgrade in 2018.
Over a longer time frame, the company may increase its overall production facility. The company informed us that it was still too early to share such plan.
Figure 30
Chandra Asri capacity improvement plans till 2020
Source: Chandra Asri
As for price, CLSA price forecast for a slight decline in Ethylene and Polyethylene spread, and flat for propylene and polypropylene.
Figure 31 Figure 32
CLSA ethylene price forecast CLSA propylene price forecast
1,000 1,500 2,000
US$/ton
Ethylene Price Spread
1,000 1,500 2,000
US$/ton
The narrowing spread is largely due to increase cost of naphtha as we expect crude prices to stabilize higher. The price forecast is made based on expected global capacity addition in the next two years.
Figure 33 Figure 34
CLSA polyethylene price forecast CLSA polypropylene price forecast
Source: CLSA Source: CLSA
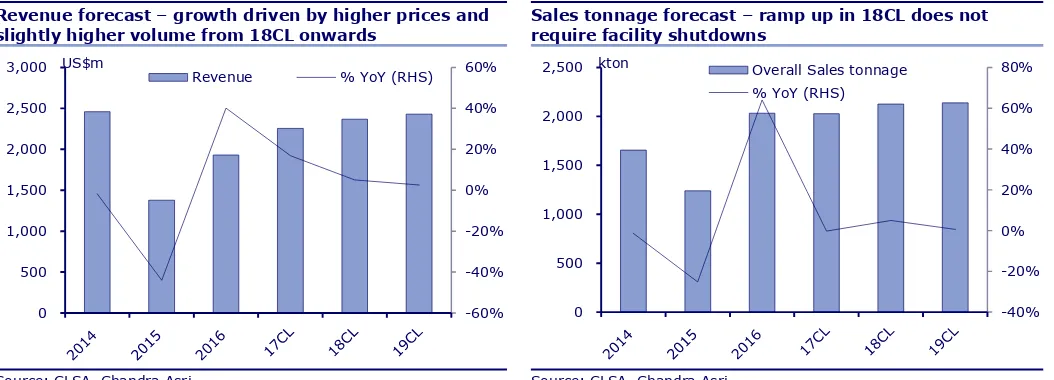
But one thing to remember is the overall revenue for the company depends on the portfolio of products it has, the premium it could get on each of those products and the volume of production.
We forecast revenue to grow 18%/5% for 17/18CL driven largely by price movement as we forecast sales tonnage to grow 0/5% for the same period.
Figure 35 Figure 36
Revenue forecast – growth driven by higher prices and slightly higher volume from 18CL onwards
Sales tonnage forecast – ramp up in 18CL does not require facility shutdowns
Source: CLSA, Chandra Asri Source: CLSA, Chandra Asri
In addition to higher olefin price forecast, we also forecast for an increase in downstream product. This also contributed to higher revenue even though the overall sales tonnage from 2016 to 17CL is similar.
We forecast ASP to remain flat for 18CL as price growth in some products would offset decline in others. Since the company is focusing more on upgrading its downstream facility, we expect revenue percentage from olefin to decline over time.
0 500 1,000 1,500 2,000
US$/ton
Polyethylene Price Spread
0 500 1,000 1,500 2,000
US$/ton
Polypropylene Price Spread
-60% -40% -20% 0% 20% 40% 60%
0 500 1,000 1,500 2,000 2,500 3,000 US$m
Revenue % YoY (RHS)
-40% -20% 0% 20% 40% 60% 80%
0 500 1,000 1,500 2,000
Figure 37 Figure 38
Overall ASP – main driver to revenue growth Revenue breakdown – growing non-olefin portion as the company focus on downstream
Source: CLSA, Chandra Asri Source: CLSA, Chandra Asri
Given that we forecast Naphtha prices to increase 31% in 17CL, this was the biggest drive to our COGS growth. Our COGS growth was much smaller at 23% because we expect volume of purchased propylene would decline.
Figure 39 Figure 40
Cogs forecast – increase as we forecast increasing naphtha prices
Spread forecast – decline on stronger naphtha
Source: CLSA, Chandra Asri Source: CLSA, Chandra Asri
Because of our lower spread, we forecast Ebitda margin to decline from 26% in 2016 to 22% in 17/18CL. Absolute Ebitda remain fairly close as increase in sales volume negate some of the effect of narrower spread.
As a result, our NPAT forecast also remain fairly stable over the next 3 years ranging from US$315m to US$323m.
-40% -30% -20% -10% 0% 10% 20%
0 500 1,000 1,500
2,000 US$/t Overall ASP % YoY (RHS)
0% 10% 20% 30% 40% 50% 60% 70%
% of Revenue
Olefin Polyolefin Styrene Monomer Butadiene
-60% -40% -20% 0% 20% 40%
0 500 1,000 1,500 2,000
2,500 US$m COGS % YoY (RHS)
-10% 0% 10% 20% 30% 40%
0 100 200 300 400
Figure 41 Figure 42
Ebitda forecast – slight decline over time driven by spread
Earnings forecast – similarly impacted by Ebitda
Source: CLSA, Chandra Asri Source: CLSA, Chandra Asri 0%
10% 20% 30% 40%
0 100 200 300 400 500
600 US$m Ebitda % Ebitda Margin (RHS)
0% 10% 20% 30% 40%
0 100 200 300
Spread risk versus long opportunity
Petrochemical is a cyclical business. Profitability depends on spread which is a function of crude prices that determined naphtha prices, and competition amongst producers that could create over supply or shortage.
Not surprisingly, our forecast is most sensitive to changes to naphtha prices. Under normal circumstances the prices of olefins and its derivatives would also move along with Naphtha prices. In our sensitivity, assuming a 10% increase in Naphtha prices while all else remains equal, means a spread decline by -12%.
Figure 43
Sensitivity – 10% increase in naphtha but spread decline by 12%
10% increase from forecast value
Volume Naphtha Ethylene Poly
Ethylene
Poly Propylene
Styrene Monomer
Butadiene
Revenue 10% 1% 2% 2% 2% 2% 1%
Ebitda 9% (21%) 9% 8% 10% 7% 4%
NPAT 10% (25%) 10% 10% 13% 8% 5%
Source: CLSA
Even though, over the next 10 years, the spread may go through its peak and trough again, we believe consumption only has no way to go but up. Assuming that overall demand for Ethylene polymer to increase by 4% (lower end of real growth rate), the overall consumption would grow to 2,500 ktpa in 26CL.
This is nearly 3x the total capacity in the entire country to address the shortage. Or the company could grow its polyethylene plant capacity 5x its current level, assuming competitors capacity remain flat. The growth opportunity is tremendous.
Figure 44
Indonesia polyethylene demand – capacity needs to grow 3x to meet supply
500 1,000 1,500 2,000 2,500 3,000 3,500 kton
Figure 45
Indonesia polypropylene demand – capacity needs to grow 2.6x to meet supply
Source: CLSA, Chandra Asri, Govt of Indonesia
To keep production low, that means the country is going to need significant investment in the sector. To maximize return, companies need to consider building a naphtha cracker facilities complete with the downstream production.
Chandra Asri is in a prime position to capitalize on this opportunity. It is the largest and the most integrated petrochemical company in Indonesia. With some investment, it is likely to remain so for many years to come.
Initiating with a BUY rating and target price of Rp 30,100
Chandra Asri benefited in 2016 as strong spread magnified the operational upgrade it undertook in 2015. But that upgrade was part of a multiyear improvement plan meant to focus downstream production and increase the overall ASP and sales volume.
The company also stands to benefit as the structural shortage for polymers in Indonesia become more pronounce as demand is likely to continue growing. Spread risk is similar to other petrochemical companies but the domestic opportunity in Indonesia gives Chandra Asri an edge. We initiate with a target price of Rp 30,100/sh and BUY rating.
Figure 46
Valuation DCF – declining FCF due to declining spread
Y/E Dec 31 17CL 18CL 19CL 20CL 21CL 22CL 23CL 24CL 25CL 26CL
(US$m)
Revenue 2,281 2,396 2,507 2,622 2,670 2,722 2,775 2,825 2,877 2,928
Operating Ebit 434 438 432 442 430 421 414 404 396 387
Less:Cash Tax (105) (108) (108) (111) (110) (110) (109) (109) (107) (106)
NOPLAT 329 331 324 330 320 312 304 295 288 281
Add: Depreciation 75 83 91 97 96 95 93 92 91 90
Less: Change Working Capital
7 2 3 2 2 2 2 2 2 2
Less: Capex (201) (233) (199) (72) (72) (72) (72) (72) (72) (72)
Op Free Cash Flow 210 182 219 358 346 336 327 317 309 300
Discounted FCF 210 171 193 296 269 245 224 204 186 170
Source: CLSA
0 500 1,000 1,500 2,000 2,500
We forecast our cash flow for the next 10 years, with an assumption that the spread would gradually decline to the average level from the previous 10 years.
Admittedly, forecasting commodity prices over long term could lead to differences. But to value the company using multiple means under valuing the growth beyond the next 2 years.
Figure 47 Figure 48
Sales tonnage forecast – only plans already made public Split forecast – each product is moving to pass its 10 year average
Source: CLSA, Chandra Asri Source: CLSA, Chandra Asri
Figure 49 Figure 50
Overall ASP and cost per ton moving past 10 year average
Average spread declining toward the average for the past 10 years
Source: CLSA, Chandra Asri Source: CLSA, Chandra Asri 0%
10% 20% 30% 40% 50% 60% 70%
1,300 1,500 1,700 1,900 2,100
2,300 kton Sales tonnage % YoY (RHS)
0% 10% 20% 30% 40% 50% 60% 70%
%
Olefin Polyolefin Styrene Monomer Butadiene
0 200 400 600 800 1,000 1,200 1,400
US$/t
Overall ASP Overall Raw Mat/Ton
-15% -10% -5% 0% 5% 10% 15%
100 200 300 400
Figure 51
Valuation calculation
Valuation Details Units Value
NPV of DCF US$m 1,958
% WACC % 6.5%
Terminal valuation US$m 4,975
% Terminal Growth % 3%
Add: Cash US$m 386
Less: Debt US$m 362
Equity Value US$m 6,957
Equity Value Rpb 98,789
Target Price Rp/Share 30,100
Source: CLSA Figure 52
Earnings and balance-sheet risk scores (lower the better) Score Comments
Earnings-quality flags
Capex indiscipline 1
Cash burn 0
Rising non-core or intangibles 0
Rising working capital 0
Poor cash conversion 0
Earnings-quality risk score (EQRS) 1/5
Balance-sheet-quality flags
Cash burn 0
Excessive leverage 0
Frequent fundraising 0
Liquidity concerns 0
Operational stress 0
Balance-sheet-quality risk score (BQRS) 0/5
Source: CLSA
Valuation details
We value the stock on DCF (WACC 6.5%, TG 3%). We forecast our financials for the next 10 years. We use the price assumption for the next 2 years using CLSA's view and expect price to converge to the historical average prices for the past 10 years. We do not use EV/Ebitda because the company is undergoing series of facility upgrades whose values may not be captured using EV/Ebitda.
Investment risks
Our forecast is dependent on the company meeting its facility upgrade targets that it set for the next 3 years. Earnings are sensitive to spread of products against naphtha. Increase in naphtha without similar improvement in downstream product prices would result in smaller margin and lower valuation.
Figure 53
Regional petrochemical comps Ticker Company Share
Price
Mcap (US$m)
Rec TP Upside (%)
TSR (%)
PE17 PE18 Div Yield (2017)
ROE17 EV/ Ebitda (2017)
EV/ Ebitda (2018)
Ebitda growth (2017)
TPIA IJ Chandra Asri
23,725 5,853 BUY 30,100 26.9 26.9 18.2 17.2 0.0 24.8 11.2 10.1 2% SCC TB Siam
Cement
532 18,456 BUY 585 10.0 13.0 13.6 13.5 3.0 18.7 10.0 9.8 1% PTTGC TB PTTGC 71.75 9,283 BUY 76.00 5.9 9.8 12.9 13.7 3.9 10.0 6.9 6.7 (3%) PCHEM MK Petronas
Chemicals
7.48 13,710 BUY 8.80 17.6 20.8 16.6 15.7 3.1 12.9 8.5 8.1 6% DLG MK Dialog 1.70 2,102 BUY 1.86 9.4 11.0 26.4 25.6 1.6 13.4 19.5 16.2 19% 1326 TT Formosa
Chem
94.60 18,364 SELL 80.00 (15.4) (12.1) 17.3 19.1 3.3 9.0 10.5 10.6 (5%) 6505 TT Formosa
Petrochem
106.00 33,285 SELL 94.00 (11.3) (7.6) 20.4 20.8 3.7 16.9 13.0 12.8 (1%) 1301 TT Formosa
Plastics
92.50 19,256 O-PF 100.00 8.1 11.9 19.1 17.3 3.8 10.6 25.3 25.7 0% 014680
KS
Hansol Chemical
75,400 760 BUY 120,000 62.2 63.9 11.1 9.3 1.8 23.6 7.9 6.7 13% 011780
KS
Kumho Petrochem
73,300 2,053 O-PF 90,000 21.1 22.5 12.8 8.8 1.3 11.7 8.0 6.3 27% 051910
KS
LG Chem 290,500 18,560 BUY 360,000 25.4 27.2 14.7 14.2 1.7 10.5 6.0 5.6 2% 011170
KS
Lotte Chemical
354,000 11,100 U-PF 380,000 7.3 8.2 9.6 9.9 0.8 11.8 4.5 4.3 (2%) 1303 TT Nanya
Plastics
71.40 18,630 U-PF 75.00 5.0 7.4 19.1 17.4 2.3 8.7 14.9 13.2 10% 338 HK Shanghai
Petrochem
Figure 54
Indonesia Coverage Comps (>US$1.5 bn market cap) Ticker Company Share
Price
Mcap (US$m)
Rec TP TSR (%)
PE17 PE18 PB17 Div Yield (2017)
ROE17 EV/ Ebitda (2017)
EV/ Ebitda (2018)
TPIA IJ Chandra Asri 23,725 5,852 BUY 30,100 26.9 18.2 17.2 4.1 0.0 24.8 11.2 10.1 TLKM IJ Telkom 4,070 30,956 O-PF 4,700 18.6 18.1 15.2 4.2 3.1 24.7 6.1 5.3 EXCL IJ XL Axiata 3,180 2,608 BUY 3,800 19.8 193.7 62.9 1.6 0.3 0.8 4.8 4.3 ISAT IJ Indosat 6,975 2,856 BUY 9,000 30.5 17.8 11.5 2.5 1.5 14.8 4.0 3.4 ASII IJ Astra Intl 8,400 25,762 BUY 10,250 24.6 17.2 15.5 2.8 2.6 16.9 13.4 11.8 BBCA IJ BCA 16,325 30,083 BUY 19,600 21.3 17.1 14.9 3.2 1.2 19.6 n/a n/a BBRI IJ BRI 13,200 24,080 O-PF 11,800 (8.3) 12.0 10.7 2.2 2.3 19.3 n/a n/a BMRI IJ Bank Mandiri 11,775 20,674 O-PF 11,500 (1.0) 13.9 10.2 1.9 1.3 14.7 n/a n/a BBNI IJ BNI 6,600 9,207 BUY 7,350 13.7 9.3 8.1 1.3 2.3 14.4 n/a n/a BJBR IJ Bank BJB 2,190 1,624 BUY 2,000 (3.8) 11.1 10.0 1.9 4.9 18.1 n/a n/a HMSP IJ HM Sampoerna 3,940 34,586 O-PF 4,400 13.8 35.9 31.9 12.4 2.1 36.2 25.9 23.0 UNVR IJ Unilever Indo 42,850 25,165 O-PF 47,700 13.3 45.1 40.4 52.5 2.0 123.4 33.0 29.6 GGRM IJ Gudang Garam 65,425 9,506 BUY 82,000 27.5 17.0 15.1 2.8 2.1 17.7 11.4 10.0 ICBP IJ ICBP 8,800 7,640 O-PF 10,000 15.4 25.2 21.6 5.1 1.8 21.6 16.3 13.9 INDF IJ Indofood 8,100 5,357 BUY 10,500 32.5 16.0 13.6 2.2 2.8 14.3 7.7 7.0 MYOR IJ Mayora Indah 2,040 3,442 BUY 2,100 4.1 25.3 23.4 6.2 1.1 26.8 14.8 13.2 MNCN IJ MNC 1,725 1,833 U-PF 1,760 5.9 15.4 13.6 2.3 3.8 15.4 10.1 9.4 SCMA IJ Surya Citra
Media
2,700 2,854 BUY 3,800 43.8 22.1 19.6 9.9 3.0 48.4 16.5 14.5 BSDE IJ Bumi Serpong 1,885 2,652 U-PF 1,900 0.8 17.0 14.2 1.6 0.0 10.0 12.6 10.9 INTP IJ Indocement 16,500 4,416 SELL 13,500 (15.9) 21.0 20.7 2.2 2.3 10.7 11.4 10.7 SMGR IJ Semen
Indonesia
9,225 4,075 U-PF 9,000 0.5 14.6 14.3 1.8 2.9 12.6 8.9 8.7 JSMR IJ Jasa Marga 4,660 2,540 BUY 6,700 45.5 22.4 26.2 2.6 1.8 11.9 13.7 17.0 TBIG IJ Tower Bersama 5,700 1,905 BUY 6,000 6.1 15.5 13.5 6.9 0.9 54.8 13.2 12.2 TOWR IJ Sarana Menara 4,000 3,050 BUY 4,300 8.1 15.5 14.2 3.4 0.6 24.2 10.4 9.4 PGAS IJ Perusahaan Gas 2,460 4,423 SELL 2,400 0.3 13.1 12.6 1.3 2.7 10.2 7.0 6.5 AKRA IJ AKR 6,575 2,001 BUY 8,400 29.0 20.1 16.7 3.3 1.3 17.3 10.6 8.8 UNTR IJ United Tractors 27,800 7,632 BUY 30,500 12.1 15.1 12.9 2.3 2.4 16.0 7.3 6.1 WIKA IJ Wijaya Karya 2,460 1,670 BUY 3,100 27.5 16.1 12.8 1.8 1.4 18.1 6.5 5.7 PTPP IJ PTPP 3,330 1,518 BUY 4,600 39.6 13.5 10.1 1.9 1.5 11.5 7.8 7.1 PWON IJ Pakuwon 590 2,152 O-PF 650 11.4 14.4 12.6 2.7 1.3 14.7 9.7 9.2 SMRA IJ Summarecon 1,380 1,495 SELL 1,350 (2.1) 40.8 34.4 3.0 0.0 20.5 14.9 13.7 ADRO IJ Adaro 1,730 4,155 BUY 2,300 35.7 10.6 10.9 1.2 2.8 7.6 3.3 2.9 ITMG IJ ITM 18,650 1,593 BUY 22,500 29.9 6.8 6.2 1.6 9.3 11.3 3.2 2.7 PTBA IJ Bukit Asam 11,575 1,985 BUY 18,000 61.1 5.3 7.4 1.6 5.6 24.7 3.1 3.9
Average 22.6 16.9 4.5 2.2 21.1 11.2 10.3
Summary financials
Year to 31 December 2015A 2016A 2017CL 2018CL 2019CL
Summary P&L forecast (US$m)
Revenue 1,378 1,930 2,281 2,396 2,507
Op Ebitda 143 499 510 521 523 Op Ebit 79 424 434 438 432 Interest income 0 0 3 4 5 Interest expense (23) (32) (25) (21) (17) Other items (1) 9 8 9 10
Profit before tax 56 401 420 431 431
Taxation (30) (100) (105) (108) (108) Minorities/Pref divs 0 0 - - -
Net profit 26 300 315 323 323
Summary cashflow forecast (US$m)
Operating profit 79 424 434 438 432
Operating adjustments (23) (23) (14) (8) (1) Depreciation/amortisation 64 75 75 83 91 Working capital changes (23) 58 7 2 3 Net interest/taxes/other 8 (57) (105) (20) (108)
Net operating cashflow 105 476 398 496 417
Capital expenditure (205) (65) (201) (233) (199)
Free cashflow (100) 410 196 262 218
Acq/inv/disposals (41) - - - - Int, invt & associate div 8 (4) - - -
Net investing cashflow (238) (69) (201) (233) (199)
Increase in loans 57 (123) (63) (78) (56) Dividends (5) (44) (46) (47) (47) Net equity raised/other (30) (39) - - -
Net financing cashflow 22 (205) (109) (125) (103)
Incr/(decr) in net cash (111) 202 87 137 115
Exch rate movements - - - - -
Opening cash 208 97 299 386 523
Closing cash 97 299 386 523 638
Summary balance sheet forecast (US$m)
Cash & equivalents 97 299 386 523 638 Debtors 50 140 156 164 172 Inventories 178 200 193 205 217 Other current assets 91 54 59 61 63 Fixed assets 1,308 1,317 1,443 1,594 1,701 Intangible assets 0 0 0 0 0 Other term assets 138 120 120 32 32
Total assets 1,862 2,129 2,358 2,580 2,824
Short-term debt 121 63 54 42 34 Creditors 244 344 362 384 408 Other current liabs 13 47 51 52 53 Long-term debt/CBs 426 362 308 242 194 Provisions/other LT liabs 171 172 172 172 172 Minorities/other equity 7 7 7 7 7 Shareholder funds 880 1,135 1,404 1,680 1,957
Total liabs & equity 1,862 2,129 2,358 2,580 2,824
Ratio analysis
Research subscriptions
To change your report distribution requirements, please contact your CLSA sales representative or email us at [email protected]. You can also fine-tune your Research Alert email preferences at https://www.clsa.com/member/tools/email_alert/.
Companies mentioned
Chandra Asri (TPIA IJ - RP23,725 - BUY) Adaro (ADRO IJ - RP1,730 - BUY)
AKR (AKRA IJ - RP6,575 - BUY) Asahimas Chemical (N-R)
Astra Intl (ASII IJ - RP8,400 - BUY) Bank BJB (BJBR IJ - RP2,190 - BUY)
Bank Mandiri (BMRI IJ - RP11,775 - OUTPERFORM) Barito Pacific (N-R)
BCA (BBCA IJ - RP16,325 - BUY) BNI (BBNI IJ - RP6,600 - BUY)
BRI (BBRI IJ - RP13,200 - OUTPERFORM) Bukit Asam (PTBA IJ - RP11,575 - BUY)
Bumi Serpong (BSDE IJ - RP1,885 - UNDERPERFORM) Chandra Asri (N-R)
Dialog (DLG MK - RM1.69 - BUY)
Formosa Chem (1326 TT - NT$94.6 - SELL) Formosa Petrochem (6505 TT - NT$106.0 - SELL) Formosa Plastics (1301 TT - NT$92.5 - OUTPERFORM) Gudang Garam (GGRM IJ - RP65,425 - BUY)
Hansol Chemical (014680 KS - ₩74,000 - BUY)
HM Sampoerna (HMSP IJ - RP3,940 - OUTPERFORM) ICBP (ICBP IJ - RP8,800 - OUTPERFORM)
Indocement (INTP IJ - RP16,500 - SELL) Indofood (INDF IJ - RP8,100 - BUY) Indosat (ISAT IJ - RP6,975 - BUY) ITM (ITMG IJ - RP18,650 - BUY) Jasa Marga (JSMR IJ - RP4,660 - BUY)
Kumho Petrochem (011780 KS - ₩74,300 - OUTPERFORM)
LG Chem (051910 KS - ₩287,000 - BUY)
Lotte Chemical (011170 KS - ₩355,000 - UNDERPERFORM)
Lotte Chemical Titan (N-R) Magna Resources (N-R) Marigold Resources (N-R)
Mayora Indah (MYOR IJ - RP2,040 - BUY) Michelin (N-R)
MNC (MNCN IJ - RP1,725 - UNDERPERFORM)
Nanya Plastics (1303 TT - NT$71.4 - UNDERPERFORM) Nipon Shukubai (N-R)
Pakuwon (PWON IJ - RP590 - OUTPERFORM) Perusahaan Gas (PGAS IJ - RP2,460 - SELL) Petronas Chemicals (PCHEM MK - RM7.48 - BUY) Petro-Oxo Nusantara (N-R)
Polychem Indo (N-R) Polytama (N-R)
PT Barito Pacific Tbk (N-R) PT Pertamina (N-R)
PTPP (PTPP IJ - RP3,330 - BUY) PTTGC (PTTGC TB - BT71.8 - BUY)
Semen Indonesia (SMGR IJ - RP9,225 - UNDERPERFORM) Shanghai Petrochem (338 HK - HK$4.41 - UNDERPERFORM) Siam Cement (SCC TB - BT532.0 - BUY)
Sulfindo (N-R)
Summarecon (SMRA IJ - RP1,380 - SELL) Surya Citra Media (SCMA IJ - RP2,700 - BUY) Telkom (TLKM IJ - RP4,070 - OUTPERFORM) Temasek (N-R)
Tower Bersama (TBIG IJ - RP5,700 - BUY) TPPI (N-R)
Unilever Indo (UNVR IJ - RP42,850 - OUTPERFORM) United Tractors (UNTR IJ - RP27,800 - BUY)
Wijaya Karya (WIKA IJ - RP2,460 - BUY) XL Axiata (EXCL IJ - RP3,180 - BUY)
Analyst certification
The analyst(s) of this report hereby certify that the views expressed in this research report accurately reflect my/our own personal views about the securities and/or the issuers and that no part of my/our compensation was, is, or will be directly or indirectly related to the specific recommendation or views contained in this research report.
Important disclosures
The policy of CLSA (which for the purpose of this disclosure includes its subsidiary CLSA B.V.) and CL Securities Taiwan Co., Ltd. (“CLST”) is to only publish research that is impartial, independent, clear, fair, and not misleading. Analysts may not receive compensation from the companies they cover. Regulations or market practice of some jurisdictions/markets prescribe certain disclosures to be made for certain actual, potential or perceived conflicts of interests relating to a research report as below. This research disclosure should be read in conjunction with the research disclaimer as set out at www.clsa.com/disclaimer.html and the applicable regulation of the concerned market where the analyst is stationed and hence subject to. This research disclosure is for your information only and does not constitute any recommendation, representation or warranty. Absence of a discloseable position should not be taken as endorsement on the validity or quality of the research report or recommendation.
or controls the activities of CLSA’s research analysts. CLSA’s research analysts report to the management of the Research department, who in turn report to CLSA’s senior management.
Unless specified otherwise, CLSA/CLST did not receive investment banking/non-investment banking income from, and did not manage/co-manage a public offering for, the listed company during the past 12 months, and it does not expect to receive investment banking compensation from the listed company within the coming three months. Unless mentioned otherwise, CLSA/CLST does not own a material discloseable position, and does not make a market, in the securities.
As analyst(s) of this report, I/we hereby certify that the views expressed in this research report accurately reflect my/our own personal views about the securities and/or the issuers and that no part of my/our compensation was, is, or will be directly or indirectly related to the specific recommendation or views contained in this report or to any investment banking relationship with the subject company covered in this report (for the past one year) or otherwise any other relationship with such company which leads to receipt of fees from the company except in ordinary course of business of the company. The analyst/s also state/s and confirm/s that he/she/they has/have not been placed under any undue influence, intervention or pressure by any person/s in compiling this research report. In addition, the analysts included herein attest that they were not in possession of any material, nonpublic information regarding the subject company at the time of publication of the report. Save from the disclosure below (if any), the analyst(s) is/are not aware of any material conflict of interest.
Key to CLSA/CLST investment rankings: BUY: Total stock return (including dividends) expected to exceed 20%; O-PF: Total expected return below 20% but exceeding market return; U-PF: Total expected return positive but below market return; SELL: Total return expected to be negative. For relative performance, we benchmark the 12-month total forecast return (including dividends) for the stock against the 12-month forecast return (including dividends) for the market on which the stock trades.
We define as “Double Baggers” stocks we expect to yield 100% or more (including dividends) within three years at the time the stocks are introduced to our “Double Bagger” list. "High Conviction" Ideas are not necessarily stocks with the most upside/downside, but those where the Research Head/Strategist believes there is the highest likelihood of positive/negative returns. The list for each market is monitored weekly.
Overall rating distribution for CLSA/CLST only Universe:
Overall rating distribution: BUY / Outperform - CLSA:
65.11%; CLST only: 70.67%, Underperform / SELL - CLSA: 34.89%; CLST only: 29.33%, Restricted - CLSA: 0.00%; CLST only: 0.00%. Data as of 28 February 2017.
Investment banking clients as a % of rating category: BUY / Outperform - CLSA: 4.13%; CLST only: 0.00%, Underperform / SELL - CLSA: 7.71%; CLST only: 0.00%, Restricted - CLSA: 0.00%; CLST only: 0.00%. Data for 12-month period ending 28 February 2017.
There are no numbers for Hold/Neutral as CLSA/CLST do not have such investment rankings.
For a history of the recommendations and price targets for companies mentioned in this report, as well as company specific disclosures, please write to: (a) CLSA, Group Compliance, 18/F, One Pacific Place, 88 Queensway, Hong Kong and/or; (b) CLST Compliance (27/F, 95, Section 2 Dun Hua South Road, Taipei 10682, Taiwan, telephone (886) 2 2326 8188). © 2017 CLSA Limited and/or CLST.
© 2017 CLSA Limited, and/or CL Securities Taiwan Co., Ltd. (“CLST”)
This publication/communication is subject to and incorporates the terms and conditions of use set out on
the www.clsa.com website (www.clsa.com/disclaimer.html.). Neither the
publication/communication nor any portion hereof may be reprinted, sold, resold, copied, reproduced, distributed, redistributed, published, republished, displayed, posted or transmitted in any form or media or by any means without the written consent of CLSA group of companies (“CLSA”) and/or CLST.
CLSA and/or CLST have produced this
may not correspond to the published view of CLSA and/or CLST. This is not a solicitation or any offer to buy or sell. This publication/communication is for information purposes only and does not constitute any recommendation, representation, warranty or guarantee of performance. Any price target given in the report may be projected from one or more valuation models and hence any price target may be subject to the inherent risk of the selected model as well as other external risk factors. This is not intended to provide professional, investment or any other type of advice or recommendation and does not take into account the particular investment objectives, financial situation or needs of individual recipients. Before acting on any information in this publication/communication, you should consider whether it is suitable for your particular circumstances and, if appropriate, seek professional advice, including tax advice. CLSA and/or CLST do/does not accept any responsibility and cannot be held liable for any person’s use of or reliance on the information and opinions contained herein. To the extent permitted by applicable securities laws and regulations, CLSA and/or CLST accept(s) no liability whatsoever for any direct or consequential loss arising from the use of this publication/communication or its contents. Where the publication does not contain ratings, the material should not be construed as research but is offered as factual commentary. It is not intended to, nor should it be used to form an investment opinion about the non-rated companies.
Subject to any applicable laws and regulations at any given time, CLSA, CLST, their respective affiliates or companies or individuals connected with CLSA /CLST may have used the information contained herein before publication and may have positions in, may from time to time purchase or sell or have a material interest in any of the securities mentioned or related securities, or may currently or in future have or have had a business or financial relationship with, or may provide or have provided investment banking, capital markets and/or other services to, the entities referred to herein, their advisors and/or any other connected parties. As a result, investors should be aware that CLSA, CLST and/or their respective affiliates or companies or such individuals may have one or more conflicts of interest. Regulations or market practice of some jurisdictions/markets prescribe
any compensation or other benefits from the subject company covered in this publication/communication. If investors have any difficulty accessing this website, please contact [email protected] on +852 2600 8111. If you require disclosure information on previous dates, please contact [email protected].
This publication/communication is distributed for and on behalf of CLSA Limited (for research compiled by non-US and non-Taiwan analyst(s)), and/or CLST (for research compiled by Taiwan analyst(s)) in Australia by CLSA Australia Pty Ltd; in Hong Kong by CLSA Limited; in India by CLSA India Private Limited, (Address: 8/F, Dalamal House, Nariman Point, Mumbai 400021. Tel No: +91-22-66505050. Fax No: +91-22-22840271; CIN: U67120MH1994PLC083118; SEBI Registration No: INZ000001735; in Indonesia by PT CLSA Sekuritas Indonesia; in Japan by CLSA Securities Japan Co., Ltd; in Korea by CLSA Securities Korea Ltd; in Malaysia by CLSA Securities Malaysia Sdn Bhd; in the Philippines by CLSA Philippines Inc (a member of Philippine Stock Exchange and Securities Investors Protection Fund); in Thailand by CLSA Securities (Thailand) Limited; in Taiwan by CLST and in the United Kingdom by CLSA (UK).
India: CLSA India Private Limited, incorporated in November 1994 provides equity brokerage services (SEBI Registration No: INZ000001735), research services (SEBI Registration No: INH000001113) and merchant banking services (SEBI Registration No.INM000010619) to global institutional investors, pension funds and corporates. CLSA and its associates may have debt holdings in the subject company. Further, CLSA and its associates, in the past 12 months, may have received compensation for non-investment banking securities and/or non-securities related services from the subject company. For further details of “associates” of CLSA India please contact [email protected].
recommendation to effect any transactions in the securities discussed herein or an endorsement of any opinion expressed herein. Any recipient of this research in Canada wishing to effect a transaction in any security mentioned herein should do so by contacting CLSA Americas.
United Kingdom: In the United Kingdom, this research is a marketing communication. It has not been prepared in accordance with the legal requirements designed to promote the independence of investment research, and is not subject to any prohibition on dealing ahead of the dissemination of investment research. The research is disseminated in the EU by CLSA (UK), which is authorised and regulated by the Financial Conduct Authority. This document is directed at persons having professional experience in matters relating to investments as defined in Article 19 of the FSMA 2000 (Financial Promotion) Order 2005. Any investment activity to which it relates is only available to such persons. If you do not have professional experience in matters relating to investments you should not rely on this document. Where the research material is compiled by the UK analyst(s), it is produced and disseminated by CLSA (UK). For the purposes of the Financial Conduct Rules this research is prepared and intended as substantive research material.
Singapore: In Singapore, research is issued and/or distributed by CLSA Singapore Pte Ltd (Company Registration No.: 198703750W), a Capital Markets Services licence holder to deal in securities and an exempt financial adviser, solely to persons who qualify as an institutional investor, accredited investor or expert investor, as defined in s.4A(1) of the Securities and Futures Act. Pursuant to Paragraphs 33, 34, 35 and 36 of the Financial Advisers (Amendment) Regulations 2005 of the Financial Advisers Act (Cap 110) with regards to an institutional investor, accredited investor, expert investor or Overseas Investor, sections 25, 27 and 36 of the
Financial Adviser Act (Cap 110) shall not apply to CLSA Singapore Pte Ltd. Please contact CLSA Singapore Pte Ltd (telephone No.: +65 6416 7888) in connection with queries on the report. MCI (P) 033/11/2016
The analysts/contributors to this publication/communication may be employed by any relevant CLSA entity, CLST or a subsidiary of CITIC Securities Company Limited which is different from the entity that distributes the publication/communication in the respective jurisdictions.
MSCI-sourced information is the exclusive property of Morgan Stanley Capital International Inc (MSCI). Without prior written permission of MSCI, this information and any other MSCI intellectual property may not be reproduced, redisseminated or used to create any financial products, including any indices. This information is provided on an "as is" basis. The user assumes the entire risk of any use made of this information. MSCI, its affiliates and any third party involved in, or related to, computing or compiling the information hereby expressly disclaim all warranties of originality, accuracy, completeness, merchantability or fitness for a particular purpose with respect to any of this information. Without limiting any of the foregoing, in no event shall MSCI, any of its affiliates or any third party involved in, or related to, computing or compiling the information have any liability for any damages of any kind. MSCI, Morgan Stanley Capital International and the MSCI indexes are service marks of MSCI and its affiliates. The Global Industry Classification Standard (GICS) was developed by and is the exclusive property of MSCI and Standard & Poor's. GICS is a service mark of MSCI and S&P and has been licensed for use by CLSA.