Journal of Computer Science and Information Technology, Vol. 1, No 1, 2016, pp. 1019 Copyright © 2016 by LPPM UPI YPTK
Detection and Extraction of Brain Hemorrhage on the CT-Scan
Image using Hybrid Thresholding Method
Sumijan
1*, Yuhandri
1, and Wendi Boy
11
Universitas Putra Indonesia YPTK Padang, Sumatera Barat, Indonesia
Received 10 February 2016; Revised 20 March 2016; Accepted 20 June 2016
Abstract
Brain bleeding can occur because of the outbreak of the blood vessels in the brain which culminated into hemorrhagic stroke or stroke due to bleeding. Hemorrhagic Stroke occurs when there is a burst of blood vessels result from some trigger factor. Segmentation techniques to Scanner computed tomography images (CT scan of the brain) is one of the methods used by the radiologist to detect brain bleeding or congenital abnormalities that occur in the brain. This research will determine the area of the brain bleeding on each image slice CT - scan every patient, to detect and extract brain bleeding, so it can calculate the volume of the brain bleeding. The detection and extraction bleeding area of the brain is based on the hybrid thresholding method.
Keywords: CT scan; Hybrid thresholding; Volume; Incision area brain Injury.
1.
Introduction
With the increasing number of transportation vehicles with an affordable cost for the community especially motor vehicles accessible two resulting in the increasing number of traffic accident in Indonesia. Similarly, increasing the number of labor, industry contributes to the increasing number of occupational accidents. Besides that an accident can occur because of the activities of the sport, distribution hobby hunting and so on. The accident resulted in many victims suffered broken bones brain injury, bleeding of the brain and other diseases. The brain injury is one of the most causes that cause the death of the man. According to Shepard from FCA 1998 [1], hemorrhage in the brain can be caused by two things namely trauma and non-trauma. Clash of hardware in the head because of trauma or accident can cause bleeding in the thorax the head or in the brain [2,3]. Bleeding brain recounted the existence of the history of previous trauma, therefore the possibility of that happening is bleeding non-brain trauma [4]. This bleeding can occur because of the outbreak of the blood vessels in the brain which culminated into hemorrhagic stroke or stroke due to bleeding [5,6]. Hemorrhagic Stroke occurs when there is a burst of blood vessels result from some trigger factor. Two types of blood vessels are vulnerable burst (low) obtained in the case of
aneurisma and malformations arteriovenosa (AVM) [7]. Other causes of hemorrhagic stroke is (1)
Drinking drugs diluent routine blood, such as aspirin and warfarin; (2) Drugs such as cocaine; and (3) Cancer of the brain [4,7]. Hemorrhagic stroke is divided into 2:
a. Intracerebral bleeding in the brain. Generally intracerebral bleeding induced by chronic high
b. Subarachnoid hemorrhage. Subarachnoid bleeding is bleeding that fills the cavities subarachnoid namely between cavity layers in (piamater) and middle layer (arachnoid matte) which is part of the membranes that surround the brain (meninges). The most common pathogens are broken aneurisma. Generally broken aneurisma cause headache sore that come suddenly and followed by the loss of consciousness. 35% people died when bled subarachnoid because the extent of bleeding.
The CT scan technology there are some weaknesses on is such as the emergence of artifact (image that should not be there but recorded) [8,9]. This usually arise because patients move during the recording, patients using dental amalgam patches or false joint from metal, or network conditions specific body, Interpretation wide area and the volume of the brain bleeding is done by a specialist doctor radiology, because it is expected to see the unseen by the eyes and still mix between the bleeding area, the object of the skull head and layers of the brain other parts [10]. The time needed to analyze from the acquisition until the image analysis between 15-60 minutes, while patients need quick action and accurate in determining the volume and extensive bleeding stopped for maintenance if could not experience death. The CT scan will only show the possibility of a disorder the structure of the brain invisible, then smooth changes in the difficult network identified. Even the structure of the brain in areas of the brain and back bars head not so good visualizers due to the thickness of the wall of the skirt of bones [11]. The changes that striking (eyes) will be easily detected, such as the brain bleeding or disruption of the growth of the tissues of the brain, because the change is very smooth as stated by specialist doctors radiology [11]. To analyze the image of the brain required reading per special slice slices indicated the bleeding brain, then the result in the total manually to calculate the wide or the volume of bleeding area manually by a specialist doctor radiology to be given to the specialist doctors nerves. To overcome some of the weakness of the CT scan, it needed innovations needed to help law enforcement diagnosis image CT. The development of science especially digital image processing [12,13,14] allows the computer to detect any traumatic brain injury or bleeding of the brain by searching for the features that are often present on the brain. The specific features that have been obtained can be made training data on the machine learning [15,16,17] so that later the system is able to determine the type of injury based on its characteristics and extensive calculations and the volume of the brain bleeding area. Tan in [8] presented a research on the improvement of the quality of the image of CT brain with the purpose to clarify the contrast between the parts of the brain through the dye with the help of histogram algorithm. This research has not been oriented toward the detection of brain injury. Karuna and Joshi [3] do research about area segmentation brain tumors by using texture analysis: angular second moment (ASM), contrast, inverse difference moment (Homogeneity), dissimilarity and entropy. Gillebert [2] in the research proposed automated delineation algorithm that automatically can describe myocardial and brain bleeding on stroke (brain injury) CT image. Further research to identify and extract the image of the brain from the image of CT Scan for classifying brain bleeding and not bleeding brain with classification method the algorithm k -means that examined by Sharma [5]. Next article from Xuguang [10] in research suggested Selection Algorithm Slice (Slice Selection Algorithm), this research proposed algorithm for upgrading the estimation center line with SSA to search full symmetrical position is based on the anatomical features in the detection of brain bleeding. The results of this research with multi-stage algorithm are evaluated on 3313 CT slices of 70 patients and accuracy of 96.9%. Wenan [9] proposed ICM and MASP algorithm to compare both the algorithm to analyze traumatic brain bleeding. The results focus on the automatic processing the image of the brain CT -Scan for segmentation and identify the bleeding arrhythmia brain. Another research, Srimini [6] has proposed algorithm Neuro Fuzzy and ROI extraction to detect and identify and measure the area of the brain abnormal bleeding with different locations vary in the form of the image of CT Scan of the brain 2D.
brain bleeding. The detection and extraction bleeding area of the brain is based on the hybrid thresholding method.
The rest of this paper is organized as follow. Section 2 presents proposed method. Section 3 presents results obtained and following by discussion. Section 4 concludes this work.
2.
Methodology
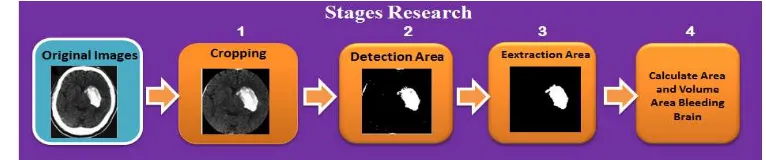
The method or sequence of research done in this research is described in the Figure 1. This research consists of 6 stages namely:
1. The first phase of the cropping area: input cropping process aims to eliminate noise that does not need to be outside the research objects, determine the image of the object of the research will be analyzed and processed and minimize the size of the image of the original brain in order to easily in though and analyzed.
2. The second stage of the detection areas of the brain: the purpose of this phase is to determine the areas of the brain bleeding in order not to mix with the limit white area is not an area that bleeding, to distinguish between the object that will be examined and the object that is not examined because the same white color.
3. The third stage extraction areas of the brain: this stage aims to throw away the black spots on the image bleeding o not from the results of the detection area bleeding.
4. The fourth stage count area each slices / pieces of the brain: the purpose of this stage is to calculate the area of the brain bleeding per slices have detection to perform the calculation area bleeding from the brain. For the next wide conversion object in pixels into square centimeters. 5. The fifth stage of the count the volume of the brain area: the purpose of this stage is to calculate the volume of the brain bleeding area has been successfully calculated area bleeding from the brain. For the next area volume conversion object bleeding in pixels into cubic centimeters.
Figure 1: Stages Research
2.1.
Citra
inputs from the CT Scan
(Image of
their Grayscale
)
Source: Hospital M. Djamil Padang West Sumatra, 2015
Figure 2 (a) The Image of the brain Normal and (b) The Image of the brain Bleeding
2.2.
Cropping Input Area
Figure 2 (a) is the image of the original brain from hospital M. Djamil Padang, West Sumatera, Indonesia. In the image of the brain is much noise such as visible around the ellipse. Meanwhile, from Figure 2 (a), there is white and black colors so that affect the research object. For that reason, we need to do cropping to remove noise that does not need to be outside the research object. Determining the image from the object that has been analyzed and processed in order to reduce image size of genuine brain is done to make it easily to be analyzed. To be able to cut (crop) Figures with the functions provided by Matlab, some property of the image must be in the know first. The properties is X is the position of the column of the upper left corner of the area that is not in the crop; Y is the position of the line from the upper left corner of the area that is not in the crop; the Delta x is the width of the area that is not in the crop; the Delta y is high in crop that would area. Four those properties, they can be depicted in Figure 3. The functions provided by Matlab that can be used to crop the Figure is imcrop. Imcrop usage example can be seen in Figure 5 (a) which is the image of the beginning and Figure 5 (b) which is the image cropping results.
Figure 3: The properties forCropping Area
Figure 4: Ellipse shape cropping process
In the Figure 4, the algorithm cropping stage of the process is intended to eliminate the noise that does not need to be outside the research object, determine the image of the object of the research that has been analyzed and processed and minimize the size of the image of the original brain in order to easily in though and analyzed. Thus, we can obtain a clean image from the noise that can interfere with the process of processing the image.
2.3.
Brain Bleeding Area Detection
Stage area detection this bleeding perform analysis spread of white intensity including indicated bleeding so that know increased the brightness or contrast stretching and the spread of the White House, the determination of the boundaries of the separation of theobject from its background, the percentage of white and black composition also texture intensity to the process of the identification of the image of the brain further, determine the value of the threshold, determine the areas of the brain in and outside, in order not to mix with the limit shell area of the brain and Determine the value of the threshold with how to distinguish the two groups, namely the object that will be examined and the background of the object, who have part that rests on each other based on histogram.
Figure 5 (a) The image of the brain before cropping, (b) Image cropping results
The area of bleeding brain white
(b)
The algorithm 01: Process Cropping Ellipse shape:
1. Read the input image A=imread('Patients 1/Slice 05.bmp'); 2. Show input image figure(1), imshow(A);
3. count the size and intensity [M, N, L] = size(A);
4. determine the central point of the ellipse (x,y)c = hotfixes(size(A) / 2);
5. determine the radius of the central point (y-firebrand presidents, x-firebrand presidents) r_sq = [80, 105] .^ 2;
6. main step and coordinates the position of the ellipse will dicrop [X, Y] = meshgrid(1:size(A, 2), 1:size(A, 1));ellipse_mask = (r_sq(2) * (X - c(2)) .^ 2 + ... r_sq(1) * (Y - c(1)) .^ 2 <= successfully met(r_sq)); the
7. process of cropping A_cropped = bsxfun(@times, A, uint8(ellipse_mask)); 8. Show results cropping figure(2), imshow(A_cropped);
2.4.
Hybrid Image Thresholding Method
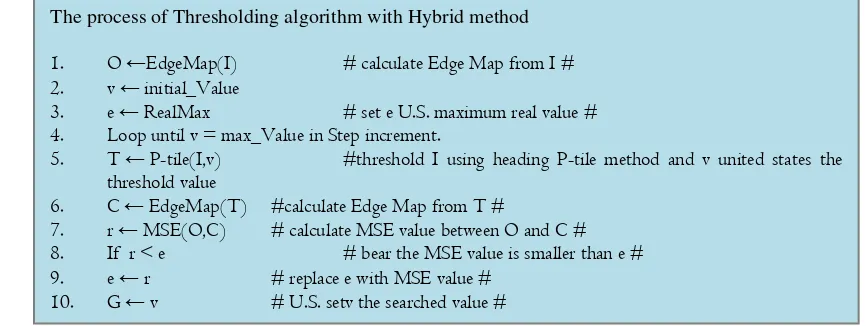
The purpose of the hybrid image thresholding methods utilize the characteristics of the image to help the process of thresholding with combining the method P-tile as the global thresholding method with the edge to retrieve information form of detect. Using the information edge detection, area object obtained the ratio is determined by the form of objects. This information is especially useful for applications that need to enhance the shape of objects in the original image 4. Give the value of the image I became the original image and G will be the threshold limit value that is looking, Hybrid algorithmImage Thresholding method is as follows [4].
Figure 6: The algorithm to delete an area that is not an area of the brain bleeding
This method is simple and suitable for all types of edge detection, because only iteration in continuous time (determine the value of step by step). This method does not add more to the method of complexity P-tile and detect the edge make this hybrid approach. In the Hybrid Image Thresholding method, we need to find the best edge to be combined with edge detection methods P-tile. This method is trying to combine the method P-tile with five types of edge detection, canny, Prewitt, Roberts, Sobel and Laplacian of Gaussian (LOG). The first four is a gradient based on edge detection and the last is based on the Laplacian. In the scenario of all forms, information is required for the image with the appropriate threshold, for each scenario. According to the subjective evaluation of the results, can find that combines the method P-tile with canny edge detection produces the most stable results. This combination consistently produce image that have quality better than or equal to the other.
2.5.
Extraction of an area of the brain bleeding
Based on the results of object detection of hybrid algorithm where there is still a white area that is not an area of the brain bleeding search. This means that the area is considered noise and must be removed or cleaned. Figure 4 above presents the algorithm to delete an area that is not an area of the brain bleeding. Figure 4 shows the flowchart to eliminate white spots which is not an area of bleeding. The implementation of the algorithm in Figure 4 will produce results as presented in Figure 6. From Figure 6, it can be seen that the exodus results algorithm are identical. Furthermore, based on the results of this can be selected one of them both in this research done by using the hybrid algorithm.
The process of Thresholding algorithm with Hybrid method
1. O ←EdgeMap(I) # calculate Edge Map from I #
2. v ← initial_Value
3. e ← RealMax # set e U.S. maximum real value #
4. Loop until v = max_Value in Step increment.
5. T ← P-tile(I,v) #threshold I using heading P-tile method and v united states the
threshold value
6. C ← EdgeMap(T) #calculate Edge Map from T #
7. r ← MSE(O,C) # calculate MSE value between O and C #
8. If r < e # bear the MSE value is smaller than e #
9. e ← r # replace e with MSE value #
Figure 6: The diagram of overall detectionand extraction
3.
Results and Discussion
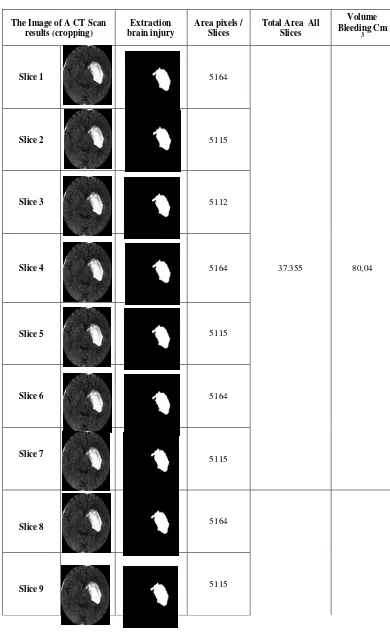
Table 1 shows the results of the calculation of the volume of the brain bleeding image area with the formula: The total pixels all slice * distance between slice * (number of slice - 1), the total pixels: 37.355,00 pixels 2, the distance between the slice: 0.05 cm, number of slice: 10, volume: 80.04 cm3, the execution time is 5 seconds. Overall detection, extraction and BRR can be depicted in the Figure 7, the results of this research can help parties doctors and radiologists to analyze the image of the results of the CT scan, so that a doctor and radiologists not one interpretation in detect and diagnose brain bleeding Scan CT results. In the end the decision making that is different between the doctors or expert’s radiologistcan be resolved.
Figure 7 (a) Input image area detection results brain bleeding; (b) the image of the results of extraction of the area of the brain bleeding
Figure 7 (a) is the stage to eliminate the black spots object in area where seen that bleeding area of the brain has not been detected perfectly. This can be seen the existence of the black spots in the area of heavy bleeding, including on the main areas. The results of the bleeding area extraction have not mixed with noise such as Figure 7 (b) For that can be done the calculation area that
(a)
(b)
bleeding cool, the process can be done by searching for each slice (pieces) brain every patient. The brain Slice every patient there 6-10 and not all slice slices bleeding so it needed a slice bleeding.
Table 1: The results of extensive calculations and the volume of the brain bleeding area
The Image of A CT Scan results (cropping)
Extraction brain injury
Area pixels / Slices
Total Area All Slices
Volume Bleeding Cm
3
Slice 1 5164
37.355 80,04
Slice 2 5115
Slice 3 5112
Slice 4 5164
Slice 5 5115
Slice 6 5164
Slice 7
5115
Slice 8 5164
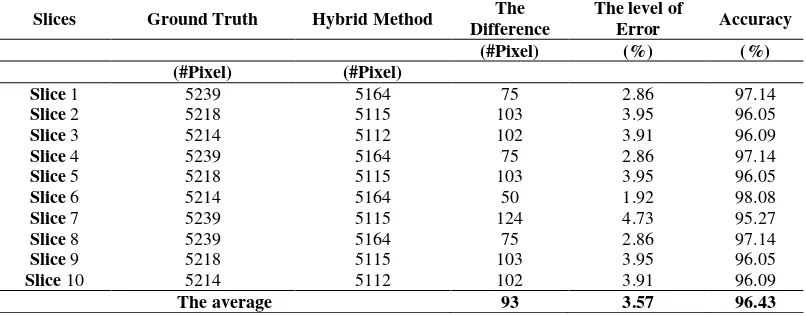
Table 2: The level of testing the accuracy of the algorithm with 10 Slices
Slices Ground Truth Hybrid Method The
Difference
The level of
Error Accuracy
(#Pixel) (%) (%)
(#Pixel) (#Pixel)
Slice 1 5239 5164 75 2.86 97.14
Slice 2 5218 5115 103 3.95 96.05
Slice 3 5214 5112 102 3.91 96.09
Slice 4 5239 5164 75 2.86 97.14
Slice 5 5218 5115 103 3.95 96.05
Slice 6 5214 5164 50 1.92 98.08
Slice 7 5239 5115 124 4.73 95.27
Slice 8 5239 5164 75 2.86 97.14
Slice 9 5218 5115 103 3.95 96.05
Slice 10 5214 5112 102 3.91 96.09
The average 93 3.57 96.43
Table 2 above shows the results of testing the level of accuracy with the method is Hybrid compared with the Ground Truth, result calculation to get the level of accuracy of ten slices by an average of 96.43%. From Table 2, the results of the test calculations between the Hybrid thresholding method and Ground Truth with 10 slices is as follows: The Hybrid method of difference area bleeding slices 1 = 175 pixels, slice 2 = 203 pixels and slice 3 = 202 pixels, slice 4 = 75 pixels, slice 5 = 103 pixels and slice 6 = 50 pixels, slice 7 = 125 pixels, slice 8 = 75 pixels and slice 9 = 103 pixels and slices 10 =102 pixels, calculation error level with Hybrid method slice 1 = 2.86%, slice 2 = 3.95%, slice 3 = 3.91%, slice 4 = 2.86%, slice 5 = 3.95%, slice 6 = gained 1.92%, slice 7 = 4.73%, slice 8 = 2.86%, slice 9 = 3.95%, slice 10 = 3.91% , and the calculation of the level of accuracy of the slices 1 = 97.14%, slice 2 = 96.05%, slice 3 = 96.09%, slice 4 = 97.14%, slice 5 = 96.05%, slice 6 = 98.08%, slice 7 = 95.27%, slice 8 = 97.14%, slice 9 = 96.05%, slice 10 = 96.09%, so that the average accuracy = 96.43%
.
4.
Conclusion
This paper studied detection and extraction of brain hemorrhage on the CT-scan image using hybrid thresholding method. The algorithm cropping ellipse model proposed that can separate accurately 96.43 percent of the areas of the skull head and the brain from other areas in the image of a CT scan. This result is very easy and can speed up the process of extraction of the area in the brain bleeding. Hybrid thresholding Method for object area is very effective with achievement up to 96.43 percent in segmentation and extract the area of the brain bleeding. Extensive counting algorithm and volume can calculate the area of the brain bleeding per slice and volume.
Acknowledgement
The authors would like to thanks Universitas Putra Indonesia “YPTK” Padang for supporting this research.
References
[1] FCA, 1998, Fact sheet: Tbi traumatic injury: selected statistics. Http://www.caregiver.org/factsheets/tbi_statsC.html
[2] C. GillebertR., GlynW.Humphreys G.W., Mantini G., 2014, Automated delineation of stroke lesions using heading brain CT images, Neuro Image: Clinical 4 (2014) 540-548.
Slice 10
[3] Karuna, M. and Joshi, A., 2013. Automatic Detection and Severity analysis of brain tumors using GUI in matlab. International Journal of Research in Engineering and Technology, 2(10), pp.586-594.
[4] Samopa, F. and Asano, A., 2009. Hybrid image thresholding method using edge detection.
International Journal of Computer Science and Network Security, 9(4), pp.292-299.
[5] Sharma, B. and Venugopalan, K., 2012. Automatic segmentation of brain CT scan image to identify hemorrhages. Int. J. Comput. Appl, 40(10), pp.0975-8887.
[6] Srimani, P.K. and Mahesh, S., 2013. A Comparative study of different segmentation techniques for brain tumor detection. International Journal of Emerging Technologies in Computational and Applied Sciences, 4(02), pp.192-197.
[7] Gong, T., Liu, R., Tan, C.L., Farzad, N., Lee, C.K., Pang, B.C., Tian, Q., Tang, S. and Zhang, Z., 2007, October. Classification of CT brain images of head trauma. In IAPR International Workshop on Pattern Recognition in Bioinformatics (pp. 401-408). Springer Berlin Heidelberg.
[8] Tan T. L., K. S. Sim card, C.K. Tan and A. K.Chong, 2008, CT Image Enhancement by Colorization for Brain Infarct Detection, Faculty of Engineering and Technology, Multimedia University, Malaysia
[9] Wenan C., Rebecca S., Soo-Yeon J., Kevin R. and Kayvan N., 2009, Automated laparoscopic assisted ventricular systems segmentation in brain CT images by combining low-level and high-level egmentation template match, BMC Medical Informatics and Decision making 2009, 9(Suppl 1):S4 doi:10.1186/1472- 6947-9-S1-S4
[10] Qi, X., Belle, A., Shandilya, S., Chen, W., Cockrell, C., Tang, Y., Ward, K.R., Hargraves, R.H. and Najarian, K., 2013. Ideal midline detection using automated processing of brain CT image. Open the Journal of Medical Imaging, 2013, 3, 51-59.
[11] Rumah Sakit Umum Pusat Dr. M. Djamil, 2015, Buku Radiologi, Jl. Perintis Kemerdekaan Padang 25127 - Sumatera Barat, Indonesia.
[12] Keys, R., 1981. Cubic convolution interpolation for digital image processing. IEEE transactions on acoustics, speech, and signal processing, 29(6), pp.1153-1160.
[13] Lee, J.S., 1983. Digital image smoothing and the sigma filter. Computer Vision, Graphics, and Image Processing, 24(2), pp.255-269.
[14] Burger, W. and Burge, M.J., 2016. Digital image processing: an algorithmic introduction using Java. Springer.
[15] Liberty, E., Lang, K. and Shmakov, K., 2016. Stratified Sampling Meets Machine Learning. In
Proceedings of The 33rd International Conference on Machine Learning (pp. 2320-2329).
[16] Smyser, C.D., Dosenbach, N.U., Smyser, T.A., Snyder, A.Z., Rogers, C.E., Inder, T.E., Schlaggar, B.L. and Neil, J.J., 2016. Prediction of brain maturity in infants using machine-learning algorithms.
NeuroImage.
[17] Meng, X., Bradley, J., Yuvaz, B., Sparks, E., Venkataraman, S., Liu, D., Freeman, J., Tsai, D., Amde, M., Owen, S. and Xin, D., 2016. Mllib: Machine learning in apache spark. JMLR, 17(34), pp.1-7.