LAMPIRAN A
Percobaan Validasi Metode Analisa Propranolol HCl 1. Penentuan Kurva Baku
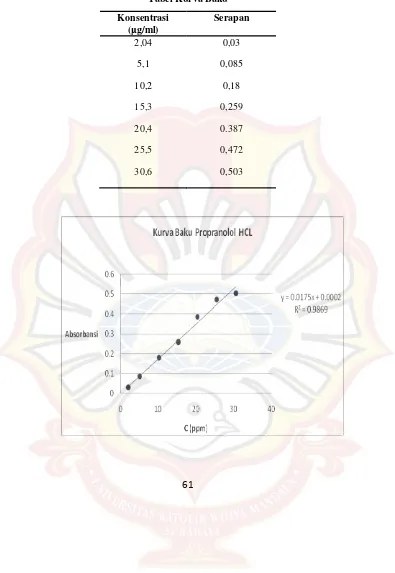
Data ini adalah data dari kurva baku selama tiga hari berturut – turut
Dari data tersebut, diketahui bahwa data – data tersebut setelah diuji anava tidak berbeda bermakna sehingga dipilih salah satu dari data tersebut yaitu data yang pertama sebagai kurva baku terpilih.
Tabel Kurva Baku Konsentrasi
( g/ml)
Serapan
2,04 0,03
5,1 0,085
10,2 0,18
15,3 0,259
20,4 0.387
25,5 0,472
2. Perhitungan LOD dan LOQ
Jumlah 2,73535E-03
(
)
Nilai b diperoleh dari kurva baku = 0,0175
=
b
S
LOD
3
y/x=
b
S
LOQ
10
y/x= 13,3654 g/ml
3. Uji Akurasi
Penimbangan C teoritis ( g/ml )
Serapan C pengamatan ( g/ml )
% recovery
50 mg/ml 30 0,518 29,52 98,4
50 mg/ml 30 0,527 30,03 100,1
50 mg/ml 30 0,523 29,80 99,3
50 mg/ml 30 0,528 30,09 100,3
49 mg/ml 30 0,517 29,46 98,2
51 mg/ml 30 0,531 30,26 100,9
Rata – rata % recovery = ( 98,4 + 100,1 + 99,3 + 100,3 + 98,2 + 100,9) / 6
LAMPIRAN B
DATA – DATA dan PERHITUNGAN MOISTURE CONTENT
Formula (-1)
W1 (gram) W2 (gram) ( W1 – W2) % moisture content
0,3473 0,3346 0,0127 3,85 %
0,3726 0,3586 0,0139 3,9 %
0,3549 0,3415 0,0135
3,95 %
Rata – rata 3,9 ± 0,05 %
Formula (a)
W1 (gram) W2 (gram) ( W1 – W2) % moisture content
0,3027 0,2920 0,0106 3,66 %
0,3088 0,2980 0,0108 3,7 %
0,2868 0,2765 0,0103 3,74 %
Formula (ab)
W1 (gram) W2 (gram) ( W1 – W2) % moisture content
0,4658 0,4500 0,0158 3,52 %
0,4961 0,4789 0,0172 3,6 %
0,5013 0,4835 0,0178 3,68 %
Rata – rata 3,6 ± 0,08 %
Formula (b)
W1 (gram) W2 (gram) ( W1 – W2) % moisture content
0,4497 0,4333 0,0165 3,8 %
0,4294 0,4135 0,0159 3,85 %
0,4666 0,4491 0,0175 3,9 %
Anova: Single Factor
SUMMARY
Groups Count Sum Average Variance
Row 1 4 14.83 3.7075 0.02209
Row 2 4 15.05 3.7625 0.01896
Row 3 4 15.27 3.8175 0.01643
ANOVA
Source of Variation SS df MS F P-value F crit
Between Groups 0.0242 2 0.0121 0.63158 0.55377 4.2565 Within Groups 0.172425 9 0.019158
LAMPIRAN C
Jumlah Propranolol HCl yang Melintasi Membran sebagai Fungsi Akar Waktu
Data merupakan rata – rata tiga kali replikasi
Waktu
(menit)
Jumlah proranolol HCl yang melintasi membran ( g/ml)
(-1) (a) (b) (ab)
15 11.89253 5.530629 13.91158 8.254438
30 15.68301 11.98777 32.63539 9.206819
45 25.7973 22.44491 41.51158 14.50206
60 36.94015 29.93063 55.47349 15.51158
90 42.10206 38.02587 77.51158 18.73063
120 45.94968 42.31158 110.1402 25.53063
150 48.90206 45.94968 113.7402 34.42587
180 51.26396 51.13063 114.2354 35.98777
210 76.84491 53.58777 116.7687 38.63539
240 105.4354 67.94968 118.5402 48.5211
270 112.1973 76.5592 122.1021 51.14968
300 93.54968 72.31158 125.3592 53.85444
330 79.47349 70.80682 68.02587 51.94968
LAMPIRAN D
Jumlah Propranolol HCl yang Melintasi Membran sebagai Fungsi Waktu
Data merupakan rata – rata tiga kali replikasi
Waktu
(menit)
Jumlah proranolol HCl yang melintasi membran ( g/ml)
(-1) (a) (b) (ab)
15 3.031 1.37464 2.37474 1.00289
30 4.334 3.73836 5.89674 3.00893
45 7.643 4.86432 9.374849 5.45361
60 12.132 5.00356 12.57383 6.13448
90 14.006 5.45673 17.45675 7.45634
120 16.435 6.223 19.40009 8.8734
150 24.425 7.98 21.7383 9.00324
180 24.543 8.457 23.65743 9.28293
210 25.934 9.345 24.12339 12.00216
240 27.521 10.278 26.94001 14.78392
270 28.674 10.98 28.253 16.8732
300 29.317 12.703 29.298 17.43092
330 34.405 14.238 31.687 20.10045
Lampiran E
Perhitungan Anava Untuk Model Pelepasan
The Model F-value of 255.08 implies the model is significant. There is only a 0.01% chance that a "Model F-Value" this large could occur due to noise.
Values of "Prob > F" less than 0.0500 indicate model terms are significant. In this case A, B, AB are significant model terms.
Values greater than 0.1000 indicate the model terms are not significant. If there are many insignificant model terms (not counting those required to support hierarchy), Model reduction may improve your model.
The "Pred R-Squared" of 0.9767 is in reasonable agreement with the "Adj Source Sum of
B-GLISEROL 2.50 1 2.50 147.88 < 0.0001
"Adeq Precision" measures the signal to noise ratio. A ratio greater than 4 is desirable.
Your ratio of 36.506 indicates an adequate signal. This model can be used to navigate the design space.
Final Equation in Terms of Coded Factors: PELEPASAN =
Final Equation in Terms of Actual Factors: PELEPASAN =
+4.57
-0.91 * A
-0.46 *B
-0.19 * A * B
+4.57275
-0.91408 * HPMC -0.45658 * GLISEROL
Lampiran F
Perhitungan Anava Untuk Model Penetrasi
The Model F-value of 885.94 implies the model is significant. There is only a 0.01% chance that a "Model F-Value" this large could occur due to noise.
Values of "Prob > F" less than 0.0500 indicate model terms are significant. In this case A, B, AB are significant model terms.
Values greater than 0.1000 indicate the model terms are not significant. If there are many insignificant model terms (not counting those required to support hierarchy), model reduction may improve your model.
Source Sum of square df Mean
A-HPMC 7.247E-003 1 7.247E-003 2442.18 < 0.0001
B-GLISEROL 3.640E-005 1 3.640E-005 12.27 0.0081
AB 6.035E-004 1 6..035E-004 203.37 < 0.0001
Pure Error 2.374E-005 8 2.968E-006
Cor Total 13.08 11
Std. Dev. Mean C.V. % PRESS
1.723E-003 0.063 2.75 5.342E-005
R-Squared Adj R-Squared Pred R-Squared Adeq Precision
The "Pred R-Squared" of 0.9932 is in reasonable agreement with the "Adj R-Squared" of 0.9959. "Adeq Precision" measures the signal to noise ratio. A ratio greater than 4 is desirable. Your ratio of 63.679 indicates an adequate signal.
Final Equation in Terms of Coded Factors: PENETRASI =
Final Equation in Terms of Actual Factors: PENETRASI =
+0.063
-0.025 * A
-1.742E-003 *B
+7.092E-003 * A * B
+0.062592
-0.024575 * HPMC
-1.74167E-003 * GLISEROL
Lampiran G Kondisi Uji Optimal
Constraints
Lower Upper Lower Upper Name Goal Limit Limit Weight Weight Importance
A:HPMC is in range -1 1 1 1 3
B:GLISEROL is in range -1 1 1 1 3
PELEPASAN maximize 2.941 5.991 1 1 3 PENETRASI maximize 0.032 0.098 1 1 3
Solutions
Number HPMC GLISEROL PELEPASAN PENETRASI Desirability
1 -1.00 -1.00 5.757 0.096 0.946 Selected
2 -1.00 -0.93 5.73783 0.0953732 0.938 3 -1.00 -0.71 5.67856 0.0934354 0.914 4 -1.00 -0.54 5.63305 0.0919474 0.895