Summary We used an existing analytical model of stem-wood growth in relation to nitrogen supply, which we describe in an accompanying paper, to examine the long-term effects of harvesting and fire on tree growth. Our analysis takes into account the balance between nitrogen additions from deposi-tion, fixadeposi-tion, and fertilizer applications, and nitrogen losses from stemwood harvesting, regeneration burning, leaching and gaseous emissions. Using a plausible set of parameter values for Eucalyptus, we conclude that nitrogen loss through fire is the main factor limiting sustainable yield, defined as the maxi-mum mean annual stemwood volume increment obtained in the steady state, if management practices are continued indefi-nitely. The sustainable yield is 30 m3 ha−1 year−1 with harvest-ing only, 15 m3 ha−1 year−1 with harvesting and regeneration burning, and 13 m3 ha−1 year−1 with harvesting, fire, leaching
and gaseous emissions combined.
Our approach uses a simple graphical analysis that provides a useful framework for examining the factors affecting sustain-able yield. The graphical analysis is also useful for extending the application of the present model to the effects of climate change on sustainable yield, or for interpreting the behavior of other models of sustainable forest growth.
Keywords: fire, growth, harvesting, mean annual increment, sustainability.
Introduction
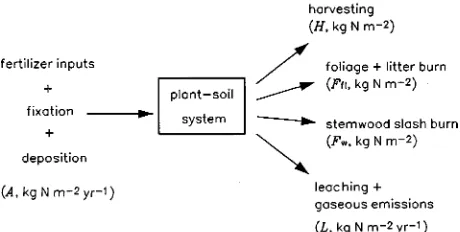
In managed forests, the balance between inputs and outputs of nutrients over successive rotations is a major ecological con-straint on the sustainability of site productivity. As a major nutrient for plant growth, nitrogen has been extensively stud-ied in this context. Inputs of nitrogen may occur through wet and dry atmospheric deposition, symbiotic and non-symbiotic fixation, and fertilizer applications; nitrogen may be lost through leaching and gaseous emissions, removal of harvested biomass (Turner 1981, Raison et al. 1982, Stewart et al. 1985) and fire (O’Connell et al. 1981, Grove et al. 1986, Walker et al. 1986, Raison et al. 1990, 1993). In Australian forests, fire is widely used to reduce accumulated fuel (and thus the risk of uncontrolled fires), to clear slash debris and to regenerate seedlings.
Understandably, most studies of the effects of fire on
nitro-gen budgets and cycling have been limited to time scales of months to a few years (e.g., Grove et al. 1986, Raison et al. 1990). The immediate effects, such as release of mineral nitro-gen through oxidation of organic matter, are usually beneficial to plant nutrition, but they occur in association with direct nitrogen losses to the atmosphere from volatilization and ash transport, in addition to indirect losses such as leaching of released nitrogen or erosion of surface soil and ash. Little is known of the cumulative effect of fire and harvesting on forest nutrition and growth over time scales spanning several rota-tions. As a result, models of the interactions between forest growth, fire and harvesting regimes, and nutrient balance pro-vide valuable tools for extrapolating over these longer time scales.
In the preceding article (Dewar and McMurtrie 1996), we described a simple process-based model of stemwood growth in relation to plant-available nitrogen supply (Uo, kg N m−2
year−1); the model predicts the variation of stemwood volume (or carbon equivalent) with stand age for an undisturbed stand. The supply rate, Uo, refers to external inputs as described
above, in addition to nitrogen supplied through mineralization of organic matter. In this paper, we combine that model with simple assumptions about external nitrogen inputs and losses, focusing on removals in harvesting, regeneration burning, leaching and gaseous emissions. We use the combined model to define the term ‘‘sustainable yield’’ in an unambiguous way, and to quantify its dependence on the individual contributions to nitrogen removal. Our approach exploits a simple graphical analysis, which provides a useful general framework for exam-ining the factors affecting sustainable yield.
The model
Stemwood growth in relation to nitrogen supply
Dewar and McMurtrie (1996, this issue) (hereafter referred to as DM) presented a model of stemwood growth in relation to nitrogen supply, and applied the model to predict the variation of stemwood volume (or carbon equivalent) with stand age for an unharvested stand. A complete mathematical description of the model is given in DM, and only a brief summary is given here. Symbols used, their definitions and units are listed in Table 1. In the model, which is based on the work of
McMur-Sustainable stemwood yield in relation to the nitrogen balance of forest
plantations: a model analysis
RODERICK C. DEWAR and ROSS E. M
CMURTRIE
School of Biological Science, University of New South Wales, Sydney NSW 2052, Australia
Received March 2, 1995
trie and Wolf (1983) and McMurtrie (1985, 1991), four dy-namic variables are represented: stemwood carbon (cw, kg C
m−2, which includes stems, branches and coarse roots), foliage carbon (cf) and nitrogen (nf), and fine root carbon (cr).
Stem-wood and fine roots are assumed to have fixed N/C ratios. Total carbon production by trees (G, kg C m−2 year−1) is given by a nitrogen-dependent light utilization coefficient mul-tiplied by absorbed photosynthetic radiation, and is allocated to each of the three tree components in fixed proportions. Maintenance respiration in stemwood and fine roots is explic-itly represented, as is senescence of all tree components; foli-age maintenance respiration and all components of plant growth respiration are included implicitly in the definition of G. Nitrogen uptake by trees (U, kg N m−2 year−1) depends on root mass and on the rate at which plant-available nitrogen is supplied (Uo):
U=Uo cr cr+Kr
, (1)
where Kr is the value of root carbon at which 50% of the
available nitrogen is taken up. As discussed by DM (their Appendix A), the constant Kr may be interpreted in terms of
the nitrogen absorption capacity of tree roots, the intensity of competition for nitrogen from other vegetation, and the rate of nitrogen loss from the system through leaching and gaseous emissions. The rate Uo represents nitrogen supplied by net
mineralization (M) within the system, plus additions of nitro-gen from outside the system (A) due to fertilizer inputs, atmos-pheric deposition, and fixation:
UO=M+A. (2)
In DM, Uo is taken to be a constant parameter throughout the
life of the stand; for constant external inputs (A), this implies that M is also constant so that the model ignores variations in M with stand age associated with the dynamics of litter and soil organic matter decomposition. In this study, in order to exploit the results of DM, we will also assume that Uo is constant
within a given rotation. However, in the sustainability analysis
Table 1. Symbol definitions. Abbreviations: dm = dry matter; m−2 = per unit ground area (N fluxes are re-expressed on a per hectare basis in Figures 3b--5); X* = equilibrium value of X at canopy closure. Subscripts: f = foliage; w = stemwood; r = fine roots; l = aboveground litter; fl = foliage and aboveground litter.
Symbol Definition Units
A Addition rate of N from fertilizer inputs, atmospheric deposition and fixation kg Nm−2 year−1
cf, cf* Foliage C kg C m−2
cl, cl* Aboveground litter C kg C m−2
cw, cr Stemwood and fine root C kg C m−2
cw(n) Value of cw in the nth rotation (n = 1, 2, ...) kg C m−2
fh Fraction of harvested stemwood removed from site
fcw Fractional C content of stemwood dm kg C kg−1 dm
fiburn ; i = f, l, w Fraction of N lost in regeneration burn
Ffl, Fw Amount of N lost in regeneration burn kg N m−2
G, G* Total C production by trees (net of canopy maintenance and plant growth respiration) kg C m−2 year−1
H Amount of N removed by stemwood harvesting kg N m−2
Kr Fine root N uptake coefficient kg C m−2
L Rate of N loss from leaching and gaseous emissions kg N m−2 year−1
M Net mineralization rate kg N m−2 year−1
MAI Mean annual stemwood volume increment m3 ha−1 year−1
nf Foliage N kg N m−2
t Stand age year
T Optimal rotation length year
Tn Value of T in the nth rotation (n = 1, 2, ...) year
U Rate of N uptake by trees kg N m−2 year−1
Uo Supply rate of plant-available N kg N m−2 year−1
Y Maximum MAI in a given rotation m3 ha−1 year−1
Ys Sustainable yield (steady-state value of Y) m3 ha−1 year−1
γf, γl Specific senescence rate year−1
ηi, i = f, w, r Carbon production allocation fraction
λ Rate of approach of G towards equilibrium year−1
µi, i = w, r Sum of specific maintenance respiration and senescence rates year−1
νf, νf*, νl, νw N/C Ratio kg N kg−1 C
Ω Rotation-averaged rate of N loss from burning foliage and litter, leaching and gaseous emissions kg N m−2 year−1
ρ Stemwood density kg dm m−3
presented below, we will examine the long-term consequence of changes in M (and therefore Uo) over successive rotations.
By introducing some simplifying approximations into the basic growth model outlined above, DM derived various ana-lytical results describing the relationship of stemwood growth to nitrogen supply (Uo). For example, the mean annual
stem-wood volume increment (MAI, m3 ha−1 year−1) at stand age t (years) is defined by:
MAI(t)= 10 4
ρfcw
cw(t) t ,
(3a)
where ρ is the stemwood density (kg dry matter m−3), fcw is the
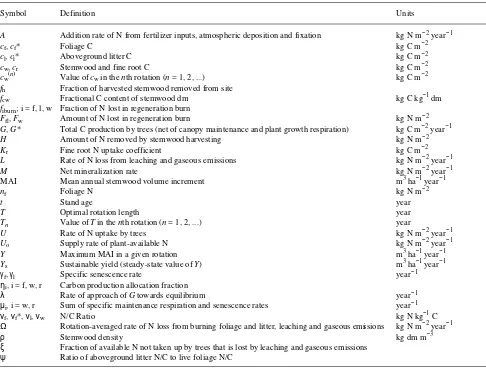
stemwood fractional carbon content (kg C kg−1 dry matter), and the factor of 104 converts from m−2 to ha−1. Figure 1 shows the variation of stemwood carbon [cw(t)] and mean annual
increment [MAI(t)]with stand age, predicted analytically by the model when Uo = 100 kg N ha−1 year−1, with other
pa-rameter values given in DM. Stemwood carbon follows a realistic sigmoidal growth pattern, so that MAI first increases to a maximum rate (here, 18 m3 ha−1 year−1 at t≈ 19 years) and then gradually declines as the stand ages. In the model, this decline is caused by increasing stemwood maintenance respi-ration and senescence, with foliage biomass and carbon pro-duction remaining fixed after canopy closure. Alternative hypotheses for the mechanisms underlying the decline in pro-ductivity of old stands are examined by Murty et al. (1996, this issue).
To optimize the average volume output of the stand, the forest should be harvested at the age of maximum MAI. Al-though economic factors may be more important to a forest manager deciding when to harvest, the concept of maximum MAI continues to be widely used as a characteristic of stem-wood growth in forestry yield tables. In DM it was shown that the dependence of maximum MAI (Y) on nitrogen supply (Uo) is given approximately by:
Y(Uo)= maximum MAI
≈ 104 ρfcw
ηwG∗(Uo)
1
1 +
√
2 µwλ(Uo)
, (3b)
in which ηw is the fraction of total carbon production (G)
allocated to stemwood, G* is the equilibrium value of G at canopy closure, λ (year−1) describes the rate at which G ap-proaches G*, and µw (year−1) is the combined specific rate of
stemwood maintenance respiration and senescence.
The corresponding optimal rotation length (T = stand age at maximum MAI) is given approximately by:
T(Uo)≈
√
2
λ(Uo)µw
. (4)
According to these equations, Y and T are functions of Uo
through the quantities G* and λ (which also depend on all the other model parameters). Dewar and McMurtrie (1996) ob-tained analytical expressions for the functions G*(Uo) and
λ(Uo) (see their Appendices B and C); their results show that λ
(and therefore T) is relatively insensitive to Uo, but that G*
(and therefore Y) varies approximately linearly with Uo.
Nitrogen losses due to harvesting, regeneration burn and ‘‘leakage’’
We now consider the nitrogen losses that occur over one rotation of a managed plantation that is harvested at maximum mean annual increment (i.e.,when stand age = T), then sub-jected to a regeneration burn. The amount of nitrogen removed in harvesting (H, kg N ha−1) is given by:
H=cw(T)νwfh, (5)
where cw(T) is the amount of stemwood carbon at the end of
the rotation, νw is the (constant) stemwood N/C ratio, and fh is
the fraction of stemwood removed from the site. Dewar and McMurtrie (1996) calculated cw(T) for a given value of
nitro-gen supply (Uo) during the rotation (their Equation 8).
During the regeneration burn, nitrogen is lost to the atmos-phere by the combustion of standing foliage, aboveground litter, and stemwood slash that has not been removed from the site. In each case, we assume that the amount of nitrogen lost is proportional to the total fuel N content. Therefore, the nitrogen lost from burning foliage and aboveground litter (Ffl,
kg N m−2) is:
Ffl=cf(T)νf(T)ffburn+cl(T)νl(T)flburn, (6a)
where cf(T) and cl(T) are the amounts of foliage carbon and
aboveground litter carbon at the end of the rotation, νf(T) and
νl(T) are the corresponding N/C ratios, and ffburn and flburn are
the fractions of nitrogen lost when foliage and aboveground litter are burnt. Similarly, the amount of nitrogen lost from burning stemwood slash (Fw, kg N m−2) is:
Fw=cw(T)νw(1 −fh)fwburn, (6b)
where fwburn is the corresponding fraction of nitrogen lost. Like
H (Equation 5), Fw can be calculated from the results of DM.
In order to calculate Ffl, we make the following three
simplify-ing assumptions. First, as the predictions of the growth model show (DM), it is reasonable to assume that foliage carbon has reached its equilibrium value, cf*, corresponding to canopy
closure, before the end of the rotation, so that:
cf(T)=cf∗=
ηfG∗
γf
, (7a)
where ηf is the fraction of carbon production allocated to
foliage, and γf is the foliage senescence rate. Second, we make
a similar assumption for aboveground leaf litter:
cl(T)=cl∗= cf∗γf
γl
, (7b)
where cl* is the equilibrium value of litter carbon, and γl is the
leaf litter turnover rate. (In the present study, we ignore nitro-gen losses from burning woody litter and understorey vegeta-tion.) Third, we assume that the aboveground litter N/C ratio is proportional to the foliage N/C ratio, and that the foliage N/C ratio is also at its equilibrium value, νf*, at the end of the
rotation (as suggested by the results of DM), so that:
νl(T)=ψνf(T)=ψνf∗, (7c)
where ψ is a constant. Substituting Equations 7 into Equation 6a then gives:
Ffl=
ffburn
γf
+flburnψ
γl
ηfνf∗G∗, (8)
in which νf* and G* may be calculated for a given value of Uo
using the analytical results in DM (their Appendix B). Throughout the rotation, a constant fraction ξ of the nitrogen supply not taken up by trees is lost from the system through ‘‘leakage,’’ i.e.,leaching and gaseous emissions, the remaining
fraction being taken up by other vegetation. Therefore, the leakage rate (L, kg N m−2 year−1) is:
L=ξ(Uo−U)=ξUo Kr
cr+Kr
, (9)
where we have used Equation 1. The value of L is greatest during the early growth years when root biomass is low. In the notation of DM (their Appendix A), ξ is given by ln/(ln+σv),
where ln and σv are parameters describing the intrinsic leakage
rate and the intensity of competition for nitrogen from other vegetation, respectively. The value of ξ is generally small in the dry conditions that exist in many Australian forests.
Equation 3b gives the stemwood yield at harvest (of which a fraction fh is removed from site), and Equations 5--9 describe
the nitrogen losses from the system, during a single rotation for a given constant nitrogen supply rate (Uo). In the following
section we will consider the long-term consequences of these nitrogen losses for stemwood yield, due to changes in Uo over
successive rotations.
Sustainable yield Definition
We adopt a definition of sustainable yield (Ys) that is based
solely on the ecophysiological constraints on the long-term productivity of a given forest stand. Our definition does not address issues of conservation of biological and genetic diver-sity (e.g., Franklin et al. 1989), or wider socioeconomic as-pects of sustainability, such as energy costs associated with fertilizer inputs, harvest operations, transport and processing of wood products.
Figure 2 depicts the overall nitrogen balance of the system. External inputs of nitrogen from fertilizer additions, fixation and atmospheric deposition are assumed to occur at a constant rate (A), and the system is subjected to a repeated management cycle consisting of harvesting at maximum MAI, followed by regeneration burn and re-planting. Under these conditions, the supply of available nitrogen (Uo, Equation 2) will in general
vary from one rotation to the next, due to the effect of nitrogen removal by harvesting and fire on the input of litter to the soil (and, subsequently, on the mineralization rate M). As a result, the stemwood growth curve and the optimal rotation length in the nth rotation (cw(n)(t) and Tn, respectively), will also vary with rotation number (n = 1, 2, ...).
Our aim here is not to estimate these dependences on the rotation number (n) explicitly, but only to examine the situ-ation in the long-term limit as n→∞. In this limit, we suggest that the system asymptotically approaches a periodic steady state in which total nitrogen losses due to harvesting, fire and leakage equal total nitrogen inputs integrated over one rota-tion. Thus:
TA=H+Ffl+Fw+
∫
L 0T
dt (for n→∞). (10)
In the steady state, the values of M and Uo, and therefore the
stemwood growth curve [cw(t)] and the value of the optimal
rotation length (T), are repeated from one rotation to the next (barring wild fire events). The long-term sustainable yield (Ys, m3 ha−1 year−1) is defined as the resulting steady-state
value of maximum MAI. Thus, from Equation 3a:
Ys= lim
By inserting the expressions for H and Fw given by Equations
5 and 6b into the steady-state nitrogen balance condition (Equation 10) and re-arranging, we obtain an expression for cw(T)/T (valid for n → ∞) which may be substituted into
Equation 11, giving the sustainable yield as:
Ys=
In order to calculate Ys using Equation 12, we need to know
the steady-state values of the optimal rotation length (T), the amount of nitrogen lost when foliage and aboveground litter are burnt (Ffl), and the integral of the leakage rate (L) over a
rotation length. Each of these quantities may be expressed in terms of the steady-state nitrogen supply rate (Uo), using
Equa-tions 1, 4, 8 and 9 in combination with the analytical results of DM. In other words, Equation 12 may be expressed as a relationship between Ys and Uo, which holds in the steady state:
Ys(Uo)=
Here, Ω(Uo) is the rotation-averaged rate of nitrogen loss from
burning foliage and aboveground litter, and from leakage:
Ω(Uo)=
which depends positively on nitrogen supply (Uo). Appendix
A discusses the evaluation of Ω(Uo) in more detail. It remains
to find the steady-state value of Uo. This may be obtained by
simultaneously solving Equation 13a for Ys(Uo) (valid only in
the steady state) and Equation 3b for Y(Uo), describing the
growth response of stemwood yield to nitrogen supply in any given rotation. Therefore, the steady-state value of Uo is given
by the solution to:
Ys(Uo)=Y(Uo). (14)
We call Ys(Uo) ‘‘the steady-state N balance constraint on
yield.’’ This constraint is simply the steady state nitrogen
balance condition (Equation 10) re-expressed as a relationship between sustainable stemwood yield and nitrogen supply. We call Y(Uo) the ‘‘growth response constraint on yield.’’ This
constraint is satisfied in each rotation. Sustainable yield must satisfy both of these ecological constraints.
Graphical analysis
Equation 14 may be solved graphically by finding the intersec-tion point of the two curves defined by the steady-state N balance constraint and the growth response constraint. Fig-ure 3a illustrates the general form of the analysis.
The growth response constraint (Y(Uo), Equation 3b)
de-scribes a curve with positive slope; in any given rotation, the system must lie somewhere on this curve. In general, the steady-state N balance constraint (Ys(Uo), Equation 13a)
de-scribes a curve with negative slope. There is a negative rela-tionship between Ys and the steady-state value of Uo because,
when external inputs (A) are constant, there must be a trade-off between the mean rate of nitrogen loss from foliage and litter burning and from leakage [Ω(Uo), Equation 13b] on the one
hand, and stemwood harvesting and burning [(H + Fw)/T∝Ys]
on the other (Figure 2). An increase in Uo is associated with an
increase in Ω(Uo) and hence (in the steady state) a decrease
in Ys.
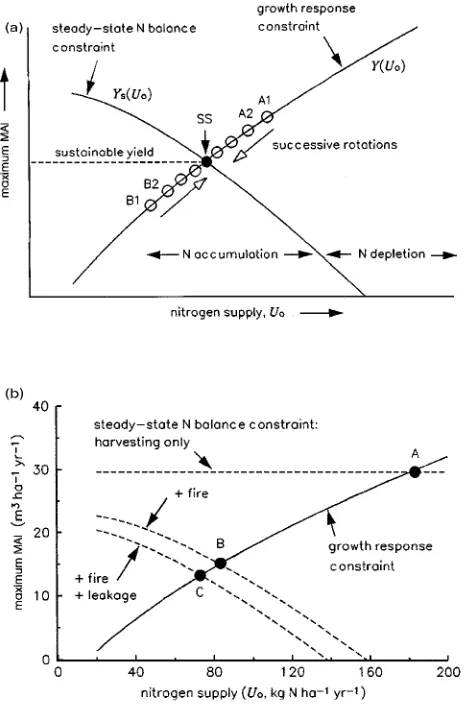
Above the steady-state N balance constraint curve (e.g., at the point marked A1 in Figure 3a), total nitrogen losses exceed inputs; if, as a result, the nitrogen supply (Uo) in the next
rotation is reduced, then the system will move down the growth response curve (e.g.,to point A2). Below the N balance con-straint curve, the opposite occurs (e.g.,giving the sequence B1, B2, ...). In either case, the system eventually approaches a steady state given by the point of intersection (point SS) of the two constraint curves; the sustainable yield is given by the height of SS above the horizontal axis.
Numerical examples for three rates of nitrogen removal We now examine the yield sustained by a given rate of nitrogen additions (A) for the following set of scenarios representing increasing amounts of nitrogen removal: (Case 1) harvesting only, (Case 2) harvesting + regeneration burn, and (Case 3) harvesting + regeneration burn + leakage. The graphical solu-tion to Equasolu-tion 14 for each case is shown in Figure 3b, where the parameter values in Table 2 have been used. These parame-ter values have been taken mostly from studies of Eucalyptus diversicolor F.J. Muell. and Eucalyptusmarginata J. Donn. growing in Western Australia. However, the values used have been chosen to illustrate the general behavior of the model, and the model outputs do not closely represent any particular species.
Case 1: harvesting only
independent of Uo, giving a horizontal line for the steady-state
N balance constraint curve (Figure 3b). This reflects that, in the absence of Uo-dependent nitrogen losses from fire and leakage,
Equation 10 implies that the steady-state, rotation-averaged rate of nitrogen loss from harvesting (i.e., H/T, which, from Equations 5 and 11, is proportional to Ys) must equal the
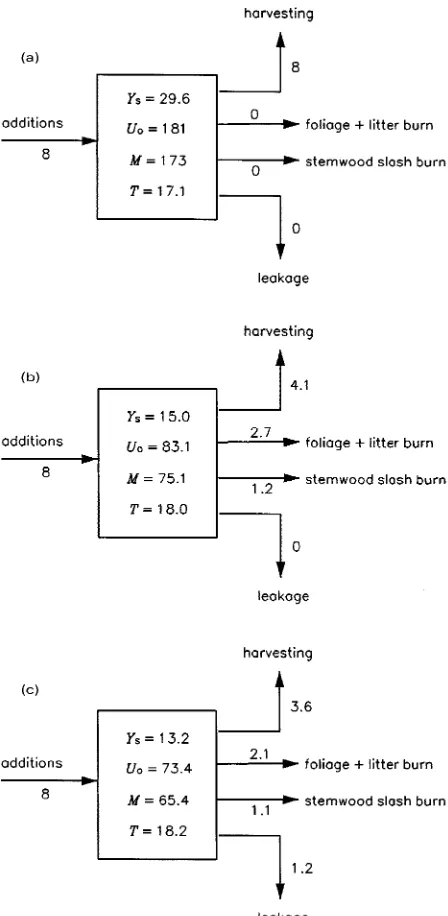
nitro-gen addition rate (A), as indicated in Figure 4a. With standard parameter values (Table 2), Equation 15 predicts a sustainable yield of Ys = 29.6 m3 ha−1 year−1; this corresponds to the point
marked A in Figure 3b, where Uo = 181 kg N ha−1 year−1 and
so (from Equation 2 and Table 2) the mineralization rate is M = 173 kg N ha−1 year−1.
Case 2: harvesting and regeneration burn
In this case, Ω(Uo) is given by:
Ω(Uo)=
Ffl(Uo) T(Uo)
, (16)
which describes an increasing function of Uo (mainly due to
increasing Ffl rather than decreasing T, according to the results
of DM). Therefore, the steady-state N balance constraint curve (Equation 13a) has a negative slope (Figure 3b), as discussed above.
At the intersection of the two constraint curves (point B, Figure 3b), Ys = 15.0 m3 ha−1 year−1. Therefore, compared to
Case 1 (harvesting only), the extra losses of nitrogen associ-ated with regeneration burning reduce the sustainable yield by a factor of 2. The steady-state nitrogen budget of the system is shown in Figure 4b. In this example, the rotation-averaged nitrogen loss rates from harvesting (4.1 kg N ha−1 year−1) and from regeneration burning (3.9 kg N ha−1 year−1) are
approxi-mately equal.
Table 3 shows the sensitivity of sustainable yield to changes in the values of individual model parameters, with Case 2 as the reference case. The effect of an increase in the rate of nitrogen addition (A) or litter turnover (γl) is to raise the height
of the N balance constraint curve, and thus the intersection point with the growth response constraint curve. Similarly, increasing the foliage senescence rate (γf) raises the height of
the N balance constraint curve (by reducing the amount of fuel available to burn), but also lowers the growth response con-straint curve (by reducing foliage biomass and carbon produc-tion at canopy closure, see DM); however, the net effect is an increase in sustainable yield. Increases in the other parameters
Figure 3. (a) General scheme of the graphical analysis of long-term sustainable yield. The growth response constraint describes the posi-tive relationship between maximum MAI (Y) and plant-available nitro-gen supply (Uo) in any given rotation (Equation 3b), where Uo (Equation 2) includes external inputs (assumed constant) and net min-eralization (which varies over successive rotations, but is assumed constant within each rotation). The steady-state N balance constraint is the relationship between the steady-state values of maximum MAI (Ys) and Uo, defined by the condition that N inputs to the system equal N losses summed over a rotation (Equation 13a); above this curve, N outputs exceed N inputs, so that N supply and maximum MAI will decrease over successive rotations (e.g.,sequence A1, A2, ...); below this curve, the opposite occurs (e.g., sequence B1, B2, ...). In either case, the system approaches the steady state (point SS) where both constraints are satisfied; the sustainable yield is given by the height of SS above the horizontal axis. (b) Numerical examples for three scenar-ios of N removal: harvesting only, harvesting + regeneration burn, and harvesting + regeneration burn + leaching and gaseous emissions; points A, B and C indicate the sustainable steady states, respectively. Parameter values are given in Table 2.
Table 2. Standard parameter values (for notation, see Table 1). These parameter values have been taken mostly from studies of Eucalyptus diversicolor and Eucalyptusmarginata growing in Western Australia. All other parameter values of the model are given by Dewar and McMurtrie (1996). Case 1 = harvesting only; Case 2 = harvesting and regeneration burn, no leakage.
Parameter Value Source
A 0.008 kg N m−2 year−1 O’Connell and Grove (1991)
fh 0.5 Hingston et al. (1979)
ffburn 0.5 (zero in Case 1) O’Connell and Grove (1991)
flburn 0.5 (zero in Case 1) O’Connell and Grove (1991)
fwburn 0.3 (zero in Case 1) Illustrative example
γl 0.333 year−1 O’Connell (1987, 1988)
ξ 0.05 (zero in Cases 1 and 2) Illustrative example
in Table 3 lower the height of the N balance curve; in addition, an increase in the stemwood N/C ratio (νw) lowers the height
of the growth response curve also (e.g.,see DM, their Table 4) by reducing the amount of nitrogen available for foliage
pro-duction. Table 3 indicates that, for Case 2 as the reference case, Ys is most sensitive to changes in A and νw, moderately
sensi-tive to the harvest fraction (fh), and least sensitive to changes
in the parameters defining nitrogen losses from burning litter (flburn , γl, ψ), live foliage (ffburn , γf) and woody slash (fwburn ).
Case 3: harvesting, regeneration burn and leakage
The inclusion of leaching and gaseous emission losses (which are positively related to nitrogen supply, see Equation 9) low-ers the steady-state N balance constraint curve (which also becomes slightly steeper). As a result, the sustainable yield is reduced to 13.2 m3 ha−1 year−1 (point C, Figure 3b). In this example, leakage accounts for 15% of the nitrogen loss in the steady state (Figure 4c).
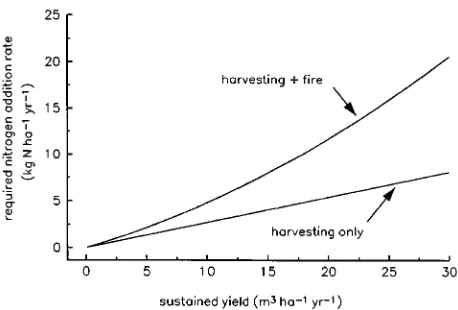
Nitrogen additions required to sustain a given yield The above analysis may be inverted to estimate the nitrogen addition rate (A) that is required to sustain a given maximum MAI in the long-term (Ys), including the case of maintaining
current yield. In the case of harvesting only (Case 1), from Equation 15 we obtain:
A(Ys)=
ρfcw
104 fhνwYs, (17)
which predicts a linear relationship between A and Ys
(Fig-ure 5). More generally, Equation 13a gives:
A(Ys)=
ρfcw
104 [fh+(1 −fh)fwburn]νwYs+Ω(Uo). (18)
To calculate Ω(Uo) for a given value of Ys, the required
nitrogen supply rate is just the value of Uo at which Y(Uo) = Ys,
which may be calculated numerically by inverting Equa-tion 3b. This value of Uo is then substituted into Equation 13b
to calculate Ω(Uo) (see Appendix A). Equation 18 is illustrated Figure 4. Ecosystem nitrogen budgets for the sustainable steady states
of Figure 3b corresponding to (a) point A (harvesting only), (b) point B (harvesting + regeneration burn), and (c) point C (harvesting + regeneration burn + leakage). Numbers next to the arrows are the steady-state, rotation-averaged fluxes of nitrogen (kg N ha−1 year−1) associated with external inputs (A = fertilizer + fixation + deposition), removal of harvested stemwood (= H/T), burning of foliage and aboveground litter (= Ffl /T) and stemwood slash (= Fw /T), and leakage [(1/T)
∫
L dt]. Also shown are the steady-state values of sustainable yield (Ys, m3 ha−1 year−1), available nitrogen supply (Uo, kg N ha−1 year−1), net mineralization (M, kg N ha−1 year−1), and optimal rotation length (T, year).Table 3. Predicted percentage change in sustainable yield (∆Ys, Equa-tions 13a, 14 and 3b) due to a 10% increase in individual model parameters from their values in reference Case 2 (harvesting and regeneration burn, no leakage), as given in Table 2 (with ξ = 0). The sensitivities to stemwood N/C ratio (νw) and foliage turnover rate (γf) are also shown; the reference values are νw = 0.002 kg N kg−1 C and γf = 0.333 year−1, as given by Dewar and McMurtrie (1996).
Parameter increased by 10% ∆Ys (%)
A +7.6
fh −2.7
ffburn −1.7
flburn −0.9
fwburn −1.2
γl +0.8
ψ −0.9
νw −4.9
in Figure 5 for Case 2 (harvesting + regeneration burn). In this case, in order to sustain a given yield, the required nitrogen addition rate is approximately double the value required when the only nitrogen loss is from removal of harvested biomass (Case 1).
Discussion
Few observational studies exist of the long-term effects of harvesting and fire on tree growth. What little has been re-ported includes positive, negative and null responses, possibly because measurements have been made on different time scales (e.g., Balneaves 1990, Raison et al. 1990). Short-term responses to fire are usually favorable to plant nutrition (which may be reflected in growth). Removal of woody litter and slash at harvest (e.g., through regeneration burn) may also be bene-ficial to plant nutrition in the short term; this is so because woody litter has a low N/C ratio and can immobilize large amounts of soil N (e.g., Pearson et al. 1987). Reported longer-term growth responses tend to be more negative (e.g., Bal-neaves 1990). However, Abbott and Loneragan (1986) found no detectable effect of regular prescribed burning on the growth of jarrah forest. O’Connell and Grove (1991) suggested that this may reflect the fact that many ecosystems are cur-rently buffered against disturbance by nutrient reserves in the soil.
In the long term, however, it seems inescapable that the cumulative effect of a negative net balance of nitrogen must be a reduction in the supply of plant-available nitrogen, and consequently a decrease in tree growth, until a steady state is reached in which nitrogen inputs balance outputs (e.g., Fig-ure 3a, sequence A1, A2, ..., SS). An analogous conclusion applies if nitrogen additions were to exceed current losses, resulting in an increase in tree growth toward the steady state (e.g.,Figure 3a, sequence B1, B2, ..., SS).
We have examined sustainable yield purely as a steady-state problem. As a result, we can say nothing about how long the
system takes to approach the steady state, or about the likely magnitude of changes in nitrogen supply and productivity from one rotation to the next (the sequences A1, A2, ... and B1, B2, ... in Figure 3a are purely schematic examples). To address these questions would require using a model that links plant and soil nutrient cycling in a dynamic fashion (e.g., King 1995). The advantage of the steady-state analysis, however, is that we do not need to know any details about the dynamics of nitrogen cycling in the soil and its response to harvesting and fire. Instead, the condition for steady-state N balance (Equa-tion 10), when combined with the growth response predicted by DM (Equation 3b), provides a sufficient constraint on the steady-state mineralization rate to determine the sustainable yield.
Our analysis suggests that, for Eucalyptus, the most impor-tant factor that limits long-term sustainable yield is likely to be fire (here, regeneration burning). In the examples illustrated in Figure 3b, harvesting alone results in a relatively large sustain-able yield (≈ 30 m3 ha−1 year−1), which is decreased by a factor of 2 when N removals from regeneration burning are included. Leaching and gaseous emissions (which represent relatively small fluxes in many Australian forests) play a minor role. In addition, the sensitivity analysis (Table 3) shows that reliable estimates of the nitrogen addition rate (A) and stemwood N/C ratio (νw) are required to quantify sustainable yield.
Figure 3 is analogous to Comins and McMurtrie’s (1993) graphical prediction of the equilibrium net primary productiv-ity of unmanaged forests (see their Figure 6). Their ‘‘N-cycling constraint’’ is equivalent to our steady-state N balance con-straint, both being based on the conservation of nitrogen at equilibrium (or rotation-averaged steady state, as here). Their ‘‘photosynthetic constraint’’ is analogous to our growth re-sponse constraint, although the former is based on the conser-vation of carbon at equilibrium, whereas the latter is based on the relationship between stemwood growth and nitrogen sup-ply that exists in any given rotation (not just in the steady state). In Comins and McMurtrie (1993), the constraint curves are related to leaf N/C ratio (νf) rather than to nitrogen supply.
As with any model, a number of assumptions underlie the predictions illustrated in Figures 3--5 (see Discussion in DM). One important assumption is that Uo (Equation 2) is constant
within a rotation, so that the mineralization rate (M) represents an effective rotation-averaged value. As a result, the predicted response of tree growth to nitrogen supply does not take into account within-rotation variations in M (associated with the dynamics of litter and soil decomposition), which may be important for nitrogen uptake by trees, especially around can-opy closure. The numerical predictions do not include the effects of mechanical disturbance and compaction of soil, prescribed fuel-reduction burning, or feedbacks between fire and the activity of nitrogen-fixing legumes (here, A is a con-stant). Also, we have assumed that standard silvicultural prac-tice applies whereby the stand is harvested at maximum MAI, and have not considered the implications of treating the rota-tion length as a free parameter.
Nevertheless, the graphical analysis presented here is suffi-ciently general to provide a useful framework for incorporating
some of these factors and examining their effects on sustain-able yield. This analysis may also be useful for extending the application of the present model to the effects of climate change and increases in atmospheric CO2 concentrations on
sustainable yield, or for interpreting the behavior of more complex models of sustainable forest growth (e.g., King 1995).
Acknowledgments
This work was supported by the NGAC Dedicated Greenhouse Re-search Grants Scheme and the Australian ReRe-search Council. We are grateful to Tony O’Connell and John Raison for providing references on their field studies of forest fire ecology.
References
Abbott, I. and O. Loneragan. 1986. Ecology of jarrah (Eucalyptus marginata) in the northern jarrah forest of Western Australia. CALM, Perth, WA, Bull. No. 1, 137 p.
Baker, T.G. 1983. Dry matter, nitrogen, and phosphorus content of litterfall and branch fall in Pinus radiata and Eucalyptus forests. N.Z. J. For. Sci. 13:205--221.
Balneaves, J.M. 1990. Maintaining site productivity in second rotation crops, Canterbury Plains, New Zealand. In Impact of Intensive Harvesting on Forest Site Productivity. Eds. W.J. Dyck and C.A. Mees. Proc. IEA/BE A3 Workshop, South Island, New Zealand, March 1989. IEA/BE T6/A6 Report No. 2., For. Res. Inst., Rotorua, N.Z., FRI Bull. No. 159, pp 73--83.
Comins, H.N. and R.E. McMurtrie. 1993. Long-term biotic response of nutrient-limited forest ecosystems to CO2-enrichment: equilib-rium behavior of integrated plant--soil models. Ecol. Appl. 3:666--681.
Dewar, R.C. and R.E. McMurtrie. 1996. Analytical model of stem-wood growth in relation to nitrogen supply. Tree Physiol. 16:161--171.
Franklin, J.F., D.A. Perry, T.D. Schowalter, M.E. Harmon, A. McKee and T.A. Spies. 1989. Importance of ecological diversity in main-taining long-term site productivity. In Maintaining the Long-Term Productivity of Pacific Northwest Forest Ecosystems. Eds. D.A. Perry, R. Meurisse, B. Thomas, R. Miller, J. Boyle, J. Means, C.R. Perry and R.F. Powers. Timber Press, Portland, Oregon, pp 82--97. Grove, T.S., A.M. O’Connell and G.M. Dimmock. 1986. Nutrient changes in surface soils after an intense fire in jarrah (Eucalyptus marginata Donn ex Sm.) forest. Aust. J. Ecol. 11:303--317. Hingston, F.J., A.G. Turton and G.M. Dimmock. 1979. Nutrient
distri-bution in karri (Eucalyptus diversicolor F. Muell.) ecosystems in southwest Western Australia. For. Ecol. Manage. 2:133--158. King, D.A. 1995. A forest process model for evaluating the potential
productivity of Eucalyptus plantations in Southeastern Australia. Ecol. Model. In press.
McMurtrie, R.E. 1985. Forest productivity in relation to carbon parti-tioning and nutrient cycling: a mathematical model. In Attributes of Trees as Crop Plants. Eds. M.G.R. Cannell and J.E. Jackson. Inst. Terrestrial Ecol., Huntingdon, UK, pp 194--207.
McMurtrie, R.E. 1991. Relationship of forest productivity to nutrient and carbon supply----a modeling analysis. Tree Physiol. 9:87--99. McMurtrie, R.E. and L. Wolf. 1983. Above- and below-ground growth
of forest stands: a carbon budget model. Ann. Bot. 52:437--448. Murty, D., R.E. McMurtrie and M.G. Ryan. 1996. Declining forest
productivity in ageing forest stands----a modeling analysis of alter-native hypotheses. Tree Physiol. 16:187--200.
O’Connell, A.M. 1987. Litter dynamics in karri (Eucalyptus diversi-color) forests of south-western Australia. J. Ecol. 75:781--796. O’Connell, A.M. 1988. Decomposition of leaf litter in karri (
Eucalyp-tus diversicolor) forest of varying age. For. Ecol. Manage. 24:113--125.
O’Connell, A.M. and T.S. Grove. 1991. Processes contributing to the nutritional resilience or vulnerability of jarrah and karri forests in Western Australia. In Productivity in Perspective. Ed. P.J. Ryan. Proc. 3rd Aust. For. Soil. Nutr. Conf. Forestry Commission of NSW, Sydney, pp 180--197.
O’Connell, A.M., T.S. Grove and D. Lamb. 1981. The influence of fire on the nutrition of Australian forests. Proc. Aust. For. Nutr. Work-shop on Productivity in Perpetuity, Canberra, ACT, August 1981. CSIRO Div. For. Res., Canberra, pp 277--289.
Pearson, J.A., D.H. Knight and T.J. Fahey. 1987. Biomass and nutrient accumulation during stand development in Wyoming lodgepole pine forests. Ecology 68:1966--1973.
Raison, R.J., P.K. Khanna and W.J.B. Crane. 1982. Effects of intensi-fied harvesting on rates of nitrogen and phosphorus removal from
Pinus radiata and Eucalyptus forests in Australia and New Zealand. N.Z. J. For. Sci. 12:394--403.
Raison, R.J., H. Keith and P.K. Khanna. 1990. Effects of fire on the nutrient-supplying capacity of forest soils. In Impact of Intensive Harvesting on Forest Site Productivity. Eds. W.J. Dyck and C.A. Mees. Proc. IEA/BE A3 Workshop, South Island, New Zealand, March 1989. IEA/BE T6/A6 Report No. 2, For. Res. Inst., Rotorua, N.Z., FRI Bulletin No. 159, pp 39--54.
Raison, R.J., A.M. O’Connell, P.K. Khanna and H. Keith. 1993. Effects of repeated fires on nitrogen and phosphorus budgets and cycling processes in forest ecosystems. In Fire in Mediterranean Ecosystems. Eds. L. Trabaud and R. Prodon. CEC, Brussels-Lux-embourg, pp 347--363.
Stewart, H.T.L., D.W. Flinn and P. Hopmans. 1985. On harvesting and site productivity in eucalypt forests. Search 16:206--210.
Turner, J. 1981. Nutrient supply in relation to immobilization in biomass and nutrient removal in harvesting. In Proc. Aust. For. Nutr. Workshop on Productivity in Perpetuity, Canberra, ACT, August 1981. CSIRO Div. For. Res., Canberra, pp 263--275.
Walker, J., R.J. Raison and P.K. Khanna. 1986. Fire. In Australian Soils, the Human Impact. Eds. J.S. Russell and R.F. Isbell. Univer-sity of Queensland Press, St. Lucia, pp 185--216.
Appendix A. Evaluation of ΩΩ(Uo)
The rate of nitrogen loss (Ω(Uo)) from burning foliage and
aboveground litter, and from leakage, averaged over one rota-tion, is given by Equation 13b:
Ω(Uo)=
is the amount of nitrogen lost in burning foliage and litter, L (kg N m−2 year−1) is the rate of nitrogen loss from leaching and gaseous emissions, and the integral is with respect to stand age (T) over one rotation length. Each of the quantities T, Ffl
and L can be evaluated analytically as functions of Uo using the
results of the stemwood growth model of DM.
of approach of carbon production towards equilibrium at can-opy closure, has been calculated by DM (their Appendix C, Equation C5). Second, Ffl(Uo) is given by Equation 8, where
νf* and G* (the foliage N/C ratio and carbon production at
canopy closure, respectively) have been calculated as func-tions of Uo by DM (their Appendix B, Equations B3 and B9,
respectively). Finally, from Equations 1 and 9, L(t,Uo) is given
by:
L(t,Uo)=
ξUoKr Kr+cr(t,U0)
, (A2)
where cr(t, Uo) is the amount of fine root carbon at stand age t
and nitrogen supply rate Uo, and is given from the model of
DM by:
cr(t,Uo)=
ηrG∗(Uo)
µr
1 −
λ(Uo) e−µrt−µr e−λ(Uo)t
λ(Uo)−µr
, (A3)
where ηr is the fraction of carbon production allocated to fine
roots, and µr is the combined specific rate of fine root
![Figure 1. Stemwood carbon [cN haw(t), solid line] and mean annual stem-wood volume increment [MAI(t), broken line] as a function of standage (t), as predicted by the analytical stemwood growth model ofDewar and McMurtrie (1996), for a nitrogen supply rate Uo = 100 kg−1 year−1 (with other parameter values as given in their paper).](https://thumb-ap.123doks.com/thumbv2/123dok/1012296.923069/3.612.69.296.530.681/stemwood-increment-standage-predicted-analytical-mcmurtrie-nitrogen-parameter.webp)