DIODE-LASER BASED PHOTO -ACOUSTIC SPECTROSCOPY IN
ATMOSPHERIC NO
2DETECTION
Mitrayana1, T. Pierera2, B.W.M. Moeskops2, S. Persijn2, H. Naus2, F.J.M. Harren2, M.A.J. Wasono1, Muslim1, and W. Rochmah3
1
Atomic and Nuclear Physics Lab. Physics Dept. Gadjah M ada University Indonesia email address: [email protected]
2Molecular and Laser Physics Dept. Radboud University of Nijmegen, the Netherlands 3
Medical Faculty of Gadjah Mada University Indonesia
ABSTRACT
We have developed a simple, low cost, and compac t NO2 detection system. It’s based on
photoacoustic spectroscopy (PAS) method uses a diode laser as a source of radiation. The PAS
system has a detection limit of 10 ppbv for NO2. With this set-up we were able to detect the NO2
concentration from urban air near our campus. We have also investigated the NO2 dissociation
effect on the PAS system via NO measurements using a direct absorption spectroscopy method
on quantum cascade laser (QCL) system.
Keywords:photoacoustic spectroscopy
Makalah diterima 2 September 200 7
1. INTRODUCTION
Nitrogen dioxide (NO2) belongs to the
family of nitrogen oxides (NOx). It occurs naturally in the atmosphere, but it is also produced anthropogenically by e.g. burning of gasoline, coal, oil and other fuels as well as in power plants and burning of natural material (U.S. Environmental Protection Agency, 1999). The ambient concentrations of nitrogen dioxide are influenced by meteorological conditions like wind speed, temperature and precipitation, and result in both environmental and health effects (World Health Organization, 2000). The gas plays an important role in the atmospheric reactions that generate ozone which is an important contributor to air pollution and smog formation. NO2 promotes the formation of acid
aerosols, which pollute water and harm vegetation, as well as buildings. It is also associated with visibility degradation (Matooane, 2000). In The Netherlands, the
largest contribution to the emission of NOx is made by traffic (65%). Nitrogen dioxide is toxic by inhalation. Long-term exposure to NO2 at
concentrations above 40–100 µg/m³ causes adverse health effects that includes irritation of the eyes, skin and the respiratory system. It also affects the immune system resulting in low resistance to infection and cause genetic damage (Matooane, 2000). The current world health organization (WHO) guideline values for NO2 for Europe are: a 1-hour level of 200
numerous reactions which affect atmospheric composition, environmental degradation, human health problems and it can be transported over long distances, knowing the concentration of NO2 in the atmosphere is
important.
Recently, efforts toward the development of simple and reliable devices have been increased with the aim to control air pollution and to detect toxic gases at low levels in the air, in the field of domestic and industrial applications. Laser based trace gas sensors have been used to monitor NOx emissions from individual vehicles (Shorter, et. al., 2005), as well as variations in air pollution over cities (Altuzar, et.al., 2003; Altuzar, et.al., 2005), thereby demonstrating that they can make contributions to manage air quality. In this paper, we present a simple, low cost, compact and standalone NO2 detection system based on
resonant photoacoustic spectroscopy (PAS). The performance of the diode laser driven system was explored and the sensor was applied to monitor the NO2 level in the atmosphere. In
addition, NO, as a product of NO2
dissociations, was monitored using a direct absorption spectroscopy methods on quantum cascade (QCL) laser based detector.
2. MATERIALS AND METHODS
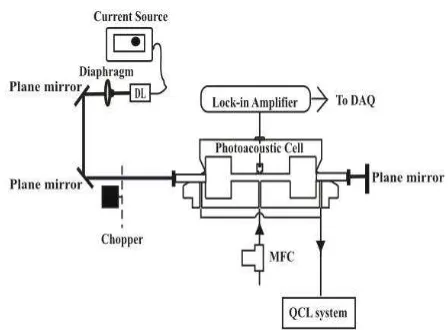
A sketch of the setup is shown in Figure 1. The cell is shown schematically; the real dimensions are given in the text.
The photoacoustic (PA) cell resonator is cylindrical with buffers attached at both ends and 3 microphones (Knowless EK3024, sensitivity of 22 mV/Pa and electrical noise 29 nV/√Hz) placed near its midpoint. The internal diameter of the resonator is 6 mm and its length is 300 mm. The buffer has a 40 mm diameter and a length 50 mm.. The cell had one inlet and two outlet ports. The gas inlet port was connected to the centre of the resonator via an acoustic notch filter of ¼ λ, in order to suppress the noise in line with the trace gas flow optimally at the resonance frequency of the PA cell.
Figure 1. – Photoacoustic spectroscopy (PAS) system experimental setup. The laser beam from the diode laser (DL) is passed twice through the photoacoustic (PA) cell by using a pl ane mirror behind it. The gas output from PA cell goes to the QCL system. DL: Diode laser, MFC: mass flow controller, DAQ: data acquisition card, QCL: quantum cascade laser
The detection system of a resonant PA experiment for trace-gas measuring is generally based on synchronous detection with lock-in amplifiers in order to obtain a good signal-to-noise ratio. To determine the resonance frequency of the photoacoustic cell, we varied the modulation frequency
f
m to scan the profile of the resonance peak and precisely determine its maximum. The amplitude of the frequency spectrum at the laser-beam chopping frequency fm was stored and the procedure was repeated for different repetition rates around the cell’s resonance with steps adequate for a good definition of the maximum, depending on the cavity Q-factor. The recorded amplitude and frequency values determined the PA peak, which shows a Lorentzian profile. For the following experiments the modulation frequency was set to the optimum value found from Figure 2, (565 ± 1) Hz.The first application test of the PA system is to measure the NO2 gas traces in
mW, FWHM < 1,5 nm and the beam width is around 1,5 mm. Urban air was continuously sampled at 1 m from the road side at a height of 3 m and flushed trough the PA cell via a 40 m long Teflon tubing (φ 2 mm)at 15 l/h.
The wavelength of the laser is 415 nm. At this wavelength NO2 is dissociated strongly
to NO (Coroiu, et. al. 2006). To show the dissociation effect we used a direct absorption spectroscopy methods on QCL (Quantum Cascade Laser) system for detection of NO that was generated by the PAS system. For this purpose we connected the gas outlet of the PA cell to multi-pass cell in the QCL system Moeskops, et. al., 2006. During the experiments the pressure inside the cell was kept 100 mbar by a pressure controller and a pump. After the absorption cell the laser beam was focused onto a fast, liquid-nitrogen cooled detector (KV-104, Kolmar Technologies).
3. RESULTS AND DISCUSSIONS
With this setup (Figure 1) we obtained values for the resonance frequency of the PA cell of 565 ± 1 Hz and a Q factor of 13,1 ± 0,2 (Figure 2). The laser power in the PA cell is 42 mW. Noise from the electronic equipments and
gas flow rate was around 29 nV/ Hz. The background signal of the system when filled with N2 was (180 ± 5) ppbV, so from the noise
and background data we get a detection limit of 10 ppbV.
Figure 2 - Resonance frequency of the PA cell
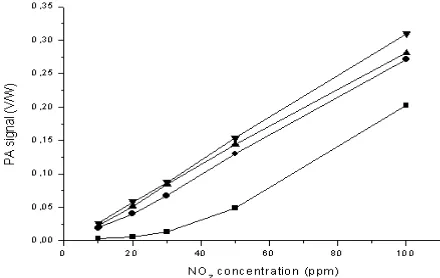
The characterization and calibration of the PA system is shown in Figures 3. From the figures we can infer that dissocia tion occurs in the PA cell since at the PA signal is reduced at low flow rates. To proof that this effect is due to dissociation we used the QCL system to measure the NO concentration in the gas outlet of the PA cell (Figure 5). From Figure 3 it is clear that by operating the system at a flow rate greater than 10 l/h, our measurement of the atmospheric NO2 concentration is linear and is
not distorted by dissociation effects.
Figure 3. – Values of PA signal vs. NO2
concentration in N2 at different flow rates at a
laser power of 42 mW.¦ 2 l/h; ? 10 l/h; ? 15 l/h; ? 20 l/h
Figure 4. – Values for PA signal vs. laser power at
different gas flow rates of the 100 ppm NO2
concentration in N2. ¦ 2 l/h; ? 10 l/h;
Figure 5. - NO vs. NO2 concentration measured
by the QCL and photoacoustic system,
respectively. ¦ NO2 in N2; ? NO2 in air. The gas
flow rate in the PA system is 15 l/h
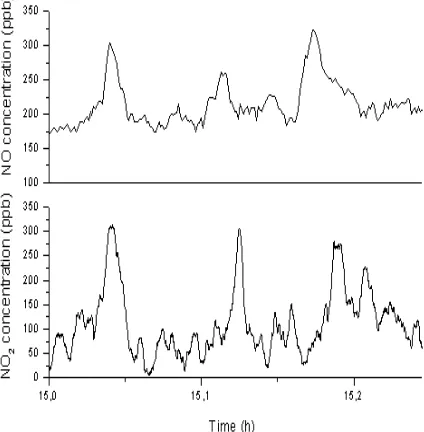
Figure 6. – Values for NO2 and NO concentration
from urban air around 3:00 PM June 15th, 2006
Figure 5 shows the dissociation effect that occurs in the PA cell. This is clear with the NO signal appear in the QCL system when the outlet NO2 gas from the PA cell is filled in the
multiple pass cell in the QCL system, with the following reaction NO2 + hv → NO + O(
3
P) (Atkinson, et.al., 2004). We can see that NO
signal is not linear to the NO2 (in the Nitrogen
and air) signal. Also we can see the NO signal from NO2 in N2 is higher than NO2 in air, that is
because same reaction from 2NO + O2 → 2NO2
(Atkinson, et.al., 2004).
Figure 6 shows the results from the parallel measurements between the PAS system and the QCL system from the out side air. Around 3:00 PM we obtained the synchronous signal that is NO2 signal from the PA system
and NO signal from the QCL system. To demonstrate that the PA system is suitable for long-term atmospheric measure-ments we sampled air from a nearby roadside for 2 days, as is shown in Figure 7. Also in the inset of the graphic we can see the high NO2 concentration
during the rush hour that means heavy traffic of cars, buses and trucks in the same time.
The average of NO2 concentration for 12 hours
(July 12th, 2006 at 5:42 PM to July 13rd, 2006 at
6:15 AM) in urban air/ traffic road inside the campus is (76 ± 19) ppbv, that are similar to the values that Slezak et al. (75 ppbv) got near their campus (Slezak, et.al., 2003).
4. CONCLUSIONS
We have developed the diode laser-based photoacoustic spectroscopy (PAS) system that is simple, low cost, and compact and standalone detection system. The system has a detection limit of 20 ppbv for the NO2. With
this system we were able to detect the NO2
concentration from urban air near our campus. We have also investigated the NO2 dissociation
effect of the system with NO measurements with a QCL system Moeskops, et. al., 2006. Furthermore, trace gas detection using the diode laser-base PAS system has proved to its capability in environmental monitoring and shows promise for other applications in life sciences and medical diagnostics as well.
Acknowledgment
REFERENCES
Altuzar, V., S. A. Tomas, O. Zelaya -angel, and F. Sanchez-Sinencio., 2003. Atmospheric pollution profiles inMexico City in two different seasons. Review of Scientific Instruments, 74:500–502.
Altuzar, V. , S. A. Tomas, O. Zelaya -angel, and F. Sanchez-Sinencio, J.L. Arriaga, 2005. Atmospheric ethene concentrations in Mexico City: Indications of strong diurnal and seasonal dependences.
Atmospheric Environment, 39:5219–
5225.
Atkinson, R., D.L. Baulch, R. A. Cox, J.N. Crowley, R.F. Hampson, R.G. Hynes, M.E. Jenkin, M.J. Rossi, and J. Troe, 2004. Evaluated kinetic and photochemic al data for atmospheric chemistry: Volume I – gas phase reactions of Ox, HOx, NOx and SOx species. Atmos. Chem. Phys., 4, 1461-1738.
Coroiu, A.M. D.H. Parker, G.C. Groenenboom, J. Barr, I.T. Novalbos, and B.J. Whitaker, 2006. Photolysis of NO2 at multiple
wavelengths in the spectral region 200-205 nm. Eur. Phys. J.D., 38, 151 – 162.
http://www.environment-agency.gov.uk/yourenv/eff/1190084/air/1 158715/1162725/?lang=_e, Enhanced Environmental Management, Report no. P5-1, Durban.
Matooane, M., 2000. Report on Human Health Risk Assessment of Exposure to Sulphur Dioxide and Nitrogen Dioxide in the Greater Cato Manor-Durban. University of Natal, Durban. Lead Programme in Technologies for The Environmental Agency, 2006. Environmental facts and figures.
Figure 7. Values for NO2 concentration from urban air July 12 th
Moeskops, B.W.M., S.M. Cristescu, and F.J.M. Harren, 2006. Sub-part-per-billion monitoring of nitric oxide by use of wavelength modulation spectroscopy in combination with a thermoelectrically cooled, continuous-wave quantum cascade-laser. Optics Letters Vol. 31, No. 6, March 15, 823-825.
Shorter, J. H., S. Herndon, M. S. Zahniser, D. D. Nelson, J. Wormhoudt, K. L. Demerjian, and C. E. Kolb. , 2005. Real-time measurements of nitrogen oxide emissions from in-use New York City transit buses using a chase vehicle.
Environmental Science & Technology, 39(20):7991–8000.
Slezak, V., G. Santiago, A. Peuriot, 2003. Photoacoustic detection of NO2 traces
with CW and pulsed green lasers. Optics and Lasers in Engineering, 40, 33-41. U.S. Environmental Protection Agency, 1999.
Air Pollution and Health Risk. Air Risk Information Support Centre.
http://www.epa.gov/ttn/uatw/3_90_022.ht m