Data Science
&
Discovering, Analyzing, Visualizing
and Presenting Data
Data Science
&
Big Data Analytics
John Wiley & Sons, Inc. 10475 Crosspoint Boulevard Indianapolis, IN 46256 www.wiley.com
Copyright © 2015 by John Wiley & Sons, Inc., Indianapolis, Indiana
Published simultaneously in Canada
ISBN: 978-1-118-87613-8 ISBN: 978-1-118-87622-0 (ebk) ISBN: 978-1-118-87605-3 (ebk)
Manufactured in the United States of America
10 9 8 7 6 5 4 3 2 1
No part of this publication may be reproduced, stored in a retrieval system or transmitted in any form or by any means, electronic, mechanical, photocopying, recording, scanning or otherwise, except as permitted under Sections 107 or 108 of the 1976 United States Copyright Act, without either the prior written permis-sion of the Publisher, or authorization through payment of the appropriate per-copy fee to the Copyright Clearance Center, 222 Rosewood Drive, Danvers, MA 01923, (978) 750-8400, fax (978) 646-8600. Requests to the Publisher for permission should be addressed to the Permissions Department, John Wiley & Sons, Inc., 111 River Street, Hoboken, NJ 07030, (201) 748-6011, fax (201) 748-6008, or online at http://www.wiley.com/go/permissions.
Limit of Liability/Disclaimer of Warranty: The publisher and the author make no representations or warranties with respect to the accuracy or completeness of the contents of this work and specifically disclaim all warranties, including without limitation warranties of fitness for a particular purpose. No warranty may be created or extended by sales or promotional materials. The advice and strategies contained herein may not be suitable for every situation. This work is sold with the understanding that the publisher is not engaged in rendering legal, accounting, or other professional services. If professional assistance is required, the services of a competent professional person should be sought. Neither the publisher nor the author shall be liable for damages arising herefrom. The fact that an organization or Web site is referred to in this work as a citation and/or a potential source of further information does not mean that the author or the publisher endorses the information the organization or website may provide or recommendations it may make. Further, readers should be aware that Internet websites listed in this work may have changed or disappeared between when this work was written and when it is read.
For general information on our other products and services please contact our Customer Care Department within the United States at (877) 762-2974, outside the United States at (317) 572-3993 or fax (317) 572-4002.
Wiley publishes in a variety of print and electronic formats and by print-on-demand. Some material included with standard print versions of this book may not be included in e-books or in print-on-demand. If this book refers to media such as a CD or DVD that is not included in the version you purchased, you may download this material at http://booksupport.wiley.com. For more information about Wiley products, visit www.wiley.com.
Library of Congress Control Number: 2014946681
Executive Editor Carol Long Project Editor Kelly Talbot
Production Manager Kathleen Wisor Copy Editor Karen Gill
Manager of Content Development and Assembly
Mary Beth Wakefield Marketing Director David Mayhew Marketing Manager Carrie Sherrill
Professional Technology and Strategy Director Barry Pruett
Business Manager Amy Knies
Associate Publisher Jim Minatel
Project Coordinator, Cover Patrick Redmond
Proofreader Nancy Carrasco Indexer
David Dietrich heads the data science education team within EMC Education Services, where he leads the curriculum, strategy and course development related to Big Data Analytics and Data Science. He co-au-thored the first course in EMC’s Data Science curriculum, two additional EMC courses focused on teaching leaders and executives about Big Data and data science, and is a contributing author and editor of this book. He has filed 14 patents in the areas of data science, data privacy, and cloud computing.
David has been an advisor to several universities looking to develop academic programs related to data analytics, and has been a frequent speaker at conferences and industry events. He also has been a a guest lecturer at universi-ties in the Boston area. His work has been featured in major publications including Forbes, Harvard Business Review, and the 2014 Massachusetts Big Data Report, commissioned by Governor Deval Patrick.
Involved with analytics and technology for nearly 20 years, David has worked with many Fortune 500 companies over his career, holding multiple roles involving analytics, including managing analytics and operations teams, delivering analytic con-sulting engagements, managing a line of analytical software products for regulating the US banking industry, and developing Software-as-a-Service and BI-as-a-Service offerings. Additionally, David collaborated with the U.S. Federal Reserve in develop-ing predictive models for monitordevelop-ing mortgage portfolios.
Barry Heller is an advisory technical education consultant at EMC Education Services. Barry is a course developer and cur-riculum advisor in the emerging technology areas of Big Data and data science. Prior to his current role, Barry was a
consul-tant research scientist leading numerous analytical initiatives within EMC’s Total Customer Experience organization. Early in his EMC career, he managed the statistical engineering group as well as led the data warehousing efforts in an Enterprise Resource Planning (ERP) implementation. Prior to joining EMC, Barry held managerial and analytical roles in reliability engineering functions at medical diagnostic and technology companies. During his career, he has applied his quantitative skill set to a myriad of business applications in the Customer Service, Engineering, Manufacturing, Sales/Marketing, Finance, and Legal arenas. Underscoring the importance of strong executive stakeholder engagement, many of his successes have resulted from not only focusing on the technical details of an analysis, but on the decisions that will be resulting from the analysis. Barry earned a B.S. in Computational Mathematics from the Rochester Institute of Technology and an M.A. in Mathematics from the State University of New York (SUNY) New Paltz.
Beibei Yang is a Technical Education Consultant of EMC Education Services, responsible for developing several open courses at EMC related to Data Science and Big Data Analytics. Beibei has seven years of experience in the IT industry. Prior to EMC she worked as a software engineer, systems manager, and network manager for a Fortune 500 company where she introduced
EMC Education Services embarked on learning this subject with the intent to develop an “open” curriculum and certification. It was a challenging journey at the time as not many understood what it would take to be a true data scientist. After initial research (and struggle), we were able to define what was needed and attract very talented professionals to work on the project. The course, “Data Science and Big Data Analytics,” has become well accepted across academia and the industry.
Led by EMC Education Services, this book is the result of efforts and contributions from a number of key EMC organizations and supported by the office of the CTO, IT, Global Services, and Engineering. Many sincere thanks to many key contributors and subject matter experts David Dietrich, Barry Heller, and Beibei Yang for their work developing content and graphics for the chapters. A special thanks to subject matter experts John Cardente and Ganesh Rajaratnam for their active involvement reviewing multiple book chapters and providing valuable feedback throughout the project.
We are also grateful to the following experts from EMC and Pivotal for their support in reviewing and improving the content in this book:
Aidan O’Brien Joe Kambourakis
Alexander Nunes Joe Milardo
Bryan Miletich John Sopka
Dan Baskette Kathryn Stiles
Daniel Mepham Ken Taylor
Dave Reiner Lanette Wells
Deborah Stokes Michael Hancock
Ellis Kriesberg Michael Vander Donk
Frank Coleman Narayanan Krishnakumar
Hisham Arafat Richard Moore
Ira Schild Ron Glick
Jack Harwood Stephen Maloney
We also thank Ira Schild and Shane Goodrich for coordinating this project, Mallesh Gurram for the cover design, Chris Conroy and Rob Bradley for graphics, and the publisher, John Wiley and Sons, for timely support in bringing this book to the industry.
Nancy Gessler
Director, Education Services, EMC Corporation
Alok Shrivastava
7.2.3 Smoothing . . . .217
$IBQUFS t "EWBODFE"OBMZUJDBM5IFPSZBOE.FUIPET5JNF4FSJFT"OBMZTJT
. . . 233
8.1 Overview of Time Series Analysis . . . 234
$IBQUFS t "EWBODFE"OBMZUJDT5FDIOPMPHZBOE5PPMT.BQ3FEVDFBOE)BEPPQ
. . . 295
10.3 NoSQL . . . 322
Summary . . . 323
Exercises . . . 324
Bibliography. . . 324
$IBQUFS t "EWBODFE"OBMZUJDT5FDIOPMPHZBOE5PPMT*O%BUBCBTF"OBMZUJDT
. . . 327
Technological advances and the associated changes in practical daily life have produced a rapidly expanding “parallel universe” of new content, new data, and new information sources all around us. Regardless of how one defines it, the phenomenon of Big Data is ever more present, ever more pervasive, and ever more important. There is enormous value potential in Big Data: innovative insights, improved understanding of problems, and countless opportunities to predict—and even to shape—the future. Data Science is the principal means to discover and tap that potential. Data Science provides ways to deal with and benefit from Big Data: to see patterns, to discover relationships, and to make sense of stunningly varied images and information.
Not everyone has studied statistical analysis at a deep level. People with advanced degrees in applied math-ematics are not a commodity. Relatively few organizations have committed resources to large collections of data gathered primarily for the purpose of exploratory analysis. And yet, while applying the practices of Data Science to Big Data is a valuable differentiating strategy at present, it will be a standard core competency in the not so distant future.
How does an organization operationalize quickly to take advantage of this trend? We’ve created this book for that exact purpose.
EMC Education Services has been listening to the industry and organizations, observing the multi-faceted transformation of the technology landscape, and doing direct research in order to create curriculum and con-tent to help individuals and organizations transform themselves. For the domain of Data Science and Big Data Analytics, our educational strategy balances three things: people—especially in the context of data science teams, processes—such as the analytic lifecycle approach presented in this book, and tools and technologies—in this case with the emphasis on proven analytic tools.
Big Data is creating significant new opportunities for organizations to derive new value and create competitive advantage from their most valuable asset: information. For businesses, Big Data helps drive efficiency, quality, and personalized products and services, producing improved levels of customer satisfaction and profit. For scientific efforts, Big Data analytics enable new avenues of investigation with potentially richer results and deeper insights than previously available. In many cases, Big Data analytics integrate structured and unstructured data with real-time feeds and queries, opening new paths to innovation and insight.
This book provides a practitioner’s approach to some of the key techniques and tools used in Big Data analytics. Knowledge of these methods will help people become active contributors to Big Data analytics projects. The book’s content is designed to assist multiple stakeholders: business and data analysts looking to add Big Data analytics skills to their portfolio; database professionals and managers of business intelligence, analytics, or Big Data groups looking to enrich their analytic skills; and college graduates investigating data science as a career field.
The content is structured in twelve chapters. The first chapter introduces the reader to the domain of Big Data, the drivers for advanced analytics, and the role of the data scientist. The second chapter presents an analytic project lifecycle designed for the particular characteristics and challenges of hypothesis-driven analysis with Big Data.
Chapter 3 examines fundamental statistical techniques in the context of the open source R analytic software environment. This chapter also highlights the importance of exploratory data analysis via visualizations and reviews the key notions of hypothesis development and testing.
Chapters 4 through 9 discuss a range of advanced analytical methods, including clustering, classification, regression analysis, time series and text analysis.
Chapter 12 provides guidance on operationalizing Big Data analytics projects. This chapter focuses on creat-ing the final deliverables, convertcreat-ing an analytics project to an ongocreat-ing asset of an organization’s operation, and creating clear, useful visual outputs based on the data.
EMC Academic Alliance
University and college faculties are invited to join the Academic Alliance program to access unique “open” curriculum-based education on the following topics:
●Data Science and Big Data Analytics ●Information Storage and Management ●Cloud Infrastructure and Services ●Backup Recovery Systems and Architecture
The program provides faculty with course resources to prepare students for opportunities that exist in today’s evolving IT industry at no cost. For more information, visit http://education.EMC.com/academicalliance.
EMC Proven Professional Certification
EMC Proven Professional is a leading education and certification program in the IT industry, providing compre-hensive coverage of information storage technologies, virtualization, cloud computing, data science/Big Data analytics, and more.
Being proven means investing in yourself and formally validating your expertise.
1
Introduction to Big Data
Analytics
Key Concepts
Much has been written about Big Data and the need for advanced analytics within industry, academia, and government. Availability of new data sources and the rise of more complex analytical opportunities have created a need to rethink existing data architectures to enable analytics that take advantage of Big Data. In addition, significant debate exists about what Big Data is and what kinds of skills are required to make best use of it. This chapter explains several key concepts to clarify what is meant by Big Data, why advanced analytics are needed, how Data Science differs from Business Intelligence (BI), and what new roles are needed for the new Big Data ecosystem.
1.1 Big Data Overview
Data is created constantly, and at an ever-increasing rate. Mobile phones, social media, imaging technologies to determine a medical diagnosis—all these and more create new data, and that must be stored somewhere for some purpose. Devices and sensors automatically generate diagnostic information that needs to be stored and processed in real time. Merely keeping up with this huge influx of data is difficult, but substan-tially more challenging is analyzing vast amounts of it, especially when it does not conform to traditional notions of data structure, to identify meaningful patterns and extract useful information. These challenges of the data deluge present the opportunity to transform business, government, science, and everyday life.
Several industries have led the way in developing their ability to gather and exploit data: ●Credit card companies monitor every purchase their customers make and can identify fraudulent
purchases with a high degree of accuracy using rules derived by processing billions of transactions. ●Mobile phone companies analyze subscribers’ calling patterns to determine, for example, whether a
caller’s frequent contacts are on a rival network. If that rival network is offering an attractive promo-tion that might cause the subscriber to defect, the mobile phone company can proactively offer the subscriber an incentive to remain in her contract.
●For companies such as LinkedIn and Facebook, data itself is their primary product. The valuations of these companies are heavily derived from the data they gather and host, which contains more and more intrinsic value as the data grows.
Three attributes stand out as defining Big Data characteristics:
●Huge volume of data: Rather than thousands or millions of rows, Big Data can be billions of rows and millions of columns.
●Complexity of data types and structures: Big Data reflects the variety of new data sources, formats, and structures, including digital traces being left on the web and other digital repositories for subse-quent analysis.
●Speed of new data creation and growth: Big Data can describe high velocity data, with rapid data ingestion and near real time analysis.
management of large datasets and the storage environments that house them. Another definition of Big Data comes from the McKinsey Global report from 2011:
Big Data is data whose scale, distribution, diversity, and/or timeliness require the use of new technical architectures and analytics to enable insights that unlock new sources of business value.
McKinsey & Co.; Big Data: The Next Frontier for Innovation, Competition, and Productivity [1]
McKinsey’s definition of Big Data implies that organizations will need new data architectures and ana-lytic sandboxes, new tools, new anaana-lytical methods, and an integration of multiple skills into the new role of the data scientist, which will be discussed in Section 1.3. Figure 1-1 highlights several sources of the Big Data deluge.
FIGURE 1-1 What’s driving the data deluge
The rate of data creation is accelerating, driven by many of the items in Figure 1-1.
Social media and genetic sequencing are among the fastest-growing sources of Big Data and examples of untraditional sources of data being used for analysis.
For example, in 2012 Facebook users posted 700 status updates per second worldwide, which can be leveraged to deduce latent interests or political views of users and show relevant ads. For instance, an update in which a woman changes her relationship status from “single” to “engaged” would trigger ads on bridal dresses, wedding planning, or name-changing services.
Another example comes from genomics. Genetic sequencing and human genome mapping provide a detailed understanding of genetic makeup and lineage. The health care industry is looking toward these advances to help predict which illnesses a person is likely to get in his lifetime and take steps to avoid these maladies or reduce their impact through the use of personalized medicine and treatment. Such tests also highlight typical responses to different medications and pharmaceutical drugs, heightening risk awareness of specific drug treatments.
While data has grown, the cost to perform this work has fallen dramatically. The cost to sequence one human genome has fallen from $100 million in 2001 to $10,000 in 2011, and the cost continues to drop. Now, websites such as 23andme (Figure 1-2) offer genotyping for less than $100. Although genotyping analyzes only a fraction of a genome and does not provide as much granularity as genetic sequencing, it does point to the fact that data and complex analysis is becoming more prevalent and less expensive to deploy.
As illustrated by the examples of social media and genetic sequencing, individuals and organizations both derive benefits from analysis of ever-larger and more complex datasets that require increasingly powerful analytical capabilities.
1.1.1 Data Structures
Big data can come in multiple forms, including structured and non-structured data such as financial data, text files, multimedia files, and genetic mappings. Contrary to much of the traditional data analysis performed by organizations, most of the Big Data is unstructured or semi-structured in nature, which requires different techniques and tools to process and analyze. [2] Distributed computing environments and massively parallel processing (MPP) architectures that enable parallelized data ingest and analysis are the preferred approach to process such complex data.
With this in mind, this section takes a closer look at data structures.
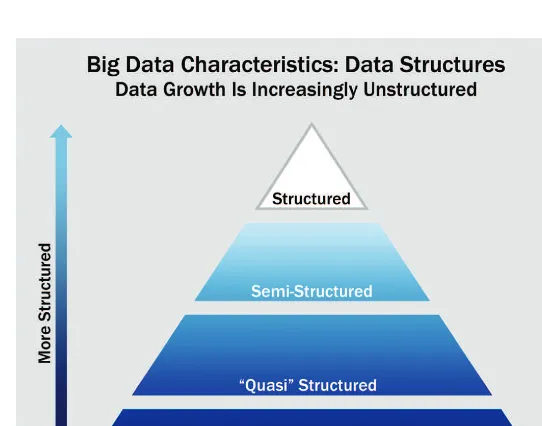
Figure 1-3 shows four types of data structures, with 80–90% of future data growth coming from non-structured data types. [2] Though different, the four are commonly mixed. For example, a classic Relational Database Management System (RDBMS) may store call logs for a software support call center. The RDBMS may store characteristics of the support calls as typical structured data, with attributes such as time stamps, machine type, problem type, and operating system. In addition, the system will likely have unstructured, quasi- or semi-structured data, such as free-form call log information taken from an e-mail ticket of the problem, customer chat history, or transcript of a phone call describing the technical problem and the solu-tion or audio file of the phone call conversasolu-tion. Many insights could be extracted from the unstructured, quasi- or semi-structured data in the call center data.
Although analyzing structured data tends to be the most familiar technique, a different technique is required to meet the challenges to analyze semi-structured data (shown as XML), quasi-structured (shown as a clickstream), and unstructured data.
Here are examples of how each of the four main types of data structures may look.
●Structured data: Data containing a defined data type, format, and structure (that is, transaction data, online analytical processing [OLAP] data cubes, traditional RDBMS, CSV files, and even simple spread-sheets). See Figure 1-4.
FIGURE 1-4 Example of structured data
●Semi-structured data: Textual data files with a discernible pattern that enables parsing (such as Extensible Markup Language [XML] data files that are self-describing and defined by an XML schema). See Figure 1-5.
●Quasi-structured data: Textual data with erratic data formats that can be formatted with effort, tools, and time (for instance, web clickstream data that may contain inconsistencies in data values and formats). See Figure 1-6.
Quasi-structured data is a common phenomenon that bears closer scrutiny. Consider the following example. A user attends the EMC World conference and subsequently runs a Google search online to find information related to EMC and Data Science. This would produce a URL such as https://www.google .com/#q=EMC+ data+science and a list of results, such as in the first graphic of Figure 1-5.
FIGURE 1-5 Example of semi-structured data
.aspx, that displays the page shown as (2) in Figure 1-6. Arriving at this site, the user may decide to click to learn more about the process of becoming certified in data science. The user chooses a link toward the top of the page on Certifications, bringing the user to a new URL: https://education.emc.com/
guest/certification/framework/stf/data_science.aspx, which is (3) in Figure 1-6.
Visiting these three websites adds three URLs to the log files monitoring the user’s computer or network use. These three URLs are:
https://www.google.com/#q=EMC+data+science
https://education.emc.com/guest/campaign/data_science.aspx
https://education.emc.com/guest/certification/framework/stf/data_ science.aspx
FIGURE 1-7 Example of unstructured data: video about Antarctica expedition [3]
This set of three URLs reflects the websites and actions taken to find Data Science information related to EMC. Together, this comprises a clickstream that can be parsed and mined by data scientists to discover usage patterns and uncover relationships among clicks and areas of interest on a website or group of sites.
The four data types described in this chapter are sometimes generalized into two groups: structured and unstructured data. Big Data describes new kinds of data with which most organizations may not be used to working. With this in mind, the next section discusses common technology architectures from the standpoint of someone wanting to analyze Big Data.
1.1.2 Analyst Perspective on Data Repositories
The introduction of spreadsheets enabled business users to create simple logic on data structured in rows and columns and create their own analyses of business problems. Database administrator training is not required to create spreadsheets: They can be set up to do many things quickly and independently of information technology (IT) groups. Spreadsheets are easy to share, and end users have control over the logic involved. However, their proliferation can result in “many versions of the truth.” In other words, it can be challenging to determine if a particular user has the most relevant version of a spreadsheet, with the most current data and logic in it. Moreover, if a laptop is lost or a file becomes corrupted, the data and logic within the spreadsheet could be lost. This is an ongoing challenge because spreadsheet programs such as Microsoft Excel still run on many computers worldwide. With the proliferation of data islands (or spreadmarts), the need to centralize the data is more pressing than ever.
could rely on getting an “official” source of data for financial reporting or other mission-critical tasks. This structure also enabled the creation of OLAP cubes and BI analytical tools, which provided quick access to a set of dimensions within an RDBMS. More advanced features enabled performance of in-depth analytical techniques such as regressions and neural networks. Enterprise Data Warehouses (EDWs) are critical for reporting and BI tasks and solve many of the problems that proliferating spreadsheets introduce, such as which of multiple versions of a spreadsheet is correct. EDWs—and a good BI strategy—provide direct data feeds from sources that are centrally managed, backed up, and secured.
Despite the benefits of EDWs and BI, these systems tend to restrict the flexibility needed to perform robust or exploratory data analysis. With the EDW model, data is managed and controlled by IT groups and database administrators (DBAs), and data analysts must depend on IT for access and changes to the data schemas. This imposes longer lead times for analysts to get data; most of the time is spent waiting for approvals rather than starting meaningful work. Additionally, many times the EDW rules restrict analysts from building datasets. Consequently, it is common for additional systems to emerge containing critical data for constructing analytic datasets, managed locally by power users. IT groups generally dislike exis-tence of data sources outside of their control because, unlike an EDW, these datasets are not managed, secured, or backed up. From an analyst perspective, EDW and BI solve problems related to data accuracy and availability. However, EDW and BI introduce new problems related to flexibility and agility, which were less pronounced when dealing with spreadsheets.
A solution to this problem is the analytic sandbox, which attempts to resolve the conflict for analysts and data scientists with EDW and more formally managed corporate data. In this model, the IT group may still manage the analytic sandboxes, but they will be purposefully designed to enable robust analytics, while being centrally managed and secured. These sandboxes, often referred to as workspaces, are designed to enable teams to explore many datasets in a controlled fashion and are not typically used for enterprise-level financial reporting and sales dashboards.
Many times, analytic sandboxes enable high-performance computing using in-database processing— the analytics occur within the database itself. The idea is that performance of the analysis will be better if the analytics are run in the database itself, rather than bringing the data to an analytical tool that resides somewhere else. In-database analytics, discussed further in Chapter 11, “Advanced Analytics—Technology and Tools: In-Database Analytics,” creates relationships to multiple data sources within an organization and saves time spent creating these data feeds on an individual basis. In-database processing for deep analytics enables faster turnaround time for developing and executing new analytic models, while reducing, though not eliminating, the cost associated with data stored in local, “shadow” file systems. In addition, rather than the typical structured data in the EDW, analytic sandboxes can house a greater variety of data, such as raw data, textual data, and other kinds of unstructured data, without interfering with critical production databases. Table 1-1 summarizes the characteristics of the data repositories mentioned in this section.
TABLE 1-1 Types of Data Repositories, from an Analyst Perspective
Data Warehouses Centralized data containers in a purpose-built space Supports BI and reporting, but restricts robust analyses
Analyst dependent on IT and DBAs for data access and schema changes Analysts must spend significant time to get aggregated and disaggre-gated data extracts from multiple sources.
Analytic Sandbox (workspaces)
Data assets gathered from multiple sources and technologies for analysis Enables flexible, high-performance analysis in a nonproduction environ-ment; can leverage in-database processing
Reduces costs and risks associated with data replication into “shadow” file systems
“Analyst owned” rather than “DBA owned”
There are several things to consider with Big Data Analytics projects to ensure the approach fits with the desired goals. Due to the characteristics of Big Data, these projects lend themselves to decision sup-port for high-value, strategic decision making with high processing complexity. The analytic techniques used in this context need to be iterative and flexible, due to the high volume of data and its complexity. Performing rapid and complex analysis requires high throughput network connections and a consideration for the acceptable amount of latency. For instance, developing a real-time product recommender for a website imposes greater system demands than developing a near-real-time recommender, which may still provide acceptable performance, have slightly greater latency, and may be cheaper to deploy. These considerations require a different approach to thinking about analytics challenges, which will be explored further in the next section.
1.2 State of the Practice in Analytics
Current business problems provide many opportunities for organizations to become more analytical and data driven, as shown in Table 1-2.
TABLE 1-2 Business Drivers for Advanced Analytics
Business Driver Examples
Optimize business operations Sales, pricing, profitability, efficiency
Identify business risk Customer churn, fraud, default
Predict new business opportunities Upsell, cross-sell, best new customer prospects
Comply with laws or regulatory requirements
Table 1-2 outlines four categories of common business problems that organizations contend with where they have an opportunity to leverage advanced analytics to create competitive advantage. Rather than only performing standard reporting on these areas, organizations can apply advanced analytical techniques to optimize processes and derive more value from these common tasks. The first three examples do not represent new problems. Organizations have been trying to reduce customer churn, increase sales, and cross-sell customers for many years. What is new is the opportunity to fuse advanced analytical techniques with Big Data to produce more impactful analyses for these traditional problems. The last example por-trays emerging regulatory requirements. Many compliance and regulatory laws have been in existence for decades, but additional requirements are added every year, which represent additional complexity and data requirements for organizations. Laws related to anti-money laundering (AML) and fraud prevention require advanced analytical techniques to comply with and manage properly.
1.2.1 BI Versus Data Science
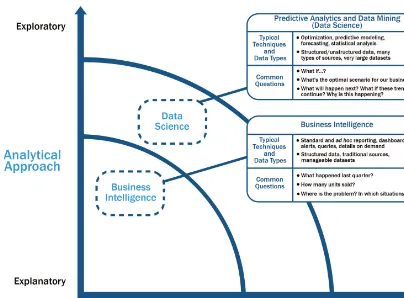
The four business drivers shown in Table 1-2 require a variety of analytical techniques to address them prop-erly. Although much is written generally about analytics, it is important to distinguish between BI and Data Science. As shown in Figure 1-8, there are several ways to compare these groups of analytical techniques.
One way to evaluate the type of analysis being performed is to examine the time horizon and the kind of analytical approaches being used. BI tends to provide reports, dashboards, and queries on business questions for the current period or in the past. BI systems make it easy to answer questions related to quarter-to-date revenue, progress toward quarterly targets, and understand how much of a given product was sold in a prior quarter or year. These questions tend to be closed-ended and explain current or past behavior, typically by aggregating historical data and grouping it in some way. BI provides hindsight and some insight and generally answers questions related to “when” and “where” events occurred.
By comparison, Data Science tends to use disaggregated data in a more forward-looking, exploratory way, focusing on analyzing the present and enabling informed decisions about the future. Rather than aggregating historical data to look at how many of a given product sold in the previous quarter, a team may employ Data Science techniques such as time series analysis, further discussed in Chapter 8, “Advanced Analytical Theory and Methods: Time Series Analysis,” to forecast future product sales and revenue more accurately than extending a simple trend line. In addition, Data Science tends to be more exploratory in nature and may use scenario optimization to deal with more open-ended questions. This approach provides insight into current activity and foresight into future events, while generally focusing on questions related to “how” and “why” events occur.
FIGURE 1-8 Comparing BI with Data Science
1.2.2 Current Analytical Architecture
As described earlier, Data Science projects need workspaces that are purpose-built for experimenting with data, with flexible and agile data architectures. Most organizations still have data warehouses that provide excellent support for traditional reporting and simple data analysis activities but unfortunately have a more difficult time supporting more robust analyses. This section examines a typical analytical data architecture that may exist within an organization.
FIGURE 1-9 Typical analytic architecture
1. For data sources to be loaded into the data warehouse, data needs to be well understood, structured, and normalized with the appropriate data type definitions. Although this kind of centralization enables security, backup, and failover of highly critical data, it also means that data typically must go through significant preprocessing and checkpoints before it can enter this sort of controlled environment, which does not lend itself to data exploration and iterative analytics. 2. As a result of this level of control on the EDW, additional local systems may emerge in the form of
departmental warehouses and local data marts that business users create to accommodate their need for flexible analysis. These local data marts may not have the same constraints for secu-rity and structure as the main EDW and allow users to do some level of more in-depth analysis. However, these one-off systems reside in isolation, often are not synchronized or integrated with other data stores, and may not be backed up.
3. Once in the data warehouse, data is read by additional applications across the enterprise for BI and reporting purposes. These are high-priority operational processes getting critical data feeds from the data warehouses and repositories.
4. At the end of this workflow, analysts get data provisioned for their downstream analytics. Because users generally are not allowed to run custom or intensive analytics on production databases, analysts create data extracts from the EDW to analyze data offline in R or other local analytical tools. Many times these tools are limited to in-memory analytics on desktops analyz-ing samples of data, rather than the entire population of a dataset. Because these analyses are based on data extracts, they reside in a separate location, and the results of the analysis—and any insights on the quality of the data or anomalies—rarely are fed back into the main data repository.
Departmental data warehouses may have been originally designed for a specific purpose and set of business needs, but over time evolved to house more and more data, some of which may be forced into existing schemas to enable BI and the creation of OLAP cubes for analysis and reporting. Although the EDW achieves the objective of reporting and sometimes the creation of dashboards, EDWs generally limit the ability of analysts to iterate on the data in a separate nonproduction environment where they can conduct in-depth analytics or perform analysis on unstructured data.
The typical data architectures just described are designed for storing and processing mission-critical data, supporting enterprise applications, and enabling corporate reporting activities. Although reports and dashboards are still important for organizations, most traditional data architectures inhibit data exploration and more sophisticated analysis. Moreover, traditional data architectures have several additional implica-tions for data scientists.
●High-value data is hard to reach and leverage, and predictive analytics and data mining activities are last in line for data. Because the EDWs are designed for central data management and reporting, those wanting data for analysis are generally prioritized after operational processes.
●Data moves in batches from EDW to local analytical tools. This workflow means that data scientists are limited to performing in-memory analytics (such as with R, SAS, SPSS, or Excel), which will restrict the size of the datasets they can use. As such, analysis may be subject to constraints of sampling, which can skew model accuracy.
●Data Science projects will remain isolated and ad hoc, rather than centrally managed. The implica-tion of this isolaimplica-tion is that the organizaimplica-tion can never harness the power of advanced analytics in a scalable way, and Data Science projects will exist as nonstandard initiatives, which are frequently not aligned with corporate business goals or strategy.
All these symptoms of the traditional data architecture result in a slow “time-to-insight” and lower business impact than could be achieved if the data were more readily accessible and supported by an envi-ronment that promoted advanced analytics. As stated earlier, one solution to this problem is to introduce analytic sandboxes to enable data scientists to perform advanced analytics in a controlled and sanctioned way. Meanwhile, the current Data Warehousing solutions continue offering reporting and BI services to support management and mission-critical operations.
1.2.3 Drivers of Big Data
To better understand the market drivers related to Big Data, it is helpful to first understand some past history of data stores and the kinds of repositories and tools to manage these data stores.
●Medical information, such as genomic sequencing and diagnostic imaging ●Photos and video footage uploaded to the World Wide Web
●Video surveillance, such as the thousands of video cameras spread across a city
●Mobile devices, which provide geospatial location data of the users, as well as metadata about text messages, phone calls, and application usage on smart phones
●Smart devices, which provide sensor-based collection of information from smart electric grids, smart buildings, and many other public and industry infrastructures
●Nontraditional IT devices, including the use of radio-frequency identification (RFID) readers, GPS navigation systems, and seismic processing
FIGURE 1-10 Data evolution and the rise of Big Data sources
The Big Data trend is generating an enormous amount of information from many new sources. This data deluge requires advanced analytics and new market players to take advantage of these opportunities and new market dynamics, which will be discussed in the following section.
1.2.4 Emerging Big Data Ecosystem and a New Approach to Analytics
evolve, the market sees the introduction of data vendors and data cleaners that use crowdsourcing (such as Mechanical Turk and GalaxyZoo) to test the outcomes of machine learning techniques. Other vendors offer added value by repackaging open source tools in a simpler way and bringing the tools to market. Vendors such as Cloudera, Hortonworks, and Pivotal have provided this value-add for the open source framework Hadoop.
As the new ecosystem takes shape, there are four main groups of players within this interconnected web. These are shown in Figure 1-11.
●Data devices [shown in the (1) section of Figure 1-11] and the “Sensornet” gather data from multiple locations and continuously generate new data about this data. For each gigabyte of new data cre-ated, an additional petabyte of data is created about that data. [2]
●For example, consider someone playing an online video game through a PC, game console, or smartphone. In this case, the video game provider captures data about the skill and levels attained by the player. Intelligent systems monitor and log how and when the user plays the game. As a consequence, the game provider can fine-tune the difficulty of the game, suggest other related games that would most likely interest the user, and offer additional equipment and enhancements for the character based on the user’s age, gender, and interests. This information may get stored locally or uploaded to the game provider’s cloud to analyze the gaming habits and opportunities for upsell and cross-sell, and identify archetypical profiles of specific kinds of users.
●Smartphones provide another rich source of data. In addition to messaging and basic phone usage, they store and transmit data about Internet usage, SMS usage, and real-time location. This metadata can be used for analyzing traffic patterns by scanning the density of smart-phones in locations to track the speed of cars or the relative traffic congestion on busy roads. In this way, GPS devices in cars can give drivers real-time updates and offer alternative routes to avoid traffic delays.
●Retail shopping loyalty cards record not just the amount an individual spends, but the loca-tions of stores that person visits, the kinds of products purchased, the stores where goods are purchased most often, and the combinations of products purchased together. Collecting this data provides insights into shopping and travel habits and the likelihood of successful advertisement targeting for certain types of retail promotions.
●Data collectors [the blue ovals, identified as (2) within Figure 1-11] include sample entities that collect data from the device and users.
●Data results from a cable TV provider tracking the shows a person watches, which TV channels someone will and will not pay for to watch on demand, and the prices someone is willing to pay for premium TV content
●Retail stores tracking the path a customer takes through their store while pushing a shop-ping cart with an RFID chip so they can gauge which products get the most foot traffic using geospatial data collected from the RFID chips
and websites. In turn, they can choose to transform and package the data as products to sell to list brokers, who may want to generate marketing lists of people who may be good targets for specific ad campaigns.
●Data users and buyers are denoted by (4) in Figure 1-11. These groups directly benefit from the data collected and aggregated by others within the data value chain.
●Retail banks, acting as a data buyer, may want to know which customers have the highest likelihood to apply for a second mortgage or a home equity line of credit. To provide input for this analysis, retail banks may purchase data from a data aggregator. This kind of data may include demographic information about people living in specific locations; people who appear to have a specific level of debt, yet still have solid credit scores (or other characteris-tics such as paying bills on time and having savings accounts) that can be used to infer credit worthiness; and those who are searching the web for information about paying off debts or doing home remodeling projects. Obtaining data from these various sources and aggrega-tors will enable a more targeted marketing campaign, which would have been more chal-lenging before Big Data due to the lack of information or high-performing technologies. ●Using technologies such as Hadoop to perform natural language processing on
unstructured, textual data from social media websites, users can gauge the reaction to events such as presidential campaigns. People may, for example, want to determine public sentiments toward a candidate by analyzing related blogs and online comments. Similarly, data users may want to track and prepare for natural disasters by identifying which areas a hurricane affects first and how it moves, based on which geographic areas are tweeting about it or discussing it via social media.
As illustrated by this emerging Big Data ecosystem, the kinds of data and the related market dynamics vary greatly. These datasets can include sensor data, text, structured datasets, and social media. With this in mind, it is worth recalling that these datasets will not work well within traditional EDWs, which were architected to streamline reporting and dashboards and be centrally managed. Instead, Big Data problems and projects require different approaches to succeed.
Analysts need to partner with IT and DBAs to get the data they need within an analytic sandbox. A typical analytical sandbox contains raw data, aggregated data, and data with multiple kinds of structure. The sandbox enables robust exploration of data and requires a savvy user to leverage and take advantage of data in the sandbox environment.
1.3 Key Roles for the New Big Data Ecosystem
As explained in the context of the Big Data ecosystem in Section 1.2.4, new players have emerged to curate, store, produce, clean, and transact data. In addition, the need for applying more advanced analytical tech-niques to increasingly complex business problems has driven the emergence of new roles, new technology platforms, and new analytical methods. This section explores the new roles that address these needs, and subsequent chapters explore some of the analytical methods and technology platforms.The Big Data ecosystem demands three categories of roles, as shown in Figure 1-12. These roles were described in the McKinsey Global study on Big Data, from May 2011 [1].
FIGURE 1-12 Key roles of the new Big Data ecosystem
massive scales. This group has advanced training in quantitative disciplines, such as mathematics, statistics, and machine learning. To do their jobs, members need access to a robust analytic sandbox or workspace where they can perform large-scale analytical data experiments. Examples of current professions fitting into this group include statisticians, economists, mathematicians, and the new role of the Data Scientist.
The McKinsey study forecasts that by the year 2018, the United States will have a talent gap of 140,000– 190,000 people with deep analytical talent. This does not represent the number of people needed with deep analytical talent; rather, this range represents the difference between what will be available in the workforce compared with what will be needed. In addition, these estimates only reflect forecasted talent shortages in the United States; the number would be much larger on a global basis.
The second group—Data Savvy Professionals—has less technical depth but has a basic knowledge of statistics or machine learning and can define key questions that can be answered using advanced analytics. These people tend to have a base knowledge of working with data, or an appreciation for some of the work being performed by data scientists and others with deep analytical talent. Examples of data savvy profes-sionals include financial analysts, market research analysts, life scientists, operations managers, and business and functional managers.
The McKinsey study forecasts the projected U.S. talent gap for this group to be 1.5 million people by the year 2018. At a high level, this means for every Data Scientist profile needed, the gap will be ten times as large for Data Savvy Professionals. Moving toward becoming a data savvy professional is a critical step in broadening the perspective of managers, directors, and leaders, as this provides an idea of the kinds of questions that can be solved with data.
The third category of people mentioned in the study is Technology and Data Enablers. This group represents people providing technical expertise to support analytical projects, such as provisioning and administrating analytical sandboxes, and managing large-scale data architectures that enable widespread analytics within companies and other organizations. This role requires skills related to computer engineering, programming, and database administration.
These three groups must work together closely to solve complex Big Data challenges. Most organizations are familiar with people in the latter two groups mentioned, but the first group, Deep Analytical Talent, tends to be the newest role for most and the least understood. For simplicity, this discussion focuses on the emerging role of the Data Scientist. It describes the kinds of activities that role performs and provides a more detailed view of the skills needed to fulfill that role.
There are three recurring sets of activities that data scientists perform:
●Reframe business challenges as analytics challenges. Specifically, this is a skill to diagnose busi-ness problems, consider the core of a given problem, and determine which kinds of candidate analyt-ical methods can be applied to solve it. This concept is explored further in Chapter 2, “Data Analytics Lifecycle.”
namely, applying complex or advanced analytical methods to a variety of business problems using data. Chapter 3 through Chapter 11 of this book introduces the reader to many of the most popular analytical techniques and tools in this area.
●Develop insights that lead to actionable recommendations. It is critical to note that applying advanced methods to data problems does not necessarily drive new business value. Instead, it is important to learn how to draw insights out of the data and communicate them effectively. Chapter 12, “The Endgame, or Putting It All Together,” has a brief overview of techniques for doing this.
Data scientists are generally thought of as having five main sets of skills and behavioral characteristics, as shown in Figure 1-13:
●Quantitative skill: such as mathematics or statistics
●Technical aptitude: namely, software engineering, machine learning, and programming skills ●Skeptical mind-set and critical thinking: It is important that data scientists can examine their work
critically rather than in a one-sided way.
●Curious and creative: Data scientists are passionate about data and finding creative ways to solve problems and portray information.
●Communicative and collaborative: Data scientists must be able to articulate the business value in a clear way and collaboratively work with other groups, including project sponsors and key stakeholders.
Data scientists are generally comfortable using this blend of skills to acquire, manage, analyze, and visualize data and tell compelling stories about it. The next section includes examples of what Data Science teams have created to drive new value or innovation with Big Data.
1.4 Examples of Big Data Analytics
After describing the emerging Big Data ecosystem and new roles needed to support its growth, this section provides three examples of Big Data Analytics in different areas: retail, IT infrastructure, and social media.
As mentioned earlier, Big Data presents many opportunities to improve sales and marketing analytics. An example of this is the U.S. retailer Target. Charles Duhigg’s book The Power of Habit [4] discusses how Target used Big Data and advanced analytical methods to drive new revenue. After analyzing consumer-purchasing behavior, Target’s statisticians determined that the retailer made a great deal of money from three main life-event situations.
●Marriage, when people tend to buy many new products
●Divorce, when people buy new products and change their spending habits
●Pregnancy, when people have many new things to buy and have an urgency to buy them
Target determined that the most lucrative of these life-events is the third situation: pregnancy. Using data collected from shoppers, Target was able to identify this fact and predict which of its shoppers were pregnant. In one case, Target knew a female shopper was pregnant even before her family knew [5]. This kind of knowledge allowed Target to offer specific coupons and incentives to their pregnant shoppers. In fact, Target could not only determine if a shopper was pregnant, but in which month of pregnancy a shop-per may be. This enabled Target to manage its inventory, knowing that there would be demand for specific products and it would likely vary by month over the coming nine- to ten-month cycles.
Hadoop [6] represents another example of Big Data innovation on the IT infrastructure. Apache Hadoop is an open source framework that allows companies to process vast amounts of information in a highly paral-lelized way. Hadoop represents a specific implementation of the MapReduce paradigm and was designed by Doug Cutting and Mike Cafarella in 2005 to use data with varying structures. It is an ideal technical framework for many Big Data projects, which rely on large or unwieldy datasets with unconventional data structures. One of the main benefits of Hadoop is that it employs a distributed file system, meaning it can use a distributed cluster of servers and commodity hardware to process large amounts of data. Some of the most common examples of Hadoop implementations are in the social media space, where Hadoop can manage transactions, give textual updates, and develop social graphs among millions of users. Twitter and Facebook generate massive amounts of unstructured data and use Hadoop and its ecosystem of tools to manage this high volume. Hadoop and its ecosystem are covered in Chapter 10, “Advanced Analytics— Technology and Tools: MapReduce and Hadoop.”
As of 2014, LinkedIn has more than 250 million user accounts and has added many additional features and data-related products, such as recruiting, job seeker tools, advertising, and InMaps, which show a social graph of a user’s professional network. Figure 1-14 is an example of an InMap visualization that enables a LinkedIn user to get a broader view of the interconnectedness of his contacts and understand how he knows most of them.
FIGURE 1-14 Data visualization of a user’s social network using InMaps
Summary
Big Data comes from myriad sources, including social media, sensors, the Internet of Things, video surveil-lance, and many sources of data that may not have been considered data even a few years ago. As businesses struggle to keep up with changing market requirements, some companies are finding creative ways to apply Big Data to their growing business needs and increasingly complex problems. As organizations evolve their processes and see the opportunities that Big Data can provide, they try to move beyond traditional BI activities, such as using data to populate reports and dashboards, and move toward Data Science- driven projects that attempt to answer more open-ended and complex questions.
However, exploiting the opportunities that Big Data presents requires new data architectures, includ-ing analytic sandboxes, new ways of workinclud-ing, and people with new skill sets. These drivers are causinclud-ing organizations to set up analytic sandboxes and build Data Science teams. Although some organizations are fortunate to have data scientists, most are not, because there is a growing talent gap that makes finding and hiring data scientists in a timely manner difficult. Still, organizations such as those in web retail, health care, genomics, new IT infrastructures, and social media are beginning to take advantage of Big Data and apply it in creative and novel ways.
Exercises
1. What are the three characteristics of Big Data, and what are the main considerations in processing Big Data?
2. What is an analytic sandbox, and why is it important? 3. Explain the differences between BI and Data Science.
Bibliography
[1] C. B. B. D. Manyika, “Big Data: The Next Frontier for Innovation, Competition, and Productivity,” McKinsey Global Institute, 2011.
[2] D. R. John Gantz, “The Digital Universe in 2020: Big Data, Bigger Digital Shadows, and Biggest Growth in the Far East,” IDC, 2013.
[3] http://www.willisresilience.com/emc-datalab [Online].
[4] C. Duhigg, The Power of Habit: Why We Do What We Do in Life and Business, New York: Random House, 2012.
[5] K. Hill, “How Target Figured Out a Teen Girl Was Pregnant Before Her Father Did,” Forbes,February 2012.
2
Data Analytics Lifecycle
Data science projects differ from most traditional Business Intelligence projects and many data analysis projects in that data science projects are more exploratory in nature. For this reason, it is critical to have a process to govern them and ensure that the participants are thorough and rigorous in their approach, yet not so rigid that the process impedes exploration.
Many problems that appear huge and daunting at first can be broken down into smaller pieces or actionable phases that can be more easily addressed. Having a good process ensures a comprehensive and repeatable method for conducting analysis. In addition, it helps focus time and energy early in the process to get a clear grasp of the business problem to be solved.
A common mistake made in data science projects is rushing into data collection and analysis, which precludes spending sufficient time to plan and scope the amount of work involved, understanding require-ments, or even framing the business problem properly. Consequently, participants may discover mid-stream that the project sponsors are actually trying to achieve an objective that may not match the available data, or they are attempting to address an interest that differs from what has been explicitly communicated. When this happens, the project may need to revert to the initial phases of the process for a proper discovery phase, or the project may be canceled.
Creating and documenting a process helps demonstrate rigor, which provides additional credibility to the project when the data science team shares its findings. A well-defined process also offers a com-mon framework for others to adopt, so the methods and analysis can be repeated in the future or as new members join a team.
2.1 Data Analytics Lifecycle Overview
The Data Analytics Lifecycle is designed specifically for Big Data problems and data science projects. The lifecycle has six phases, and project work can occur in several phases at once. For most phases in the life-cycle, the movement can be either forward or backward. This iterative depiction of the lifecycle is intended to more closely portray a real project, in which aspects of the project move forward and may return to earlier stages as new information is uncovered and team members learn more about various stages of the project. This enables participants to move iteratively through the process and drive toward operational-izing the project work.
2.1.1 Key Roles for a Successful Analytics Project
In recent years, substantial attention has been placed on the emerging role of the data scientist. In October 2012, Harvard Business Review featured an article titled “Data Scientist: The Sexiest Job of the 21st Century” [1], in which experts DJ Patil and Tom Davenport described the new role and how to find and hire data scientists. More and more conferences are held annually focusing on innovation in the areas of Data Science and topics dealing with Big Data. Despite this strong focus on the emerging role of the data scientist specifi-cally, there are actually seven key roles that need to be fulfilled for a high-functioning data science team to execute analytic projects successfully.
FIGURE 2-1 Key roles for a successful analytics project
●Business User: Someone who understands the domain area and usually benefits from the results. This person can consult and advise the project team on the context of the project, the value of the results, and how the outputs will be operationalized. Usually a business analyst, line manager, or deep subject matter expert in the project domain fulfills this role.
●Project Sponsor: Responsible for the genesis of the project. Provides the impetus and requirements for the project and defines the core business problem. Generally provides the funding and gauges the degree of value from the final outputs of the working team. This person sets the priorities for the project and clarifies the desired outputs.
●Project Manager: Ensures that key milestones and objectives are met on time and at the expected quality.
●Business Intelligence Analyst: Provides business domain expertise based on a deep understanding of the data, key performance indicators (KPIs), key metrics, and business intelligence from a reporting perspective. Business Intelligence Analysts generally create dashboards and reports and have knowl-edge of the data feeds and sources.
●Database Administrator (DBA): Provisions and configures the database environment to support the analytics needs of the working team. These responsibilities may include providing access to key databases or tables and ensuring the appropriate security levels are in place related to the data repositories.
was discussed in Chapter 1, “Introduction to Big Data Analytics.” Whereas the DBA sets up and config-ures the databases to be used, the data engineer executes the actual data extractions and performs substantial data manipulation to facilitate the analytics. The data engineer works closely with the data scientist to help shape data in the right ways for analyses.
●Data Scientist: Provides subject matter expertise for analytical techniques, data modeling, and applying valid analytical techniques to given business problems. Ensures overall analytics objectives are met. Designs and executes analytical methods and approaches with the data available to the project.
Although most of these roles are not new, the last two roles—data engineer and data scientist—have become popular and in high demand [2] as interest in Big Data has grown.
2.1.2 Background and Overview of Data Analytics Lifecycle
The Data Analytics Lifecycle defines analytics process best practices spanning discovery to project completion. The lifecycle draws from established methods in the realm of data analytics and decision science. This synthesis was developed after gathering input from data scientists and consulting estab-lished approaches that provided input on pieces of the process. Several of the processes that were consulted include these:
●Scientific method [3], in use for centuries, still provides a solid framework for thinking about and deconstructing problems into their principal parts. One of the most valuable ideas of the scientific method relates to forming hypotheses and finding ways to test ideas.
●CRISP-DM [4] provides useful input on ways to frame analytics problems and is a popular approach for data mining.
●Tom Davenport’s DELTA framework [5]: The DELTA framework offers an approach for data analytics projects, including the context of the organization’s skills, datasets, and leadership engagement. ●Doug Hubbard’s Applied Information Economics (AIE) approach [6]: AIE provides a framework for
measuring intangibles and provides guidance on developing decision models, calibrating expert estimates, and deriving the expected value of information.
●“MAD Skills” by Cohen et al.[7] offers input for several of the techniques mentioned in Phases 2–4 that focus on model planning, execution, and key findings.
FIGURE 2-2 Overview of Data Analytics Lifecycle
Here is a brief overview of the main phases of the Data Analytics Lifecycle:
●Phase 1—Discovery: In Phase 1, the team learns the business domain, including relevant history such as whether the organization or business unit has attempted similar projects in the past from which they can learn. The team assesses the resources available to support the project in terms of people, technology, time, and data. Important activities in this phase include framing the business problem as an analytics challenge that can be addressed in subsequent phases and formulating ini-tial hypotheses (IHs) to test and begin learning the data.
●Phase 3—Model planning: Phase 3 is model planning, where the team determines the methods, techniques, and workflow it intends to follow for the subsequent model building phase. The team explores the data to learn about the relationships between variables and subsequently selects key variables and the most suitable models.
●Phase 4—Model building: In Phase 4, the team develops datasets for testing, training, and produc-tion purposes. In addiproduc-tion, in this phase the team builds and executes models based on the work done in the model planning phase. The team also considers whether its existing tools will suffice for running the models, or if it will need a more robust environment for executing models and workflows (for example, fast hardware and parallel processing, if applicable).
●Phase 5—Communicate results: In Phase 5, the team, in collaboration with major stakeholders, determines if the results of the project are a success or a failure based on the criteria developed in Phase 1. The team should identify key findings, quantify the business value, and develop a narrative to summarize and convey findings to stakeholders.
●Phase 6—Operationalize: In Phase 6, the team delivers final reports, briefings, code, and technical documents. In addition, the team may run a pilot project to implement the models in a production environment.
Once team members have run models and produced findings, it is critical to frame these results in a way that is tailored to the audience that engaged the team. Moreover, it is critical to frame the results of the work in a manner that demonstrates clear value. If the team performs a technically accurate analysis but fails to translate the results into a language that resonates with the audience, people will not see the value, and much of the time and effort on the project will have been wasted.
The rest of the chapter is organized as follows. Sections 2.2–2.7 discuss in detail how each of the six phases works, and Section 2.8 shows a case study of incorporating the Data Analytics Lifecycle in a real-world data science project.
2.2 Phase 1: Discovery
The first phase of the Data Analytics Lifecycle involves discovery (Figure 2-3). In this phase, the data science team must learn and investigate the problem, develop context and understanding, and learn about the data sources needed and available for the project. In addition, the team formulates initial hypotheses that can later be tested with data.
2.2.1 Learning the Business Domain
Understanding the domain area of the problem is essential. In many cases, data scientists will have deep computational and quantitative knowledge that can be broadly applied across many disciplines. An example of this role would be someone with an advanced degree in applied mathematics or statistics.
These data scientists have deep knowledge of the methods, techniques, and ways for applying heuris-tics to a variety of business and conceptual problems. Others in this area may have deep knowledge of a domain area, coupled with quantitative expertise. An example of this would be someone with a Ph.D. in life sciences. This person would have deep knowledge of a field of study, such as oceanography, biology, or genetics, with some depth of quantitative knowledge.
the better, because the decision helps dictate the resources needed for the project team and ensures the team has the right balance of domain knowledge and technical expertise.
FIGURE 2-3 Discovery phase
2.2.2 Resources
As part of the discovery phase, the team needs to assess the resources available to support the project. In this context, resources include technology, tools, systems, data, and people.