Non-invasive mapping of corticofugal fibres from
multiple motor areas—relevance to
stroke recovery
Jennifer M. Newton,
1Nick S. Ward,
1,2Geoffrey J. M. Parker,
4Ralf Deichmann,
1Daniel C. Alexander,
3Karl J. Friston
1and Richard S. J. Frackowiak
1,5,61
Wellcome Department of Imaging Neuroscience,
2Department of Headache, Brain Injury and Rehabilitation,
Institute of Neurology,
3Department of Computer Science, University College London, London,
4Imaging Science and
Biomedical Engineering, University of Manchester, Manchester, UK,
5IRRCS Santa Lucia, Rome, Italy and
6De´partement des
e´tudes cognitives, Ecole Normale Supe´rieure, Paris, France
Correspondence to: Dr Jennifer M. Newton, UCLA Neuro BOX 951769, 1-138 RNRC Los Angeles, CA 90095-1769, USA
E-mail: [email protected]
Recovery of motor function after subcortical stroke appears to be related to the integrity of descending
connections from the ipsilesional cortical motor system, a view supported by the observation of greater
than normal movement-related activation in ipsilesional motor regions in chronic subcortical stroke patients.
This suggests that damage to the descending output fibres from one region of the cortical motor system may be
compensated by activity in areas that retain corticofugal outputs. Though the trajectories of corticofugal fibres
from each major component of the motor system through the corona radiata and internal capsule are well
described in non-human primates, they have not been described fully in humans. Our study set out to map the
trajectories of these connections in a group of healthy volunteers (8 male, 4 female; age range
=
31–68 years,
median
=
48.5 years) and establish whether this knowledge can be used to assess stroke-induced disconnection
of the cortical motor system and better interpret functional reorganization of the cortical motor system. We
describe the trajectories of the connections from each major component of the motor system to the cerebral
peduncle using diffusion-weighted imaging and probabilistic tractography in normal subjects. We observed
good reproducibility of these connections over subjects. The comparative topography of these connections
revealed many similarities between humans and other primates. We then inferred damage to corticofugal
pathways in stroke patients (n
=
3) by comparing the overlap between regions of subcortical white matter
damage with the trajectories of the connections to each motor area. In a small series of case studies, we found
that inferred disconnections could explain enhanced hand-grip-related responses, as assessed with functional
MRI, in the ipsilesional motor system. These results confirm that selective disruption of motor corticofugal
fibres influences functional reorganization and outcome in individual patients.
Keywords
: diffusion tensor; tractography; stroke; motor recovery; functional MRI
Abbreviations
: DWI
=
diffusion-weighted imaging; FA
=
fractional anisotropy; fMRI
=
functional MRI;
M1
=
motor cortex; MNI
=
Montreal Neurological Institute; NHPT
=
Nine-Hole Peg Test; PMd
=
dorsal premotor area;
PMv
=
ventral premotor area; SMA
=
supplementary motor area
Received November 23, 2005. Revised February 3, 2006. Accepted March 30, 2006. Advance Access publication May 15, 2006
Introduction
Evidence from studies of non-human primates has
chal-lenged the traditional view of the primary motor cortex
(M1) as the locus of a final common motor output signal.
Observation of corticospinal fibre contributions from
pre-motor areas, such as the ventral prepre-motor area (PMv) and
the dorsal premotor area (PMd) on the lateral surface of
the hemisphere and the supplementary motor area (SMA)
on the medial wall, suggests that these areas have the
poten-tial to act in parallel to generate output to the spinal cord
necessary for movement (Catsman-Berrevoets and Kuypers,
#The Author(2006).Published by Oxford University Press on behalf of the Guarantors of Brain. All rights reserved. For Permissions, please email: [email protected]
by guest on June 9, 2013
http://brain.oxfordjournals.org/
2000). In addition, observation of increased
movement-related brain activation in ipsilesional motor regions in
patients with chronic subcortical hemiparetic stroke has
led to the suggestion that this reflects increased reliance
on undamaged ipsilesional corticofugal fibres (Seitz
et al
.,
1998; Marshall
et al
., 2000; Ward
et al
., 2003). These findings
support the view that damage to the descending output fibres
from one motor cortical area can be partially compensated
for by activity in another area with intact corticofugal fibres.
Recent combined transcranial magnetic stimulation (TMS)
and functional MRI (fMRI) findings suggest that damage to
primary motor output pathways can lead to recruitment of
ipsilesional motor areas such as PMd, PMv and SMA that
retain intact, parallel, corticofugal fibres (Ward
et al
., 2006).
To establish the relationship between increased activation
in components of the cortical motor system and the
post-stroke integrity of their respective corticofugal outputs, it is
necessary to characterize these connections non-invasively.
Diffusion tensor imaging allows evaluation of the integrity of
the white matter by calculation of fractional anisotropy (FA)
(Werring
et al
., 1998; Werring
et al
., 2000; Pierpaoli
et al
.,
2001) as well as mapping of probable fibre trajectories, which
involves following the estimated fibre orientation of
succes-sive voxels to generate streamlines connected to chosen start
points (Conturo
et al
., 1999; Mori
et al
., 1999). Mapping
descending fibres in the cortical motor system is often used
to validate tractography algorithms due to the size of the
tract and knowledge of its trajectory in non-human primates.
Many techniques have been successful in identifying
connec-tions from the cortical motor system to the cerebral peduncle
(Ciccarelli
et al
., 2003; Guye
et al
., 2003; Parker
et al
., 2003;
Johansen-Berg
et al
., 2004; Holodny
et al
., 2005; Konishi
et al
., 2005; Pagani
et al
., 2005; Parker and Alexander,
2005). The same techniques have been used to investigate
how white matter damage affects corticofugal connections
(Kunimatsu
et al
., 2003; Yamada
et al
., 2004; Konishi
et al
.,
2005; Lee
et al
., 2005; Pagani
et al
., 2005). However, previous
studies have not attempted to identify the trajectories of
corticofugal fibres originating from separately identified
components of the cortical motor system nor to estimate
the degree of damage to each connection after stroke.
In this study we characterized the trajectories of
connec-tions from each major component of the motor system to the
cerebral peduncle using information derived from
probabil-istic tractography in a group of healthy volunteers. We used
Material and methods
Subjects
Twelve right-handed healthy volunteers with no history of
neurological abnormality were studied (8 male, 4 female; age
range
=
31–68 years, median
=
48.5 years). In addition, three stroke
patients were recruited from the outpatient services at the National
Hospital for Neurology and Neurosurgery, London. All patients had
suffered from first-ever stroke with subcortical white-matter
damage
>
20 months previously, resulting in weakness of at least
the wrist and finger extensors and interosseus muscles [to
<
4
+
on
the Medical Research Council (MRC) scale], for at least 48 h after
onset of symptoms. All patients were scored on the following
out-come measures: (i) Barthel activities of daily living (ADL) index;
(ii) motricity index (MI) for upper limb function; (iii) Nine-Hole
Peg Test (NHPT); (iv) grip strength; and (v) timed 10-m walk
(Table 1). Maximum grip strength was measured with the same
manipulandum used for MRI scanning. Grip strength was
calcu-lated as the maximum grip strength for the affected hand divided by
that of the unaffected hand, expressed as a percentage (Sunderland
et al
., 1989). NHPT score represents pegs/second for the affected
hand divided by pegs/second for the unaffected hand, expressed as a
percentage.
Written consent was obtained from all participants in accordance
with the Declaration of Helsinki. The study was approved by the
Joint Ethics Committee of the Institute of Neurology (UCL) and
National Hospital for Neurology and Neurosurgery (UCL Hospitals
NHS Foundation Trust), London.
MRI protocol
All scans were performed on a 3 T Siemens Allegra MRI System
(Siemens, Erlangen, Germany) using a standard transmit/receive
head coil. Three data sets were acquired: diffusion-weighted
echo-planar images, motor event-related fMRI and a T
1-weighted
structural scan.
A single-shot diffusion-weighted echo-planar imaging sequence
with a double spin-echo module to reduce the effect of eddy
cur-rents was used (Reese
et al
., 2003). Each data volume consisted of
60 axial slices of 2.3 mm thickness, with no interslice gaps, and an
acquisition matrix of 96
·
96 and a field of view of 220 mm,
resulting in 2.3 mm
3isotropic voxels. Interleaved slice sampling
was chosen to avoid cross-talk between adjacent slices. Each
diffusion-weighted imaging (DWI) data set consisted of 64 high
diffusion-weighted images (
b
=
1000 smm
2), with diffusion
gra-dients applied along 64 optimized diffusion directions (Jones
et al
.,
1999) and 7 additional images with minimal diffusion-weighting
(
b
=
100 smm
2). An effective
b
=
0 image was calculated by
by guest on June 9, 2013
http://brain.oxfordjournals.org/
extrapolation from the seven minimally diffusion-weighted images.
Data acquisition was cardiac gated to reduce motion artefacts due
to pulsation of the cerebrospinal fluid (Wheeler-Kingshott
et al
.,
2002); diffusion data acquisition time was on average 25 min,
depending on heart rate.
fMRI data were acquired in three sessions during which subjects
performed a dynamic isometric hand-grip task using either their
right or left hands only, or either hand in a randomized
counter-balanced order. Hand grips were performed using an
MRI-compatible manipulandum as described previously (Ward
et al
.,
2003). The dynamic change in grip force was projected in real
time onto a screen as a column whose height varied linearly
with change in voltage measured from the manipulandum and
hence force. Before scanning, but whilst lying in the scanner,
subjects were asked to grip the manipulandum with maximum
force to generate a maximum voluntary contraction (MVC).
These measurements were made separately for each hand. The
target force for each hand was set at 20% of the corresponding
MVC for each subject and was indicated by a horizontal bar on the
screen. Each hand grip was cued by the appearance of an arrow at
the bottom of the display. The arrow cued the hand required to
make the grip and only the grip force level for the cued hand was
presented on the screen. The volunteers were instructed to make a
single brief hand grip, to be continued until the column
represent-ing force applied came into contact with the horizontal bar on the
screen, at which point the grip could be released.
Single-hand grip sessions consisted of 24 cued events (hand
grips) and 24 null events, whereas in the session in which subjects
made hand grips with either hand there were 24 hand grips with
each hand and 24 null events. These events were presented in a
randomized and counterbalanced order with a cue onset
asyn-chrony of 5.7 s. Before scanning, subjects were trained until
com-fortable with the task. Participants held the manipulandum in both
hands during each session, enabling identification of any mirror
movements.
The functional data acquired during motor task performance
consisted of T2*-weighted MRI transverse echo-planar images
[echo time (TE)
=
30 ms] with blood oxygenation
level-dependent (BOLD) contrast. Each echo-planar image comprised
48 contiguous axial slices (2 mm thick with an interslice gap of
1, 3 mm in-plane resolution) positioned to cover the whole
cere-brum with an effective repetition time (TR) of 3.12 s per volume.
The single-hand grip sessions consisted of 105 volumes acquired
continuously; the session in which grips of either hand were cued
comprised 140 volumes. The first 6 volumes were discarded to allow
for T
1equilibration effects.
In addition, a T1-weighted structural image was acquired using
an optimized 3D MDEFT sequence with an isotropic spatial
resolution of 1 mm (Deichmann
et al
., 2000; Deichmann
et al
.,
2004) and special RF pulses to compensate for the transmit coil’s
inhomogeneities (Deichmann
et al
., 2000).
Pre-processing of DWI data
The diffusion tensor eigenvalues and eigenvectors were calculated
from the DWI data set for each control subject and patient using a
conventional single tensor analysis, and FA maps were generated
(Pierpaoli and Basser, 1996).
In addition, the DWI data from the 12 control subjects were used
to map probable corticofugal connections of the motor system with
probabilistic tractography. First, we use the algorithm of Alexander
et al
. (2002) to identify fibre crossings. The algorithm fits a spherical
harmonic model to the apparent diffusion coefficient as a function
of gradient direction. The resulting series is truncated at order 0, 2,
or 4 using the analysis of variance test for deletion of variables to
select the best model in each voxel. The F-statistic thresholds used
for model truncation are the same for all individuals in the study
under the assumption of similar noise levels in all data sets
(Alexander
et al
., 2002; Parker and Alexander, 2003). Truncation
at order 0 indicates isotropic diffusion, whereas truncation at order
2 indicates that the single tensor model is a good approximation.
When fourth-order terms are included in the series, the single
tensor fit is poor and a two-tensor model is used: the principal
directions of the two diffusion tensors provide estimates of the
orientations of the crossing fibres, as described in Parker and
Alexander (2003).
Generation of transforms between native DWI space
and standard MNI space
The transform between native DWI space into standardized space,
as defined by the Montreal Neurological Institute (MNI), was
esti-mated by first co-registering the T1
structural scan of each subject
with their extrapolated
b
=
0 map. This co-registered structural
image was then normalized using an integrated spatial
normaliza-tion and segmentanormaliza-tion routine implemented in SPM5 (Wellcome
Department of Imaging Neuroscience—www.fil.ion.ucl.ac.uk/spm),
with white and grey matter prior probability maps (Ashburner and
Friston, 2005). The estimated normalization parameters were then
applied to the FA maps both of the control group and the three
stroke patients. All normalized images were re-sampled to 2-mm
isotropic voxels. The generation and applications of these
trans-forms to the data sets are detailed in Supplementary Fig. 1.
Tractography seed region selection
The seed regions for tractography were chosen by defining the
cross-section of the cerebral peduncle on the
z
=
16 mm plane
of the normalized FA map and T1–weighted structural image for
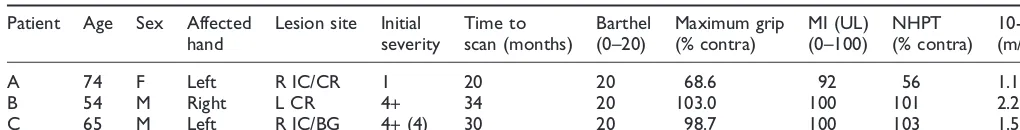
Table 1
Patient characteristics and outcome scores
Patient
Age
Sex
Affected
Minimum to maximum scores (or units) are expressed under each outcome score. M
=
male; F
=
female; L
=
left; R
=
right;
IC
=
internal capsule; CR
=
corona radiata; BG
=
basal ganglia; MI
=
motricity index; UL
=
upper limb; NHPT
=
Nine-Hole Peg Test.
by guest on June 9, 2013
http://brain.oxfordjournals.org/
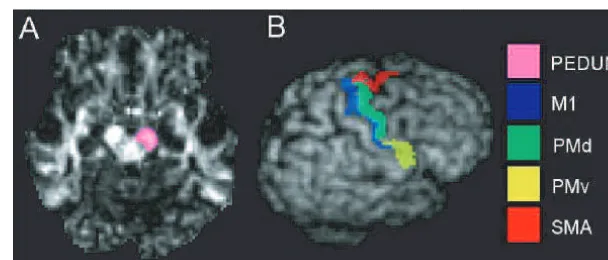
each subject, as shown in Fig. 1A, using MRIcro (Rorden and Brett,
2000). The seed region encompassed all white matter voxels in the
cross-section as identified on the FA map, corresponding to the crus
cerebri, though owing to the resolution of the images some seed
voxels may have included parts of the substantia nigra (Duvernoy,
1995). The initial selection of seed points was made in standard
MNI space to ensure that the peduncles were defined at an
equiva-lent level across all individuals. The resulting region of interest was
then transformed into native space, using the inverse of the
normal-izing transformation described above.
Definition of cortical target areas
The four major cortical areas known to contribute to the
descend-ing motor tracts were defined usdescend-ing cortical landmarks on the
co-registered T1-weighted structural image of each control subject.
M1 was defined as the anterior bank of the central sulcus, the
paracentral lobule on the medial convexity and the exposed cortical
surface of the precentral gyrus. This was limited by a rostral border
formed by a line running from the vertex of the precentral sulcus at
the longitudinal cerebral fissure to the vertex of the central sulcus
at the level of the junction of the superior frontal sulcus with the
precentral sulcus (Geyer
et al
., 2000). PMd was defined as the
posterior bank of the superior precentral sulcus and the remainder
of the portion of the precentral gyrus posterior to it, whereas PMv
was defined as the posterior bank of the inferior precentral sulcus
and the exposed cortical surface of the precentral gyrus posterior to
it. The SMA was defined as the medial cortex lying above the
cingulate sulcus and caudal to the line drawn through the anterior
commissure perpendicular to the anterior commissure–posterior
commissure line. The regions defined for a single subject are
shown rendered on their T1-weighted structural image in Fig. 1B.
Fibre tracking
The Probabilistic Index of Connectivity (PICo) algorithm (Parker
and Alexander, 2003, 2005; Parker
et al
., 2003) was used to trace the
tracts connected to the cross-section of the cerebral peduncle of
each hemisphere in the native image acquisition space of each
subject. This method involves repeated iterations of the streamline
process using Monte Carlo methods to exploit the inherent
uncer-tainty in the orientation of the principal diffusion direction(s)
defined for each image voxel. The procedure provides maps of
the probability of a connection from the seed point to a chosen
area (Parker and Alexander, 2003, 2005; Parker
et al
., 2003). Before
tracking, probability density functions (PDFs) are generated from
the diffusion tensor(s) for each voxel, which provide voxel-wise
estimates of confidence of the fibre tract orientation. For each
iter-ation, a streamline is propagated through the multi-tensor field
derived from the PDFs for that iteration. Stopping criteria prevent
biologically implausible curvature of streamlines (
>
180
on the scale
of a single voxel) or attempts to transit non-brain voxels.
Here, 1000 streamlines were used to identify the routes of
connection from each seed point in the peduncle, through the
multi-tensor field, to the cortical motor system areas above. For
each of the four cortical areas, maps were formed in which the
intensity of each voxel reflected the number of streamlines that
crossed that voxel en route to the respective cortical area.
The maps of the total streamline densities between the peduncle
and each of the cortical areas were then thresholded to form binary
masks showing voxels that had been hit by at least one streamline
from the peduncle. The resulting masks were transformed into MNI
space using the normalization transforms determined previously.
The normalized masks for individual control subjects were
then summed to produce trajectory variability maps, in which
the voxel intensities ranged from 1 to 12. These values represent
the degree of spatial variability and overlap of connections between
subjects (Ciccarelli
et al
., 2003; Pagani
et al
., 2005; Parker
et al
.,
2005; Ramnani
et al
., 2005). Finally, the maps generated for the
connections from the peduncle in the left and right hemispheres
were then combined.
To aid visualization, the four area-specific trajectory variability
maps were thresholded so that only voxels that were common to the
tracts of eight or more subjects were retained. The ensuing
masks were then coded and combined, generating two maps
show-ing the location and overlap of the most common location of tracts
connecting the peduncle with (i) M1, PMd and SMA; (ii) PMd,
PMv and SMA. The threshold of eight or more subjects, equivalent
to two-thirds of the sample, was chosen, as this enabled
visualiza-tion of the overlap of the most common connecvisualiza-tions to each of the
cortical areas while facilitating the description of the relative
loca-tions of these connecloca-tions. When the threshold is raised to 10 or
lowered to 6 or more subjects the same general patterns are still
visible as shown in Supplementary Fig. 2.
Patient versus control group comparisons
All patient versus control group comparisons were performed with
SPM2 (www.fil.ion.ucl.ac.uk/spm).
Fig. 1
Definition of seed points and cortical motor areas for tractography. (A) Seed points for tractography shown on the cross-section of
the right cerebral peduncle on the
z
=
16 mm plane of the normalized FA map for an individual. (B) Cortical motor areas of the
right hemisphere, as defined on the same individual, shown on the individual’s volume-rendered T1-weighted image.
by guest on June 9, 2013
http://brain.oxfordjournals.org/
Fractional anisotropy
The normalized FA maps were smoothed with an isotropic
Gaussian kernel of 8-mm full-width half-maximum (FWHM).
The patients were compared individually with the group of 12
con-trol subjects on a voxel-wise basis using a one-way ANOVA
(ana-lysis of variance). Significant differences in anisotropy were detected
at a threshold of
P
<
0.001 (uncorrected) with a minimum cluster
size of 10 voxels. These clusters then formed regions of interest that
were overlaid onto the trajectory variability maps of the four motor
areas. The transaxial slice on which there was the greatest overlap
was determined (Pineiro
et al
., 2000). The number of voxels in the
region of overlap was expressed as a proportion of the total voxels
forming the tract (at the threshold of eight or more subjects) on that
particular transaxial section.
In addition, the outer surfaces of the clusters of reduced FA were
defined and the surfaces were overlaid on maps showing overlap of
the most common locations of tracts connecting the peduncle with
M1, PMd and SMA.
fMRI
All volumes were co-registered to the first volume and then
unwarped to allow for echoplanar imaging (EPI) distortions due
to head movement during scanning (Andersson
et al
., 2001). To
correct for different acquisition times, the signal measured in each
slice was shifted in time relative to the acquisition of the middle
slice using sinc interpolation. The resulting volumes were then
normalized to a standard EPI template based on the MNI reference
brain and re-sampled to 3-mm isotropic voxels. All normalized
images were then smoothed with an isotropic 8-mm FWHM
Gaussian kernel. The time series in each voxel were high-pass
filtered at 1/128 Hz to remove low-frequency confounds and
scaled to a grand mean of 100 over voxels and scans within each
session.
Statistical analysis was performed in two stages. In the first stage,
a single-subject fixed effects model was used. Hand grips of each
hand were modelled as delta functions for each of the three sessions.
The resulting covariates were each convolved with three basis
func-tions: the canonical haemodynamic response function (HRF) and
its temporal and dispersion derivatives (Friston
et al
., 1998; Henson
et al
., 2002). These covariates were used in a general linear model
together with a single covariate representing the mean (constant)
term over scans. Parameter estimates for each covariate were
calculated using maximum likelihood. Contrasts of the parameter
estimates encoding the effects of all hand grips of each hand were
formed. These contrasts selected the effects explained by the
cano-nical HRF and its temporal and dispersion derivatives, pooled over
the three sessions. These contrast maps summarized the grip-related
responses for each subject.
In the final stage of analysis, the contrasts for each subject were
entered into second (between-subject) level one-way ANOVAs to
compare the fMRI responses to hand grips with the paretic hand in
individual patients with responses to movement of the same hand
for all control subjects. Linear contrasts were then used to identify
voxels that showed greater activation for hand grips in each patient.
As we were specifically interested in movement-related signal
changes in the cortical motor system, the cortical motor areas
defined for each control subject were transformed into standard
space to form a search volume for each hemisphere. Voxel-wise
t
-tests were used to identify significant differences in
hand-grip-related activation at a threshold of
P
<
0.001 (uncorrected) within
each search volume. Additionally, the SPM{
t
}s were thresholded
with a family-wise error of
P
<
0.05 (corrected) for more stringent
identification of activation differences.
Results
Normal anatomy of the connections
between the cerebral peduncle and
the cortical motor system
In all subjects, probable connections were successfully
tracked from the cerebral peduncle seed points to M1,
PMd and SMA, whereas connections to PMv were tracked
in 10 of the 12 control subjects. There was good
reprodu-cibility of the trajectories between the peduncle and each
cortical area across subjects, as demonstrated by the
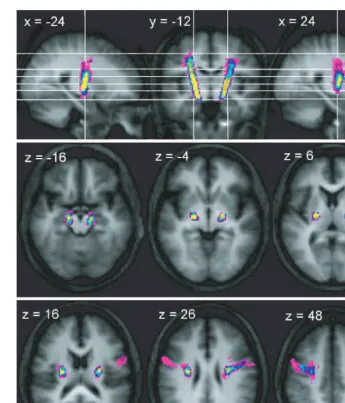
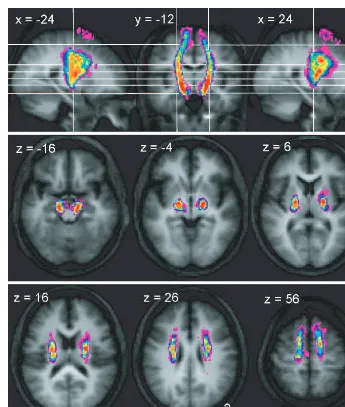
trajec-tory variability maps shown in Figs 2, 3, 4 and 5. Figure 6 and
Supplementary Fig. 3 shows a high degree of overlap between
the putative connections from each of the cortical areas,
particularly at more inferior levels. The differential
topogra-phy of connections to each of the cortical areas will now be
described. Though the putative routes of the descending
connections have been derived from a probabilistic
multi-fibre streamline approach initiated in the cerebral peduncles,
the anatomy of these connections will be presented in the
anterograde direction.
Trajectory of connections between the
cerebral peduncle and M1
In the series of axial sections immediately inferior to the
cortex, we found that connections between the cerebral
ped-uncle and M1 rapidly form a concentrated bundle as they
enter the corona radiata (Fig. 2). On entering the corona
radiata they maintain a fixed location in successive inferior
sections, suggesting that fibres descending from this region
stream vertically through the corona radiata. At the level of
the internal capsule, the peduncular–M1 connections are
located between the posterior portion of the putamen and
the thalamus in the posterior limb of the internal capsule and
continue to suggest a vertical course of the related fibres. In
both the corona radiata and internal capsule the connections
between the cerebral peduncle with M1 are located most
posteriorly of all the motor system connections. Connections
to M1 are located laterally in the cerebral peduncle, though
there is a strong overlap with the connections to PMd, and
more medially with the SMA (Fig. 6).
Trajectory of connections between the
cerebral peduncle and PMd
As with the peduncular–M1 connections, the concentration
of connections immediately inferior to the cortex suggests a
rapid aggregation of fibres from the PMd region as they enter
the corona radiata. Once in the corona radiata, they also run
vertically, located anteriorly to connections originating
from M1, though there is a large degree of overlap between
connections from these two precentral areas (Fig. 6). As the
connections from PMd enter the internal capsule, the most
by guest on June 9, 2013
http://brain.oxfordjournals.org/
anterior connections overlap with those of the SMA (Fig. 6)
and PMv (Supplementary Fig. 3), whereas the most posterior
connections overlap with M1 connections. Connections to
PMd are also located laterally in the cerebral peduncle, though
there is considerable overlap with the origins of connections
reaching each of the motor cortical areas (Fig. 6).
Trajectory of connections between the
cerebral peduncle and PMv
Connections between the peduncle and PMv were identified
in 10 of the 12 control subjects. The consistency of
trajec-tories within this subset of subjects was high and revealed a
continuous tract between the peduncle and the cortex
(Fig. 4). However, after thresholding of the variability maps
to visualize the voxels through which connections passed in
eight or more individuals, a common route was observed
between the peduncle and the inferior level of the corona
radiata, though not to the cortex (Supplementary Fig. 3).
As shown in Fig. 4, there is a rapid medial shift of
connections immediately inferior to the PMv. The resulting
bundle tends to be located more anteriorly than the majority
of PMd fibres, though overlap does occur (Supplementary
Fig. 3). The trajectory of peduncle–PMv connections follows
a mostly vertical route through the corona radiata and
pos-terior limb of the internal capsule, with an anpos-terior shift
relative to the majority of M1 and PMv connections visible
at these levels. At the level of the peduncle the PMv
con-nection origins do not extend as laterally as those of M1 and
PMd (Supplementary Fig. 3).
Trajectory of connections between the
cerebral peduncle and the SMA
Connections to the SMA are located progressively more
lat-erally in successive axial slices at the levels below the SMA
until the approximate level of the lateral ventricles (Fig. 5).
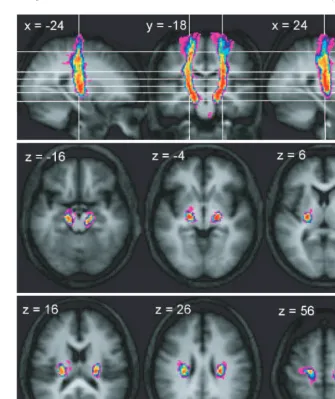
Fig. 2
Trajectory variability maps for the peduncle/M1 connections shown on representative sections of the average of the T
1-weighted
structural. Colour bar shows number of subjects with connections in each voxel: range
=
2–12. The top panel shows sagittal slices
x
=
24 and
x
= +
24 either side of coronal slice
y
=
18. The lower two panels show transverse slices. The right side of the brain is
depicted on the right side of the transverse and coronal images.
by guest on June 9, 2013
http://brain.oxfordjournals.org/
In addition, the SMA connections shift in a posterior
direc-tion on subsequent inferior axial planes from the cortex to
the peduncle, suggesting that fibres from the SMA course
caudally and inferiorly in the subcortical white matter. The
route of the SMA connections passes close to the caudal
portion of the head of the caudate in the genu and anterior
limb of the internal capsule at its most superior level, before
passing over the putamen and shifting to the posterior limb
of the internal capsule at more inferior levels. SMA
connec-tions tend to be located anterior to those of any of the three
precentral regions, though there is some overlap of these
connections with those of other non-primary regions, as
well as with M1 connections, though only at inferior levels
of the internal capsule and the peduncle (Fig. 6). At the level
of the cerebral peduncle, the SMA-connected seed points
tend to be found in more ventral and medial locations
than those of the precentral region.
Structural consequences of damage to
the descending motor fibres
For each patient, voxel-wise comparison of FA with the
control group revealed focal reductions in anisotropy
(Table 2). All patients showed relative FA reductions in
the internal capsule and/or corona radiata, which extended
beyond the margins of the lesion(s) as seen on the
corre-sponding T
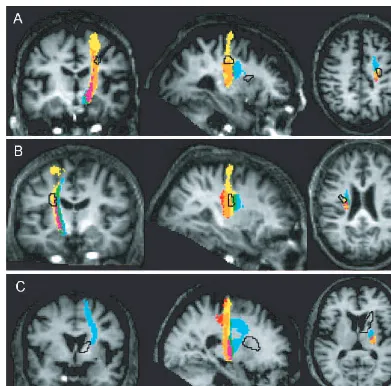
1-weighted structural image. Figure 7 illustrates
the intersection of FA reductions in each patient with the
combined trajectory maps, and shows voxels through which
streamlines pass to each cortical area for eight or more
con-trol subjects. The maximal overlap of damaged white matter
on the most common connections to each cortical area is
reported for each patient in Table 3.
As shown in Fig. 7A and Table 3, the region of reduced
anisotropy in the corona radiata of Patient A intersected
mostly with the connections of M1 and PMd. There was
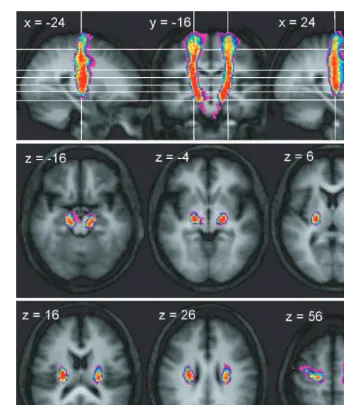
Fig. 3
Trajectory variability maps for the peduncle/PMd connections shown on representative sections of the average of the T1-weighted
structural. Colour bar shows number of subjects with connections in each voxel: range
=
2–12. The top panel shows sagittal slices
x
=
24 and
x
= +24 either side of coronal slice
y
=
16. The lower two panels show transverse slices. The right side of the brain is
depicted on the right side of the transverse and coronal images.
by guest on June 9, 2013
http://brain.oxfordjournals.org/
minimal overlap with SMA projections located rostral to this
region of reduced FA. No voxels at the level of this damaged
area were common to the PMv trajectories of eight or more
subjects. In addition, the other region of significantly
reduced anisotropy in Patient A, located at the level of
the internal capsule, did not overlap with any motor system
connections (Fig. 7A). In Patient B, there was significant
overlap between the region of reduced FA and connections
to all precentral regions. The highest proportion (80%) of
damaged voxels overlapped with connections to PMv and no
more than 10% to SMA (Table 3, Fig. 7B). The region of
reduced FA in Patient C was located anterior to connections
from the precentral components of the motor system; there
was minimal overlap with SMA projections (Table 3,
Fig. 7C).
In summary, the subcortical lesions (as inferred by analysis
of FA) in Patient A interrupted more posterior trajectories
connecting to M1 and PMd. Patient B had more extensive
damage anteriorly, implying a disconnection of PMv, as well
as M1 and PMd. The lesions in Patient C were even more
anterior and spared the connections to the motor areas we
considered. We therefore predicted that Patients A and B
would show abnormal patterns of cortical responses in the
ipsilesional motor system and that Patient C would show no
abnormalities. This is largely what we observed.
Functional consequences of damage to
the descending motor fibres
Comparison of the activations associated with grip of the
affected hands in individual stroke patients with activations
in the control group revealed only relative increases in
task-related activation in the patients (Table 2). In Patient A,
there were two clusters of overactivation in the ipsilesional
Fig. 4
Trajectory variability maps for the peduncle/PMv connections shown on representative sections of the average of the T
1-weighted
structural. Colour bar shows number of subjects with connections in each voxel: range
=
2–12. The top panel shows sagittal slices
x
=
24 and
x
= +
24 either side of coronal slice
y
=
12. The lower two panels show transverse slices. The right side of the brain is
depicted on the right side of the transverse and coronal images.
by guest on June 9, 2013
http://brain.oxfordjournals.org/
precentral sulcus in regions corresponding to rostral PMd in
the depth of the sulcus, extending into the middle frontal
gyrus, and PMv (though this cluster was only significant at
uncorrected
P
<
0.001 level) (Fig. 8A). In Patient B, peaks of
relative overactivation were observed on the ipsilesional
precentral gyrus, encompassing portions of PMd and M1
(though not the hand knob region) as shown in Fig. 8B,
and contralesional PMv. The activation pattern of Patient C
did not significantly differ from those of the control group.
Discussion
Anatomical findings
We have demonstrated, in standard anatomical space, the
most probable trajectories of the corticofugal connections
of the major divisions of the cortical motor system using
high-angular resolution DWI and probabilistic tractography
in a group of healthy adults. These findings are in agreement
with previous clinical and anatomical findings in humans
(Englander
et al
., 1975; Ross, 1980; Fries
et al
., 1993; Seitz
et al
., 1998; Pineiro
et al
., 2000; Wenzelburger
et al
., 2005)
and reveal many similarities between the organization of
these connections in humans and other primates, as
inves-tigated with neuronal tracer methods (Fries
et al
., 1993;
Morecraft
et al
., 2002).
The position and degree of overlap of corticofugal fibres
from each cortical motor area, particularly in the internal
capsule, have been of interest for many years as a means of
furthering understanding of the relationship between
loca-lized white matter damage and restitution of motor function.
We found that the connections from M1 to the cerebral
peduncle passed through the posterior limb of the internal
Fig. 5
Trajectory variability maps for the peduncle/SMA connections shown on representative sections of the average of the T1-weighted
structural. Colour bar shows number of subjects with connections in each voxel: range
=
2–12. The top panel shows sagittal slices
x
=
24 and
x
= +
24 either side of coronal slice
y
=
12. The lower two panels show transverse slices. The right side of the brain is
depicted on the right side of the transverse and coronal images.
by guest on June 9, 2013
http://brain.oxfordjournals.org/
capsule, as previously found in anatomical (Englander
et al
.,
1975; Ross, 1980) and tractography-based (Guye
et al
., 2003)
studies in humans, as well as in tracer studies in non-human
primates (Fries
et al
., 1993; Morecraft
et al
., 2002). The
connections we found linking PMd to the peduncles also
ran through the posterior limb, though, in agreement
with tracing-derived evidence, these connections tended to
be located more anteriorly than those linked to M1
(Morecraft
et al
., 2002). In contrast to earlier findings in
the non-human primates, we did not find evidence of
PMv fibres transiting the genu of the internal capsule
(Morecraft
et al
., 2002), though we did find that PMv
connections occupied more anterior locations compared
with the majority of those linked to PMd. In contrast,
con-nections to the SMA were found to pass through the genu
and anterior limb of the internal capsule at superior levels
followed by a gradual shift to the posterior limb on more
inferior sections—an observation that parallels that of
pre-vious tracer studies (Fries
et al
., 1993; Morecraft
et al
., 2002).
Correct identification of neuronal pathways with
tracto-graphy is dependent on accurate classification of the
diffu-sion profile in each voxel of the brain, as this model will
determine the possible directions sampled by the
tracto-graphy algorithm. When tracing descending fibres of the
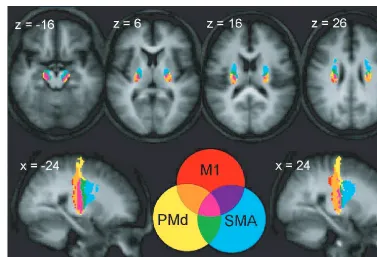
Fig. 6
Sections showing the overlap between the thresholded trajectory variability maps (eight or more subjects) for M1, PMd and
SMA on axial and sagittal sections. Coordinates for
x
and
z
correspond to MNI space.
Table 2
Single patient versus control group comparisons
Patient
Significant decreases in anisotropy
Significant increases in fMRI activation
Coordinates in MNI space
Z
Region
Coordinates in MNI space
Z
Region
A
30,
16, 38
4.03
R CR
33,
3, 42
4.38
R PMd
(rostral border)
24, 12, 14
3.72
R IC
51, 3, 9
3.69
R PMv
†B
32,
12, 26
4.37
L CR
48,
3, 51
5.25
L PMd
54 9 27
5.04
R PMv
C
16, 6, 16, 5.14
R IC
–
–
–
The table shows regions in which there were significant decreases in anisotropy (left) and significant increases in task-related activation between
each stroke patient and the control group.
Coordinates represent peak voxels within significant clusters. Significance was set at
P
<
0.001 (uncorrected) for clusters of 10 or more voxels
for the anisotropy analysis. For the fMRI analysis, significance was defined at
P
<
0.05 corrected in search volume consisting of cortical motor
system areas of relevant hemisphere.
yCluster not significant with correction (FWE,
P
<
0.05)—significant uncorrected
P
<
0.001; L
=
left; R
=
right; CR
=
corona radiata;
IC
=
internal capsule.
by guest on June 9, 2013
http://brain.oxfordjournals.org/
motor system, some streamlines would be expected to
encounter voxels where corticospinal fibres are crossing
other tracts such as the superior longitudinal fasciculus
(SLF) or transcallosal fibres. Here, the probability density
functions describing the possible diffusion directions in
each voxel were based on either a single tensor or bi-tensor
model, depending on the best fit to the data (Alexander
et al
., 2002; Parker and Alexander, 2003). This method
Fig. 7
Sections showing the regions of reduced anisotropy in each patient (black outline) overlaid on the maps of the overlap between the
thresholded trajectory variability maps (eight or more subjects) for M1, PMd and SMA shown on the T
1-weighted image for the
respective patient. Colour key as for Fig. 6.
Table 3
Details of maximal overlap between lesion and peduncle–motor system connections
Patient M1
PMd
PMv
SMA
Section
(z)
In
lesion
On
section
Prop Section
(z)
In
lesion
On
section
Prop Section
(z)
In
lesion
On
section
Prop Section
(z)
In
lesion
On
section
Prop
A
36
6
21
0.29
34
12
32
0.38
All
–
0
n/a
36
1
36
0.03
B
28
6
26
0.23
22
10
36
0.28
22
8
10
0.80
22
3
31
0.10
C
All
0
–
0.00
All
0
–
0.00
All
0
–
0.00
12
1
29
0.03
The table shows the number of voxels that formed the tract connecting the peduncle to each cortical area in eight or more subjects on the
transaxial section on which there was the greatest overlap between the respective tract and the area of reduced anisotropy (‘On section’
values). The number of voxels in the area of overlap is also shown (‘In lesion’ values). The degree of overlap is also expressed as a
proportion (‘Prop’) of ‘In lesion’ voxels divided by ‘On section’ voxels. Hence, if ‘Prop’
=
1 on a particular transaxial section then the entire
cross-section of the tract to the respective cortical area overlaps with the area of reduced anisotropy. If ‘Prop’
=
0, then there is no overlap
between the damaged area and the tract on
any
transaxial section. The transaxial section where this overlap was greatest for each cortical area
and patient is also reported [‘Section (z)’] where
z
=
z-coordinate in MNI space.
by guest on June 9, 2013
http://brain.oxfordjournals.org/
has been shown to resolve two fibre populations in the
relevant region of the corona radiata likely to contain
cross-ing of the descendcross-ing fibres and either the SLF or
transcal-losal fibres (Alexander
et al
., 2002; Parker and Alexander,
2003). However, using more recently developed methods, a
smaller number of voxels in this region have been modelled
as the site of crossings of all three fibre populations (Tuch
et al
., 2003; Parker and Alexander, 2005; Tuch
et al
., 2005).
Such voxels would have been incorrectly modelled in the
current study; this would have resulted in poorly informed
dispersion of streamlines at these points. This may have
resulted in highly variable ‘connections’ in individuals,
though it is also conceivable that incorrect pathways may
have been reliably identified in the group data, as such
cross-ings may occur in similar locations across individuals.
How-ever, as the number of voxels classified as the site of three
fibre populations appears fairly low, we may assume that use
of this simpler multi-tensor approach would have provided
reasonable approximations of the location of the descending
connections of the cortical motor system.
The presence of incorrectly modelled voxels containing
crossings of the descending fibres, SLF and transcallosal
connections would most likely affect the correct
identifica-tion of connecidentifica-tions to the most lateral components of the
cortical motor system such as PMv. Streamlines destined for
the PMv that pass through such voxels may be diverted to
other cortical areas or may not reach the cortex owing to
excessive curvature of the streamline route resulting from the
incorrect model of the diffusion profile. These scenarios may
account for why peduncle–PMv connections were not
iden-tified in two of the control subjects, as well as the increased
variability in the location of these connections close to the
cortex in the other 10 subjects.
Though our findings suggest strong similarities between
the organization of the multiple corticofugal pathways
in humans and other primates, it must be noted that the
proportions of fibres connecting the peduncle to each
cor-tical region will differ between humans and other primates
owing to differences in the relative size of these regions; for
example, the proportion of prefrontal connections in the
peduncle of humans has been shown to exceed that of the
macaque in parallel with an increase in grey matter volume
of the prefrontal cortex (Ramnani
et al
., 2005). This
obser-vation may explain why PMv connections were not observed
to transit the genu of the internal capsule in the current
study, in contrast with the results of tracer studies (Fries
et al
., 1993; Morecraft
et al
., 2002). As assessed using
tracto-graphy, the relative contribution of the premotor cortex to
the cerebral peduncle is significantly lower in humans
com-pared with macaques, whereas the opposite relation was seen
for the contribution of the prefrontal cortex (Ramnani
et al
.,
2005). The shift in the balance between prefrontal and
premotor cortices may result in a posterior shift of the
ante-rior limit of the premotor connections in the internal
cap-sule. This suggestion is supported by the trajectory variability
map of the peduncle–prefrontal connections that suggest
that these fibres pass through the anterior limb and the
genu of the internal capsule in humans, though only
through the anterior limb in the macaque cases (Ramnani
et al
., 2005).
Comparison of the trajectories of corticofugal connections
described here in humans with invasive tracing data from
other primates is also complicated by differences in the
techniques used. An important limitation of DWI
measure-ments and the tractography approach is the inability to
dis-tinguish afferent and efferent pathways of axonal tracts.
Therefore, when using tractography to identify connections
between the peduncle and the cortical motor areas we may
also be identifying inputs to the cortical areas as well
as the descending fibres. However, as such inputs are
multi-synaptic, it seems unlikely that such connections are
strongly represented in this data, as tracking through grey
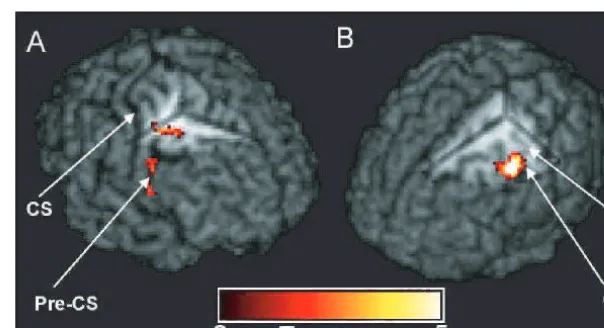
Fig. 8
fMRI results for Patients A and B shown on individual patient’s volume-rendered T
1-weighted images. (
A
) Regions of significantly
greater left (affected) hand-grip activation for Patient A compared with the control group. Cut-out reveals cluster in right PMd in the depth
of the precentral sulcus (
x
=
33,
y
=
3,
z
= +
42). (
B
) Region of significantly greater right (affected) hand-grip activation for Patient B
compared with the control group. Cut-out reveals cluster in left precentral gyrus (
x
=
48,
y
=
3,
z
= +
51). CS
=
central sulcus,
PCS
=
precentral sulcus, HK
=
hand knob region of M1.
by guest on June 9, 2013
http://brain.oxfordjournals.org/
matter is subject to high uncertainty due to the lack of
directional microstructure. This same argument applies to
inclusion of portions of substantia nigra tissue in the
tracto-graphy seed region. In addition, examination of the
connec-tions identified here does not reveal consistent pathways that
pass through the subcortical grey matter. Hence, the
connections observed with this protocol are most likely to
be corticofugal pathways, though in future studies it may be
prudent to define subcortical grey matter areas and discard
any streamlines that pass through these regions.
Investigations of subcortical routes of corticofugal fibres
have employed anterograde tracing techniques that involve
injection of tracer compounds into limited portions of
each motor cortical area. Both studies limited the initial
labelling to specific limb representations—either those of
the arm as localized by intracortical mapping (Morecraft
et al
., 2002), or various combinations of hand, face and
foot representations (Fries
et al
., 1993). Even in the latter
case the circumscribed nature of tracer injections results in a
narrower definition of the trajectories of corticofugal fibres
from each area than that obtained with tractography. Here,
tractography identified the route of streamlines from the
cerebral peduncle to the total extent of each cortical region,
encompassing connections to all representations
simulta-neously. Therefore, we expect the overlap of fibres to be
greater than that in tracer studies. We predict that use of
functionally defined representations of arm or hand
movements as target cortical areas in future studies will
reveal an even more distributed organization of these
multiple pathways.
The relative compression and extensive overlap of
specific corticofugal pathways at inferior brain levels
com-pared with the more distributed arrangement seen at
super-ior levels, as described in non-human primates using tracing
methods (Morecraft
et al
., 2002), is replicated here using
probabilistic tractography. The maps of connectivity
gener-ated using tractography are formed by iterations of the
streamline process that sample the uncertainty in the
orien-tation of the principal directions of diffusion in each voxel
(Behrens
et al
., 2003; Parker and Alexander, 2003, 2005;
Parker
et al
., 2003; Tournier
et al
., 2003). Hence, streamlines
are dispersed further owing to the propagation of
uncer-tainty as they pass through successive voxels. Stopping
criteria are used to prevent biologically implausible curvature
of streamlines (
>
180
on the scale of a single voxel) or
attempts to transit non-brain voxels. The continual
disper-sion of streamlines may result in overestimation of
overlap between connections from different cortical motor
areas. Our observation of distinct and consistent topographic
organization in the internal capsule and corona radiata
suggests that the use of probabilistic tractography does
not result in gross overestimation of the spread of
cortico-fugal fibres as would be expected with greater dispersion at
superior levels. Tractography methods will never achieve the
resolution of tracing studies owing to the partial volume
effect inherent in the magnetic resonance imaging technique.
However, by constructing maps of the most likely routes of
connections between brain regions and the peduncle across a
group of subjects, we have reduced the influence of
low-probability connection routes.
Relating tract damage to functional
recovery and activation changes
after stroke
Definition of the locations of the most common motor
corticofugal fibres in a group of healthy control subjects
was used to infer damage to these connections in patients
with lesions restricted to the subcortical white matter.
Super-imposition of regions of reduced anisotropy in individual
patients on these trajectory maps revealed varying
pro-portions of damage to corticofugal pathways from each
com-ponent of the cortical motor system. In the patients we
studied, we found that greater damage to the connections
is related to increased hand-grip-related activity in the
ipsi-lesional motor system.
Patients B and C had very similar outcome profiles despite
considerable disparity in the amount of damage to
cortico-fugal pathways. In contrast to Patient B, the site of lesion in
Patient C showed minimal overlap with putative corticofugal
fibres from all cortical motor regions. The initial motor
function deficits in both patients were also very similar—
both showed only minimal motor impairment. In the case
of Patient C, the site of lesion suggests that the acute
symp-toms may have been the result of damage to basal ganglia
circuitry rather than to corticofugal fibres. The opposite was
the case for Patient B. Increased ipsilesional motor system
activity in Patient B but not C suggests that redundancy in
the motor corticofugal connections may be responsible;
in Patient B, cortical neuronal activity may have increased
in motor areas to drive intact corticofugal connections.
In Patients A and B, considerable damage to connections
from the precentral gyrus to the peduncle was observed.
Patient A, who had the worst initial motor deficit and
sub-sequent recovery, also had the greater damage to connections
to PMd and M1, though the difference in M1-related damage
was minimal between the two individuals. Increases in
hand-grip-related activity were found in ipsilesional PMd in both
patients—in the precentral sulcus in Patient A and on the
vertex of the precentral gyrus in Patient B, though in this
patient the overactivation also included portions of M1 but
excluded the hand knob region. Patient A also showed
rela-tive overactivation of ipsilesional PMv, though this was only
observed at a less stringent statistical threshold. The finding
of overactivation of parts of M1 in Patient B, coupled with
the lack of significant deactivation within M1 in either
Patient A or B, suggests that recovery of function is probably
related to intact descending fibres from M1. The importance
of M1 fibres for restitution of hand dexterity was recently
demonstrated by Wenzelburger
et al
. (2005); they showed
that in patients with capsular stroke greater chronic motor
deficits were associated with more posterior lesion locations
by guest on June 9, 2013
http://brain.oxfordjournals.org/
connections, as the geometry of a lesion relative to the axial
sections is not considered and may result in an
underestima-tion of overlap. Previous studies using tractography in stroke
patients have used qualitative description of lesion location
relative to the corticospinal tract as defined by traced
pathways in that individual patient. This approach identified
relationships between the overlap of lesion and tract and
measures of motor outcome (Kunimatsu
et
al
., 2003;
Yamada
et al
., 2004; Lee
et al
., 2005; Konishi
et al
., 2005).
However, it may be difficult to assess the full extent of the
corticospinal tract with tractography in these patients by
virtue of the diffusion properties of their lesions. For
exam-ple, use of simple streamline-based methods where tracking
is terminated when pixels with low FA (defined as FA
<
0.3)
are encountered may exclude damaged connections from the
final traced tract (Yamada
et al
., 2004; Lee
et al
., 2005;
Konishi
et al
., 2005). Here, we did not use tractography
directly to assess the influence of lesions on corticofugal
fibres of the motor system reconstructed in each patient
owing to the potential complications in the quantitative
interpretation of probabilistic connectivity maps in the
pre-sence of reduced FA, as streamlines transiting such areas are
subject to greater uncertainty and hence dispersion.
The projections identified here are likely to include
corti-cospinal fibres, corticopontine and corticobulbar
connec-tions,
though
the
contributions
of
these
specific
projections cannot be segregated with this technique.
Corti-cospinal projections with their direct or multi-synaptic
con-nections to hand motoneurons are important for driving
motor output (Porter and Lemon, 1993). Each of the
pre-motor areas investigated have substantial corticospinal
pro-jections (Dum and Strick, 1991; He
et al
., 1993; He
et al
.,
1995; Dum and Strick, 1996). Though the premotor areas are
similar to M1 in this respect, it appears that direct
projec-tions from SMA to spinal cord motoneurons, for example,
are less numerous and less able to generate an excitatory
response than those from M1 (Maier
et al
., 2002).
Clearly, the findings from this small set of patients are not
intended to elucidate fully the relationships between amount
of fibre damage from motor cortical areas, clinical outcome
and changes in motor-related activation patterns seen in any
patient with subcortical stroke. Such an analysis will require
data from a considerably larger number of patients. Future
use of tractography-based inference about damage to
corti-cofugal fibres coupled with functional activation patterns
Acknowledgements
We would like to thank Peter Aston and Eric Featherstone
(Wellcome Department of Imaging Neuroscience) for the
design and programming involved in creating the hand-grip
manipulandum. We would also like to thank Professor Dick
Passingham and Dr Henrik Ehrsson for their advice. J.M.N.
is supported by Action Medical Research, UK. N.S.W., R.D.,
K.J.F. and R.S.J.F. are supported by the Wellcome Trust.
References
Alexander DC, Barker GJ, Arridge SR. Detection and modeling of non-Gaussian apparent diffusion coefficient profiles in human brain data. Magn Reson Med 2002; 48: 331–40.
Andersson JL, Hutton C, Ashburner J, Turner R, Friston K. Modeling geometric deformations in EPI time series. Neuroimage 2001; 13: 903–19. Ashburner J, Friston KJ. Unified segmentation. Neuroimage 2005; 26: 839–51. Behrens TE, Woolrich MW, Jenkinson M, Johansen-Berg H, Nunes RG, Clare S, et al. Characterization and propagation of uncertainty in diffusion-weighted MR imaging. Magn Reson Med 2003; 50: 1077–88.
Biber MP, Kneisley LW, LaVail JH. Cortical neurons projecting to the cervical and lumbar enlargements of the spinal cord in young and adult rhesus monkeys. Exp Neurol 1978; 59: 492–508.
Catsman-Berrevoets CE, Kuypers HGJM. Cells of origin of cortical projections to dorsal column nuclei, spinal cord and bulbar medial reticular formation of the rhesus monkey. Neurosci Lett 1976; 3: 245–52. Ciccarelli O, Toosy AT, Parker GJ, Wheeler-Kingshott CA, Barker GJ, Miller DH, et al. Diffusion tractography based group mapping of major white-matter pathways in the human brain. Neuroimage 2003; 19: 1545–55.
Conturo TE, Lori NF, Cull TS, Akbudak E, Snyder AZ, Shimony JS, et al. Tracking neuronal fiber pathways in the living human brain. Proc Natl Acad Sci USA 1999; 96: 10422–7.
Deichmann R, Good CD, Josephs O, Ashburner J, Turner R. Optimization of 3-D MP-RAGE sequences for structural brain imaging. Neuroimage 2000; 12: 112–27.
Deichmann R, Schwarzbauer C, Turner R. Optimisation of the 3D MDEFT sequence for anatomical brain imaging: technical implications at 1.5 and 3 T. Neuroimage 2004; 21: 757–67.
Dum RP, Strick PL. The origin of corticospinal projections from the premotor areas in the frontal lobe. J Neurosci 1991; 11: 667–89.
Dum RP, Strick PL. Spinal cord terminations of the medial wall motor areas in macaque monkeys. J Neurosci 1996; 16: 6513–25.
Duvernoy HM. The human brain stem and cerebellum: surface, structure, vascularization and three-dimensional sectional anatomy with MRI. Vienna: Springer-Verlag; 1995.
Englander RN, Netsky MG, Adelman LS. Location of human pyramidal tract in the internal capsule: anatomic evidence. Neurology 1975; 25: 823–6. Fries W, Danek A, Scheidtmann K, Hamburger C. Motor recovery following
capsular stroke. Role of descending pathways from multiple motor areas. Brain 1993; 116: 369–82.
by guest on June 9, 2013
http://brain.oxfordjournals.org/