REGIONAL DISPARITIES IN ONLINE MAP USER ACCESS VOLUME AND
DETERMINING FACTORS
LI Ruia,b, Yang Ninga, LI Rua, HUANG Weic,WU Huayia,b
a State Key Laboratory of Information Engineering in Surveying, Mapping and Remote Sensing, Wuhan University, 430079,Wuhan, Hubei Province, P.R.China – (ruili, 2014286190088,2016206190002,wuhuayi)@whu.edu.cn
b Collaborative Innovation Center of Geospatial Technology, 430079,Wuhan, Hubei Province, P.R.China c National Geomatics Center of China, 100830, Beijing, P.R.China – [email protected]
Commission V, WG V/4
KEY WORDS:
online map, user access volume, regional disparities, principal component regression, determining factorsABSTRACT:
The regional disparities of online map user access volume (use ‘user access volume’ in this paper to indicate briefly) is a topic of growing interest with the increment of popularity in public users, which helps to target the construction of geographic information services for different areas. At first place we statistically analysed the online map user access logs and quantified these regional access disparities on different scales. The results show that the volume of user access is decreasing from east to the west in China as a whole, while East China produces the most access volume; these cities are also the crucial economic and transport centres. Then Principal Component Regression (PCR) is applied to explore the regional disparities of user access volume. A determining model for Online Map access volume is proposed afterwards, which indicates that area scale is the primary determining factor for regional disparities, followed by public transport development level and public service development level. Other factors like user quality index and financial index have very limited influence on the user access volume. According to the study of regional disparities in user access volume, map providers can reasonably dispatch and allocate the data resources and service resources in each area and improve the operational efficiency of the Online Map server cluster.
1.
INTRODUCTION
China has shown remarkable and unprecedented dynamics
(Chen, A., Nijkamp, P., Tabuchi, T., & Dijk, J. V., 2014.), with
the development and popularization of Internet technology, online map has become an indispensable tool application in people's daily life, which injected new vitality into the traditional geographical information industry. With the increasing number of online map users, the regional disparities in map access are catching scholars' attention. After introducing the current situation on the research of regional disparities in the development of Internet, and the characteristics and access pattern that have been uncovered in
2.
RELATED WORK
2.1 The Current Research Situation on Regional Disparities of Internet Development
The financial development status, completeness of telecommunication infrastructure, urbanization level, and the stability degree of government have a significant impact on the development of the Internet (Hao, X., & Kay, C. S., 2004). By analyzing the regional disparities of Internet usage rate, Beilock (Beilock, R., & Dimitrova, D. V., 2003) pointed that, per capita GDP is the optimal determining factor; Non-financial factors, however, seems to have very limited influence on the Internet development. There are serious regional disparities that exist in China Internet development, which is mainly reflected in the development imbalance of the east, middle and west part of China. The degree of modernization, location, and telecommunication infrastructure are the most important factors for the Internet development (Qiu, J., & Wang, M., 2010). Other scholars
(Han, Y., Jian-Hui, D. U., & Guo, P. F., 2011; Degen Wang, &
Tian Chen., 2013; Wang, P., 2012; Xin, J.H., &D.M. Zheng,
2007; Zheng, S.X., 2007) studied the online resource
allocation and point out that, financial level has significant influence on Internet development, and there is positive correlation between Internet development and the financial development of the local area. Internet technologies might aggravate inequalities (Toyama, & Kentaro, 2016), understand the regional disparities and explore its determining factors provide us a way to better understand and advance the development of Internet services in different regions. As one of the Internet application, the development of online map also has some similar characteristics in regional disparities. Thus, the methods to explore the regional disparities of Internet development could also be applied to map access.
2.2 The Current Research Situation on Characteristics of Online Map Users
Many consulting institutes and companies did research on the characteristics of Online Map users. According to a report published by CNIT-Research (China IT Research Center), the Online Map users shows features as below. 1) From the
perspective of users: The Online Map users is male dominated, with the percentage of male reaches 68.4%, and 60% of the users have higher education; 72.8% of the users are within the age of 18-40. This demonstrates that the Online Map users in China are young, high-educated and male dominated. 2) From the perspective of usage behavior: the most frequently used map services are (from high to low): geographical location searching, travel route planning, location function, navigation function, near service searching (restaurants/hotel, etc.), bus and metro searching, etc. These map services can be divided into two categories: one is mainly based on transport and location, like querying, route planning and so on; the other one centers on services, like getting near services, calling a taxi, etc. 3). From the perspective of Online Map usage service: the most frequently queried information includes (from high to low): transport-related facilities like bus stop/metro station/gas station, restaurants, tourist spots, hotels, and so on.
To further understand the regional characteristics users show when accessing Online Maps and explore the determining factors, we propose three study steps in this paper: first, describe the profiles of regional disparities with statistical indexes; then, explore the potential determining factors for regional disparities; finally, analyze the degree of influence of different factors by multivariate analysis.
3. REGIONAL DISPARITIES IN USER ACCESS VOLUME
The regional distribution of map users possesses certain characteristics, and the exploration of these macro features can help the map providers better understand the spatial distribution of their users, which matters for data center construction and server configuration. This research analyzed the characteristics of regional disparities that exist in Online Map user access.
3.1 Data Introduction
processed for there may be messy code, information gap, and some other problems when the server response abnormally. The whole procedure includes data analysis, data preprocessed, data filtering, data verification, and data storage.
To investigate the regional distribution features of human users, it is necessary to get rid of the influence from machine users like web crawlers. The information recorded includes IP, access time, HTTP query type, query information (mainly about map tiles), response time and response status.
3.2 The Regional Disparities of Map World User Accesses Through IP address resolution, we get users’ geographical location and further analyze the regional distribution features of Online Map accesses.
3.2.1 Provincial Disparities of User Access Volume:
Fig.1 shows the province ranking of the average daily access volume in February 2014. The graph demonstrates that the provinces with higher rankings are: Beijing, Guangdong, Shanghai, Shandong, Zhejiang, and Jiangsu; the provinces with lower rankings are: Tibet, Macao, Qinghai, Ningxia, and Hong Kong. From the perspective of user distribution, the east part of China has much more access volume than the middle part, while the middle part also surpasses the west part obviously. And users in the top six provinces produce more than half of the total access volume, while the 20 low-ranking provinces only take up 1/4 of the total access volume. Most provinces with remarkably high online map users also ranks high in economy and population. However, there are also some exceptions that show the existence of more determining factors for the access volume of a region besides economy and population.
Figure 1. Provincial distribution of user access volume
3.2.2 Zoning Disparities of User Access Volume:
Fig.2 shows the ranking result of the 7 zoning areas of China in
the Online Map access volume, from high to low, they are: East China (41.2%), North China (18.4%), South China (10.6%), Middle of China (10.3%), Southeast China (8.7%), Northwest China (5.5%), Northeast China (5.3%). Among them, the well-developed and densely-populated East China has daily access volume much more than those of other zones.
Figure 2. Zoning distribution of user access volume
3.2.3 Civic Disparities of User Access Volume:
Fig.3 shows the cities ranking in user access volume. We can easily find that the daily average access volume of Beijing is much higher than the other cities, and all of the four municipalities are among them, while Beijing, Shanghai, and Tianjin come top three stably. At the same time, the well-developed cities like Guangzhou, Hangzhou, Wenzhou, and Shenzhen rank high, and major cities in the middle part of China like Chengdu, Wuhan, Xian, Zhengzhou are also among them. Zhejiang Province contains four cities of them, Jiangsu Province contains three, and Guangdong Province contains two. These provinces are also provinces that rank high in the provincial access statistics.
Figure 3. Zoning distribution of user access volume
public transport development level, and public service development level as the five determining factors. 14 variables in total are used to explain the user access volume of Online Map, as shown in Table 1. And the explanatory variables are expressed in set X={� , � …��}.
Deter i i g Fa tor E pla ator Varia le
Area s ale city area( )
city population( )
Population quality average years of education( ) proportion of people aging 18-40 ( )
Economy GDP per apita( )
Public transport development level
passenger capacity( ) metro station numbers( ) bus station numbers( ) parking place numbers( ) gas station numbers( )
Public service development level
restaurant numbers( ) tourist spot numbers( ) hotel numbers( )
financial facility numbers( ) Table 1. Determining factors and explanatory variables of
user access volume
The user access volumes of online maps have been taken from the statistics results of Map World access logs, including the average daily access volume of 28 key cities. The 14 explanatory variables are from the CHINA CITY STATISTICAL YEARBOOK and the thematic database from the official website of Map World. We first divided these 28 cities into modeling data and verifying data equally. The sample cities of modeling are: Beijing, Shanghai, Guangzhou, Hangzhou, Chengdu, Wenzhou, Ningbo, Wuhan, Jinan, Xian, Nanjing, Chongqing, Zhengzhou, and Wuxi, and the verifying cities are: Tianjin, Shenzhen, Suzhou, Qingdao, Lanzhou, Hefei, Fuzhou, Jiaxing, Taiyuan, Nanchang, Kunming, Changsha, Xiamen, Guiyang. Then, principal component regression (PCR) is used for data modeling to explore the relationship between user access volumes of online maps and determining factors.
4.2 Determining Factor Analysis of User Access Volume
Based on PCR
Principal component regression is a method handling data with high-dimensional covariant. When the original variables are correlated, PCR can result in dimension reduction through substantially lowering the effective number. Here are the five steps when applying PCR model in our research:
1) Calculating the correlation coefficient matrix
The first step of PCR is to check the collinearity between original variables and get the correlation coefficient matrix R:
R = [
� � ��
⋱ �� �� ���]
(1)
Where p = the number of variables, here p=14;
� =the correlation coefficient between and .
According to the calculation formula proposed by Karl Pearson
� = ∑�= � −�̅̅̅(� −�̅̅̅) √∑� � −�̅̅̅
= ∑�=(� −�̅̅̅)
(2)
Where n = the number of sample data;
̅ = the mathematical expectation of ; = the value of for the kth city.
When � >0, there is positive relationship between and ; when � 00, is negatively correlated to ; when � = 0, is independent of ; when |� | > . , are highly correlated with ; when . < |� | 00.8, has a moderate correlation with . We can calculate the correlation between any variables, as shown in Table 2.
Table 2. Correlation coefficient matrix of determining factors of user access volume
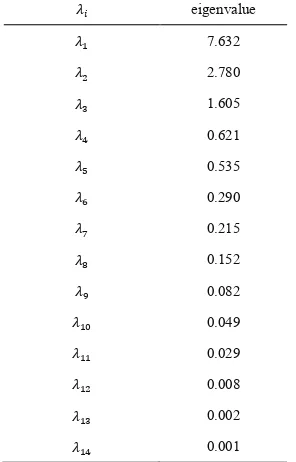
2) Calculating the eigenvalue and eigenvector
the correlation coefficient matrix R. Then calculate the eigenvalues �(i=1,2,…,14) with Jacobi method (Wang, Y.Q., &
Zhao, Z.H., 2003), and sorted them in descending order, that
means � > � > > � . Afterward, get the eigenvectors corresponding to the eigenvalues respectively(Yu, Z.W., & Yin,
Q.L., 2011).Table 3 shows the eigenvalues:
� eigenvalue
Table 3. Eigenvalues of Correlation Coefficient Matrix
3) Calculating the cumulative contribution probability of Principal Component
Where = the contribution probability of component i,
� = the cumulative contribution probability of . .
Usually, when the cumulative contribution probability reaches 85% in the mth principal component [13], we can take the first m principal components and abandon the residual component to reduce dimensionality, the result is shown in Table 4:
Principal
Table 4. Contribution probability and cumulative contribution probability of each principal component of user access volume
According to Table 4, when using 3 principal component, the cumulative contribution probability is already higher than 85%. Thus, we choose the first three principal component�, �, �
as the final principal components. And Table 5 shows the variance of the original 14 variables after the extraction of the principal components. The loss degree of all variables is small except the GDP per capita factor and population quality factor, which demonstrate that the principal component well replaces the original variables (i=1,2,…,14).
Explanatory variables Original value Extraction value
� 1.000 0.935
4) Calculating the load of each principal component Calculate the load matrix for each variable (i=1, 2… 14) in different principal component with formula 5:
� = √�� (i=1,2,3;j=1,2,3) (5)
Where � = the score that jth variable gets in the ith principal component
� = the ith eigenvalue
� = the jth component of the ith eigenvector �.
And the principal component load matrix is shown in Table 6. principal component � � �
� 0.178 0.010 0.657
� .263 .242 -0.238
� 0.307 -.292 0.070
� 0.138 0.380 -0.315
� 0.327 -.232 0.035
� 0.061 0.512 0.011
� 0.296 0.259 -0.132
� 0.317 0.121 -0.173
� 0.340 0.157 0.098
� 0.239 -0.318 -0.094
� 0.320 -0.181 0.084
� 0.081 0.360 0.570
� 0.328 0.004 -0.024
� 0.312 -0.157 -0.087
Table 6. Load of principal component of user access volume
After calculating the load matrix according to the original variables, we can get the calculation formula of each principal component as follow:
� = . ∗ + . ∗ + . ∗ + . ∗ +
. ∗ + . ∗ + . ∗ + . ∗ + . ∗
+ . ∗ + . ∗ + . ∗ + . ∗
+ . ∗ (6)
� = . ∗ + . ∗ − . ∗ + . ∗ −
. ∗ + . ∗ + . ∗ + . ∗ + . ∗
− . ∗ + . ∗ + . ∗ + . ∗
− . ∗ (7)
� = . ∗ − . ∗ + . ∗ − . ∗ +
. ∗ + . ∗ − . ∗ − . ∗ + . ∗
− . ∗ + . ∗ + . ∗ − . ∗
− . ∗ (8)
5) Multivariate regression analysis
After the dimensionality reduction and principal component extraction of the original variables, we make the user access volume as the independent variable while the 14 determining factor as the dependent variables. Combined with the formulas of F1, F2, F3, and take the data of 14 sampling cities, for linear regression, we can get the regression function of Online Map user access in a city:
Y = . + . ∗ F + . ∗ F − . ∗
F (9)
Where Y = the city user access volume of online map.
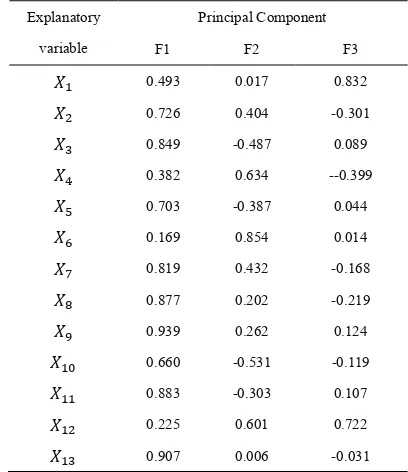
4.3 Result Analysis
Table 7 shows the composition equation of three principal components. In �, all of the explanatory variables have high explanatory coefficients except transport capacity, GDP per capita, and tourist spots. So � can reflect city scale, city transport and service development level. In � , the GDP per capita reach the maximum, reflecting the influence of economy. In �, the transport capacity and tourist spots have the highest explanatory coefficients and can reflect the circulation capacity of one city.
Explanatory variable
Principal Component
F1 F2 F3
� 0.493 0.017 0.832
� 0.726 0.404 -0.301
� 0.849 -0.487 0.089
� 0.382 0.634 --0.399
� 0.703 -0.387 0.044
� 0.169 0.854 0.014
� 0.819 0.432 -0.168
� 0.877 0.202 -0.219
� 0.939 0.262 0.124
� 0.660 -0.531 -0.119
� 0.883 -0.303 0.107
� 0.225 0.601 0.722
� 0.862 0.262 -0.110 Table 7. Composition equation of principal components of user
access volume
4.4 The Precision Analysis of PCR in the Modeling of User Access Volume
4.4.1 Evaluation method and indexes:The precision of a
model is mainly evaluated by comparing the difference between predicted value and the measured value. Two kinds of precision are considered in the analysis. The first precision is in the process of modeling. The second is the precision in a testing process. Qualified rate and deterministic coefficient are used for the evaluation of model precision. When the correlation coefficient (R2). It describes the proportion of the variation of one of the correlated variables, explainable by the variation of the other variable.
R2 = the determination coefficient, ranging from 0 to 1. The better the linear regression fits the data in comparison to the simple average, the closer the value of R2 is to 1.
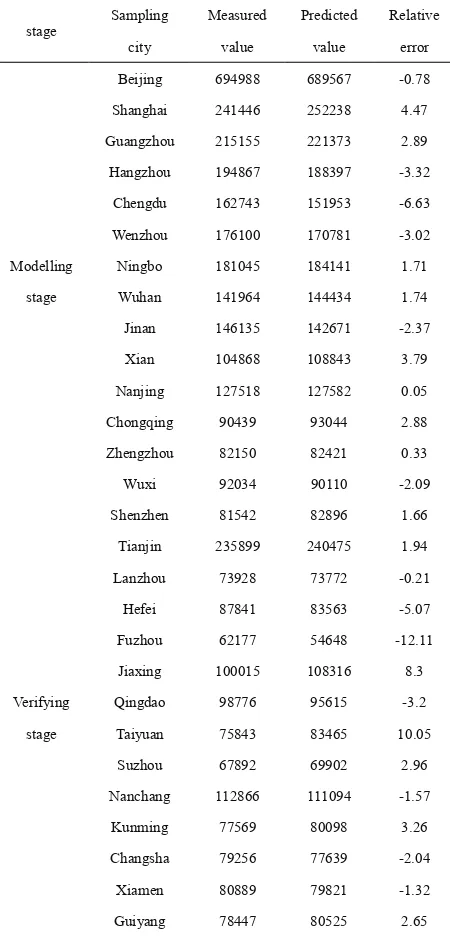
4.4.2 Model Evaluation: We calculate the qualified rate and determination coefficient for the PCR formula with the modeling data and the verifying data and get the following result shown in Table 8. The measured value refers to the actual user access volume of sampling cities, and the predicted value is the
calculated value we get with the regression model. When the relative error is positive, the predicted value is bigger than the measured value.
Table 8. Relative error of sample data in pcr of user access volume
user access volume
As is shown in Table 9, when target error rate is 20%, the qualified rate of model is 100% no matter in modeling stage or verifying stage; when target error decreases to 10%, the qualified rate of PCR model is still 100% in modelling stage, but decreases to 86.7% in verifying stage; when the target error is 5%, the qualified rate in modeling stage and verifying stage become 93.4% and 80% respectively. The determination coefficients of these two stages are 0.990 and 0.456. And we can draw the conclusion that PCR shows high precision in the modeling stage and can explain the data well, but the precision is limited in the verifying stage compared with modeling stage.
5. CONCLUSION
Online Map services are playing a more and more important role in people’s daily lives with the advancement of Internet maturity. Analyzing the regional disparities of user access volume can help the map providers better understand the geographical distribution of their users and advance the dispatch and allocation the data resources and server resources.
At first this paper introduced the regional disparities that exist in the user access volume, then established regression model based on PCR to explore the influence of the economy, population, public transport development level and so on.
In future, we are going to verify the results we find in this study with more multivariate regression methods, make a comparison between them propose a determining model with higher prediction accuracy.
ACKNOWLEDGMENTS
Authors thank National Geomatics Center of China and Map World for supporting this work. This work was supported by the National Natural Science Foundation of China (Grant No. 41371370), the Major State Research Development Program of China (Grant No.2016YFB0502301) and the LIESMARS Special Research Funding.
REFERENCES
Beilock, R., & Dimitrova, D. V., 2003. An exploratory model of inter-country internet diffusion. Telecommunications Policy,
vol.27(3–4), pp.237-252
Chen, A., Nijkamp, P., Tabuchi, T., & Dijk, J. V., 2014. Regional science research in China: spatial dynamics, disparities, and regional productivity. Papers in Regional Science, vol. 93(2),
pp.223-227
Degen Wang, & Tian Chen., 2013. Temporal-spatial change and driving mechanism for regional difference of domestic tourism in China. Chinese Journal of Population Resources & Environment, vol.11(1), pp.69-78
Han, Y., Jian-Hui, D. U., & Guo, P. F., 2011. The development of Chinese online group shopping market and its regional differences based on spss. Economic Geography, vol.31 (10),
pp.1660-1665
Hao, X., & Kay, C. S., 2004. Factors affecting Internet development: an Asian survey. First Monday, vol.9(2).
Qiu, J., & Wang, M., 2010. The temporal-spatial differences and influencing factors of internet development in China since 2000.
Areal Research & Development, vol.29(5), pp.28-32, 2010
Toyama, & Kentaro,2016. The Internet and inequality.
Communications of the ACM, vol. 59 (4), pp.28-31
Wang, P., 2012. The regional disparities of mobile phone reading and development suggestions in China. ScienceTechnology and Publication, vol.11 (1), pp.69-78
Wang, Y.Q., & Zhao, Z.H., 2003. Jacobi Iteration Method and Its Generalization. Journal of PLA University of Science and Technology (Natural Science Edition), vol.4 (5)
Wold, S., Esbensen, K., & Geladi, P., 1987. Principal component analysis. Chemometrics & Intelligent Laboratory Systems, vol.2
(1-3), pp.37-52
Xin, J.H., &D.M. Zheng, 2007. Analysis of Different Condition in Internet Infiltration in China. China Information Review, vol.2,
pp.36-38, 2007
Yu, Z.W., & Yin, Q.L., 2011. Jacobi method for eigenvalues calculation. Shandong Science, vol.24(6), pp.19-21