Summary
This study was carried out on the data obtained from 35 plot areas selected among the vertical distribution regions of maquis in study area located in Eastern Mediterranean region. The data were grouped in terms of altitude, domi-nant exposure, vegetation height, and mean age factors, and it is tried to reveal the change of maquis biomass de-pending on these factors. The data obtained shown significant variation and, for this reason, the mass values are expressed as mean values. The potential relationship between the mentioned factors and the amounts of stored bio-mass was examined by using t-test and variation analysis. The mean aboveground biobio-mass amount was found to be 24,183 ton/ha, while mean belowground biomass that doesn’t contain fine root was found to be 41,062 ton/ha. According to these results obtained from mean values, the root/shoot ratio was calculated to be 1.7.
KEY WORdS: Biomass, maquis, root/shoot ratio, altitude, exposure
EvALUATION OF THE EFFECTS OF vARIOUS
FACTORS ON ABOvEGROUNd ANd
BELOWGROUNd BIOMASS STORAGE CAPACITY
OF EASTERN MEdITERRANEAN MAQUIS
vEGETATION
PROCJEnA UČInKA RAZlIČItIH ČIMBEnIKA nA KAPACItEt
ZA SKlADIŠtEnJE nADZEMnE I PODZEMnE BIOMASE
IStOČnOMEDItERAnSKE VEGEtACIJE MAKIJE
Ali DURKAYA
1, Birsen DURKAYA
2*, Ali SABANCI
3, Sinan KAPtAN
4INTROdUCTION
UVOD
Maquis is a concept that has entered into vegetation science from the word „maquis” in Corsican language. The „shrubs, which are generally always-green and dominated by hard-leaved species, that are 2-5m in length in Mediterranean Ba-sin” are named maquis (Özalp 2000). Scrub populations called maquis have significant role in agro-silvo-pastoral
sy-stems having limited water potential, and they have also po-tential to reduce the effects of climate change by acting as a carbon pool because of their high portion within the vege-tation in places, where they spread over (Ruiz-Peinado et al. 2013). Besides being a carbon sink and containing high-le-vel of biodiversity within their structures, maquis populati-ons also serve for many traditional purposes such as provi-ding feed in animal husbandry, firewood, and hunting (Nair et al. 2009, Canteiro et al. 2011, Varol and Ertugrul 2015). 1 Assoc. Prof. Dr. Ali Durkaya, Bartn University, Faculty of Forestry, 74100 Bartn/Turkey, adurkaya@bartin.edu.tr
2 Assoc. Prof. Dr. Birsen Durkaya*, Bartn University, Faculty of Forestry, 74100 Bartn/Turkey, Corresponding Author: bdurkaya@bartin.edu.tr 3 Ali Sabanc, Bartn University, Faculty of Forestry, 74100 Bartn/Turkey lineersabanci@hotmail.com
tries), it is required to accurately determine the forest car-bon stocks (UNFCCC 2012). Hence, there is a necessity regarding the studies on determining the biomass and car-bon amounts stored in maquis.
The aim of our study is to determine the aboveground and belowground biomass storage capacities of maquis sprea-ding over Eastern Mediterranean region and to reveal the change in amount of biomass stored depending on certain vegetation and habitat conditions. Thus, it was aimed to un-derstand the biomass of maquis populations and to provide useful data.
MATERIAL ANd METHOd
MAtERIJAL I MEtODA
Study area – Područje istraživanja
This study was carried out on the data obtained from 35 plot areas located within the borders of Çamalan Forest Sub-District Directorate in Tarsus Forestry Department of Mersin Regional Forest Directorate in eastern region of Me-diterranean basin. Çamalan Forest Sub-District Directorate is located between 34° 59’ 09’’ – 34° 40’ 10’’ E and 37° 01’ 53’’ – 37° 25’ 32’’ N.
Climate data – Podaci o klimi
Study area is located within a typical Mediterranean climate region. Annual mean temperature was 16.2 °C. The lowest mean temperature in vegetation season was 13.8 °C in April, while the highest mean temperature was 33 °C in July, and the mean temperature was 19.1 °C. Annual mean precipita-tion level was 525 mm, and majority of this amount was re-ceived in vegetation season. Mean relative humidity was 60%.
Experimental data – statistical evaluation – Podaci o eksperimentu – Statistička procjena
At the beginning of this study, the natural factors that have potential to affect the biomass storage capacity of maquis vegetation were determined, and the study was designed in this parallel. These factors were divided into 4 groups, and then the subgroups were established. The sampling proce-dure was executed in the way covering these groups and subgroups, and the data were clustered in this parallel. The groups and sub-groups established are listed below:
1. Exposure: Sunny exposure, shadowy exposure; 2. Altitude:
400–600, 601–800, 801–1.000, 1.001–1.200 m; 3. Mean height of vegetation:
up to 1.5 m, 1.51–2 m, 2.1–2.5 m and 2.51-3 m; 4. Mean age: 10-20, 21-30, 31-40 and 41-50 years. In determining the plot areas, in order to ensure the stan-dard firstly, the regions, where the maquis flora covers 70% Maquis-like scrub populations covering significant portion
on earth spread over locations, where the climate conditi-ons like Mediterranean climate are dominant. These regi-ons, where the precipitation restrains the plant develo-pment, are climatic stress regions, and are located between the semi-arid regions of tropics and deserts and the tempe-rate zone. The debates on defining, classifying, and utiliza-tion of the vegetautiliza-tion type covering these large areas still continue (Özalp 2000).
The maquis regions are seen in Turkey’s regions, where the Mediterranean climate is dominant. In a study of Uslu (1985), it has been reported that there are maquis regions larger than 1 million ha in Aegean and Mediterranean re-gions. But, there is no sufficient information about the total area that they cover and the characteristics of maquis po-pulations in different regions. In order for maquis vegeta-tion to take its place in ecosystem management plans, and in order to establish the conditions and methods for susta-inable and optimum use of maquis populations, it is requ-ired to reveal their economic, ecologic, and biologic values. But, the number of scientific studies on this topic in Turkey is very limited.
Besides understanding the carbon storage and carbon cycle among the global benefits, the data regarding the woody biomass are necessary for many purposes such as determi-ning the productivity of vegetation, management of bioe-nergy sources, and estimating the flammable materials in forest fires (De-Miguel et al. 2014). Measuring the carbon is also an obligation because of the undertakings of United Nations Framework Convention on Climate Change (UN-FCCC) and the obligations originating from Kyoto Protocol (Brown 2002). The UNFCCC obliges all the participant par-ties for preparing, publishing, and regularly updating the national inventories about gas emissions having greenho-use effect and removals from land greenho-use change and forestry by using comparable methods (Houghton et al. 1997, Joo-sten et al 2004). Although it is possible to determine the aboveground biomass through remote sensing methods (Arıcak et al, 2015), forest inventory data is considered as important resource since they offer more accurate C and biomass data via local measurements and they also better represent the regional heterogeneity (Birdsey, 1992; Brown and Schroeder, 1999). On the other hand; estimating the amount of carbon stored in growing trees and harvested wood is also important, because carbon is becoming a va-lued product on the global market (McKinley et al. 2011). As specified in 25th article of Kyoto Protocol, Turkey has
become a party on 26th of August, 2009. Throughout the
processes of both of mentioned protocol and REDD +(Re-ducing emissions from deforestation and forest degradation in developing countries; and the role of forest conservation enhancement of forest carbon stocks in developing
coun-or mcoun-ore, were selected. In coun-order to reduce the slope-related errors, the study was started on the lands with 5-10% slope, and the study areas were distributed in accordance with the aim of this study (in dimensions of 10m x 10m) to various altitude, exposure and vegetation height levels. Since the fac-tor of slope is not a facfac-tor that affects the biomass sfac-torage capacity of maquis vegetation, it wasn’t involved in experi-mental design. In studies on sloping lands, it is required to determine a correction factor and recalculate the edge len-gths in order to accurately find the limits of sample plots. In order to prevent the error possibility and time loss that these calculations for each of 4 edges would lead, the sampling procedure was executed on the lands having up to 10% slope. By examining the actual statuses of the lands, firstly the alive, healthy and robust individual populations were considered. In order to determine the aboveground biomass, all of the individuals within the each plot area were clear-cut at the closest point to the soil level and the branches were weighed. Besides that, the stem sections were taken from 3-5 indivi-duals at the closest point to the soil level in order to deter-mine the age.
In order to determine the belowground biomass, the distri-bution of individuals within the plot areas; in every sam-pling point, a 2mx2m section was dug down to the bedrock, and then the roots were taken out and weighed. Fine root (thinner than 2 mm) sampling was not performed, and they were excluded from assessment.
Samples were taken from every component. Wood samples were peeled from barks, and fresh wood and bark weights were measured. In order to determine the weight of leaves, the sample branches were taken and, by separating the le-aves, the weights of leaves and branches were measured, and then compared in order to estimate the ratio. And then, the samples were taken to the laboratory and completely dried at 65±3°C temperature and their dry weights were found. Using fresh/dry weight ratios, the fresh weight values were translated into dry weight values. Although the most widely accepted method for determining the moisture content of wood is to dry in an oven at 105°C, the removal of volatile content at this temperature may lead to errors in estimating the moisture content (Rodriguez et.al. 1998, Granstrom 2003). Plant biologists generally dry the leaves and fruits at 60-70 °C, because high temperatures cause decreases in or-ganic compounds (Westerman, 1990). Cornelissen et al. (2003) have recommended drying the herbaceous stems at 60 °C for 72 hours or at s 80 °C for 48-72 hours, and exten-ded this recommendation to woody stems. Since maquis societies consists of high-level of leaves and thin material, the temperature of drying was set to 65°C in order to pre-vent any failures due to high temperature.
The analyses of data were performed in accordance with the design of study. While designing, in order to reveal the maquis’ biomass, 4 groups of samples, which were believed
to have effect on the biomass, were established, and then they were divided into sub-groups. And then, by using t-test and variance analysis, it was examined if there are dif-ferences between these sub-groups.
RESULTS
REZUltAtI
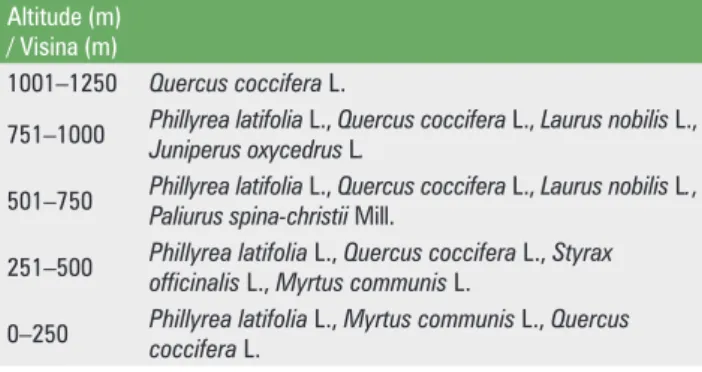
Firstly, the variation of among the altitude steps of study area, where the maquis spreads, and the ratio of participation into composition were determined. It was observed that there were significant difference between the species and the ratio of participation into composition of the components con-stituting the maquis as the altitude changed. While Quercus coccifera L. individuals were observed at all the altitudes between 488m and 1115m, Quercus coccifera L.’s ratio of par-ticipation into composition increased as the altitude incre-ased, and it became a maquis population consisting of a sin-gle species at the highest altitude level. Moreover, in and around every plot area, the Juniperus drupacea (Labill.) in-dividuals were separately observed. While Phillyrea latifolia
L. species was found to be the species that was most frequ-ently observed up to 1000m altitude, it was replaced by Qu-ercus coccifera L. at higher altitudes. In Table 1, the change of species can be seen in 250m of altitude intervals.
Although the maquis vegetation varies between 0m and 1250m altitudes throughout the study area, the populations, where the sampling could be performed, were found at 488-1155m of altitudes. 35 sample plots taken among those al-titudes were divided into 4 sub-groups, 200m each, and the amounts of biomass they stored are presented in Table 2 in mean values.
As a result of the evaluation by considering the biomass sto-rage capacities of the groups, the most significant difference was observed in root wood and root bark. While the por-tion of aboveground biomass is higher between 400m and 600m altitudes, belowground biomass was observed to be higher than aboveground biomass in all the resting sub-gro-ups. While no altitude-related difference was observed in maquis populations constituting the aboveground biomass,
Table 1. Change in species with 250m altitude interval
tablica 1. Promjena vrste s obzirom na interval od 250 m nadmorske visine
Altitude (m) / Visina (m)
1001–1250 Quercus coccifera L.
751–1000 Phillyrea latifoliaJuniperus oxycedrus L., Quercus cocciferaL. L., Laurus nobilis L.,
501–750 Phillyrea latifoliaPaliurus spina-christii L., Quercus cocciferaMill. L., Laurus nobilis L.,
251–500 Phillyrea latifoliaofficinalis L., Myrtus communis L., Quercus coccifera L. L., Styrax
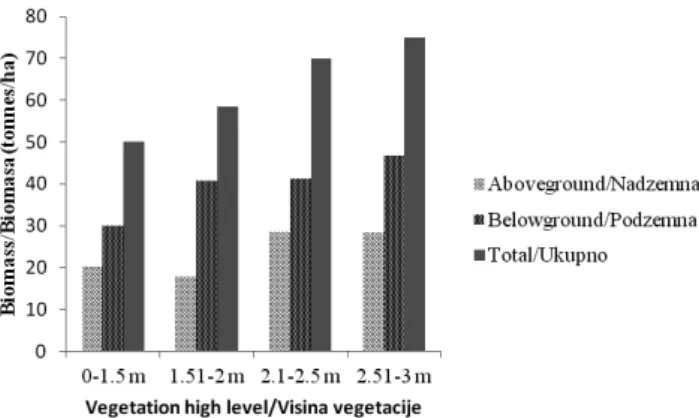
The total mean value was found to be 50.13 ton/ha in 0-1.5 m sub-group, 58.50 ton/ha in 1.51-2m sub-group, 69.98 ton/ha in 2.01-2.50m sub-group and 74.95 ton/ha 2.51-3m sub-group. The maquis component having the highest value in total was found to be root amount. It can be con-cluded that the total mean biomass amount linearly incre-ases as the length of maquis components increincre-ases. 3-5 individuals cut at the ground level on the plot areas were utilized in order to determine the ages. From these ages, the arithmetic mean value of the ages was calculated for each of the areas. From the aspect of mean age, the maquis areas were clustered under 4 groups as 10-20, 21-30, 31-40 and 41-50 ages, and the aboveground and be-lowground biomass amounts and changes were examined. There were 7 plots in 10-20 age group, 5 plots in 21-30 age group, 11 plots in 31-40 age group, and 12 plots in 41-50 age group. Arithmetic mean biomass amounts of sampling areas are presented in Table 5.
As seen in Table 5, the evaluations based on the mean age indicated that no sufficiently accurate relationship could be established between the mean vegetation age and biomass.
In order to reveal the maquis biomass, 4 groups that are thought to have effect on biomass were established, and those groups were divided into sub-groups. Then, it has a significant increase was observed in belowground biomass
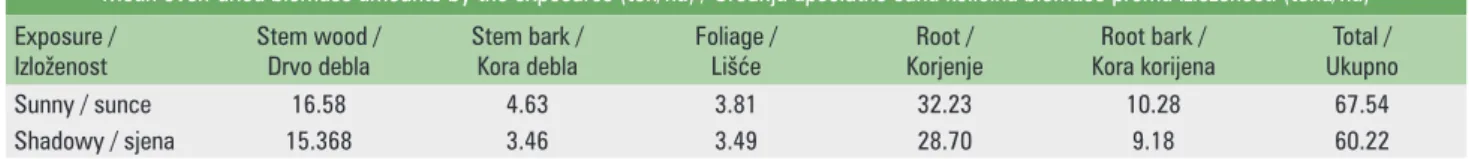
of maquis populations between 1001m and 1200 m. The factor „exposure” was taken into consideration, and the exposures were divided into sunny and shadowy exposures (northwestern, northern, northeastern, and eastern expo-sures were shadowy ones, while others were sunny exposu-res) groups, and the differences and similarities were exa-mined. 24 maquis sampling areas were clustered in sunny exposure group, while 11 areas were clustered in shadowy exposure group. In Table 3, the amounts of biomass were presented in relation with the exposure.
As seen in table and graph, given the mean values, it can be easily seen that the biomass capacity of sunny exposures were higher than that of shadowy exposures. The difference reached at 7.32 ton/ha in total.
The mean vegetation height values measured in sampling areas were divided into 4 sub-groups. The mean vegetation height was cascaded from 1.5m with 50cm interval. The sampling areas, where the mean height was lower than 1.5m, were not cascaded since the vegetation heights there were too close to1.5m. There are 4 areas in 0-1.5m range, 11 areas in 1.51-2m range, 8 areas in 2.1-2.5 m range, and 12 areas in 2.51-3 m range. Biomass storage capacities of sub-groups are presented in Table 4 in relation with maquis components.
Table 2. Mean oven-dried biomass by altitudes (ton/ha) tablica 2. Prosječna apsolutno suha biomasa (tona / ha)
Altitude (m) /
Visina (m) Stem wood / Drvo debla Stem bark / Kora debla Foliage / lišće KorijenjeRoot / Kora korijenaRoot bark / Ukupnototal /
400–600 19.15 3.69 6.52 15.56 4.86 49.79
601–800 14.11 3.43 3.20 34.21 10.93 65.90
801–1000 17.09 4.80 3.79 29.35 9.24 64.29
1001–1200 14.37 3.33 2.50 49.79 17.30 87.30
Table 3. Mean oven-dried biomass amounts by the exposures tablica 3. Srednja apsolutno suha količina biomase prema izloženosti
Mean oven-dried biomass amounts by the exposures (ton/ha) / Srednja apsolutno suha količina biomase prema izloženosti (tona/ha)
Exposure /
Izloženost Stem wood / Drvo debla Stem bark / Kora debla Foliage / lišće KorjenjeRoot / Kora korijenaRoot bark / Ukupnototal /
Sunny / sunce 16.58 4.63 3.81 32.23 10.28 67.54
Shadowy / sjena 15.368 3.46 3.49 28.70 9.18 60.22
Table 4. Mean biomass amounts by the vegetation height levels (ton/ha) tablica 4. Prosječne količine biomase prema visini vegetacije (tona / ha)
Height (m) /
Visina (m) Stem wood / Drvo debla Stem bark / Kora debla Foliage / lišće KorjenjeRoot / Kora korijenaRoot bark / Ukupnototal /
0–1.5 12.98 3.68 3.55 22.74 7.17 50.13
1.51–2 11.69 2.74 3.36 31.01 9.68 58.50
2.1–2.5 19.72 5.30 3.63 30.47 10.84 69.98
been examined, by using t-test in exposure and variance analysis, if there is any difference between these sub-groups. t-test results for exposure factor are presented in Table 6. As it can be seen, since the Sig. (p) values of t-test were p>0.05, H0 hypothesis is accepted. In other words, „there is
no statistically significant difference between 2 different ex-posure groups and aboveground, belowground, and total amount of biomass.“
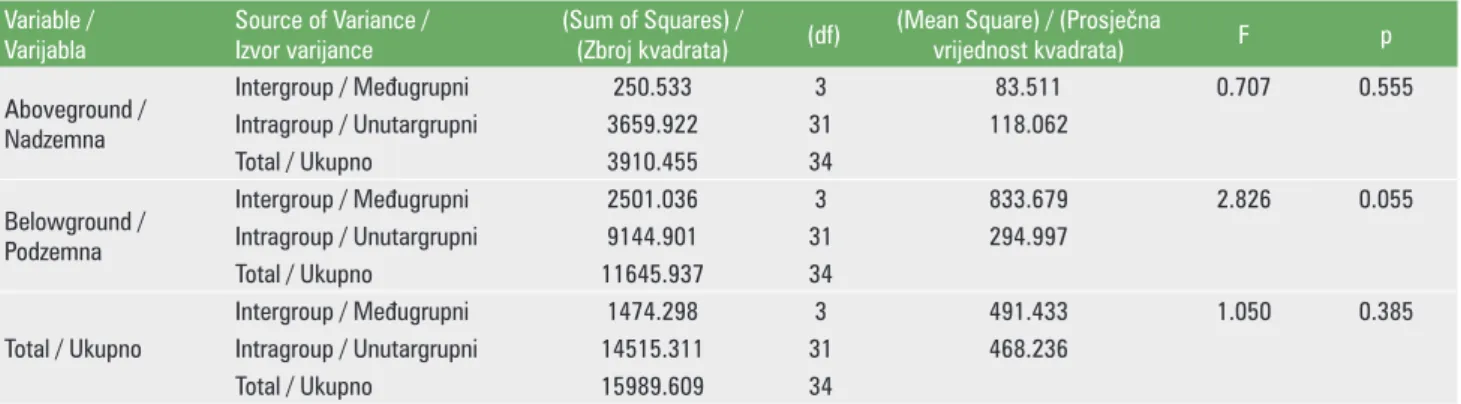
The plot areas having different altitudes were clustered into 4 groups as 400-600m, 601-800m, 801-1000m and 1001-1200m. The similarities and differences between altitude groups and aboveground, belowground, and total biomass were examined by using independent sample one-way va-riance analysis (ANOVA). Since the significance value (Sig. p) of the table presenting the results obtained from analyses was higher than 0.05, it was concluded that there was no statistically significant difference between altitude level and mentioned variables (Table 7).
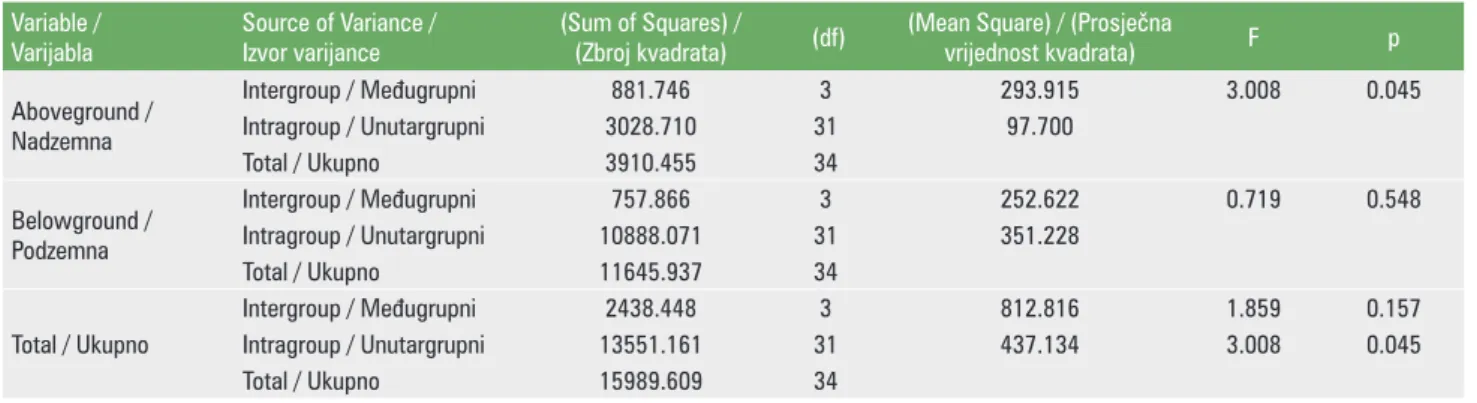
The similarities and differences between the subgroups created based on mean vegetation height and the above-ground, belowabove-ground, and total biomass were examined by using independent sample one-way variance analysis (ANOVA). Since the significance value (Sig. p) of the ta-ble presenting the results obtained from analyses was hi-gher than 0.05, it was concluded that there was no stati-stically significant difference between top height and relevant variables (Table 8).
By calculating the mean ages from the stem sections of maquis components cut at the ground level in sampling areas, 4 groups (10-20, 21-30, 31-40 and 41-50 ages) were established. Since the significance value (Sig. p) of the table presenting the results obtained from analyses was higher than 0.05, it was concluded that there was no statistically significant difference between age groups and mentioned variables (Table 9).
Table 5. Oven-dried maquis biomass by the age factor (ton/ha)
tablica 5. Apsolutno suha biomasa makije prema faktoru starosti (tona / ha)
Age(years) /
Starost (godine) Stem wood / Drvo debla Stem bark / Kora debla Foliage / lišće KorjenjeRoot / Kora korijenaRoot bark / Ukupnototal /
10–20 12.00 2.44 3.75 34.09 10.19 62.49
21–30 12.16 2.69 2.92 24.45 6.70 48.96
31–40 17.90 4.97 3.53 36.85 11.99 75.25
41–50 18.77 5.34 4.17 26.90 9.25 64.45
Table 6. t-test (Independent Samples test) results for exposure factor
tablica 6. Rezultati t-testa (test za nezavisne uzorke) za faktor izloženosti
Variable /
Varijabla Variance distribution / Distribucija varijance
levene’s test for Variance
Equality / Levenov test za homogenost varijance
t-test for Variance
Equality / t-test za homogenost varijance
F Sig. t
Aboveground / Nadzemna
Equal variance distribution / Jednolika distribucija varijance 2.015 0.165 0.687 Non-equal variance distribution / Nejednolika distribucija varijance 0.744 Belowground /
Podzemna
Equal variance distribution / Jednolika distribucija varijance 0.566 0.457 0.681 Non-equal variance distribution / Nejednolika distribucija varijance 0.761 total / Ukupno Equal variance distribution / Jednolika distribucija varijance 2.082 0.158 0.926 Non-equal variance distribution / Nejednolika distribucija varijance 1.050
Table 7. AnOVA results for altitude groups
tablica 7. Rezultati programa ANOVA za skupne prema visini
Variable /
Varijabla Source of Variance /Izvor varijance (Sum of Squares) / (Zbroj kvadrata) (df) (Mean Square) / (Prosječna vrijednost kvadrata) F p
Aboveground / Nadzemna Intergroup / Međugrupni 250.533 3 83.511 0.707 0.555 Intragroup / Unutargrupni 3659.922 31 118.062 total / Ukupno 3910.455 34 Belowground / Podzemna Intergroup / Međugrupni 2501.036 3 833.679 2.826 0.055 Intragroup / Unutargrupni 9144.901 31 294.997 total / Ukupno 11645.937 34 total / Ukupno Intergroup / Međugrupni 1474.298 3 491.433 1.050 0.385 Intragroup / Unutargrupni 14515.311 31 468.236 total / Ukupno 15989.609 34
dISCUSSION
RASPRAVA
In this study, which was carried out in order to determine the aboveground and belowground biomass amounts of maquis lands within the borders of Çamalan Forest Sub-Dis-trict Directorate in Tarsus Forestry Department of Mersin Regional Forest Directorate in eastern region of Mediterra-nean basin, the evaluations were performed based on the data obtained from 35 sampling areas in terms of the factors of altitude, exposure, mean vegetation height, and mean age. Moreover, it was also statistically examined if there is a rela-tion between stored biomass and relevant factors. As it can be seen in results and graphs presented in „Findings” sec-tion, maquis biomass values have a very wide variation and no high-grade statistically significant relationship can be established between the maquis biomass values.
According to the data obtained in our study, the mean abo-veground biomass amount was found to be 24,183 ton/ha. Moreover, it was determined that the belowground biomass contains approximately 41,062 ton/ha of root. Of the total fresh biomass amount, approximately 63.98% consists of dry matter. This value is higher than that of Taurus cedar (0.51) and Calabrian pine (0.61) sharing the same habitat (Durkaya et al, 2013, Durkaya et al., 2015). McPherson et al. (1994), by reviewing the literature, have found it appro-priate to converse the fresh biomass into dry biomass by
multiplying with 0.56 for broadleaved species and with 0.48 for coniferous species. As it can be seen, the maquis com-ponents conversion coefficient is also higher than 7.98%, which has been projected for the broadleaved species. In accordance with the obtained results, the root/shoot ra-tio was found to be 1.7. The interesting point here is the re-dundancy of belowground biomass amount. As well as this situation can be explained with the harmony with habitat having low humidity, it can also be correlated with the use of aboveground portion for purposes of feeding animals and using as energy source by humans.
While the mean aboveground biomass in maquis scrubland dominated by Quercus coccifera was found to be 20.21 ton/ ha in our study, Sağlam et al. (2008) have determined the total flammable matter biomass in maquis population in Aegean region, where Quercus coccifera L., the dominant species, have mean vegetation height of 0.53-1.30 m, to vary between 7 and 67.4 ton/ha. Canadel and Roda (1991) have found the aboveground and belowground biomass of Qu-ercus ilex populations to be 160 ton/ha and 63 ton/ha, res-pectively. It can be seen that there are significant differences between the biomass amounts of not only the different maquis populations but also the similar maquis populati-ons. These differences can be attributed to the genetic fac-tors, crown closure, the species in composition and their portions, habitat conditions, and human interventions.
Table 8. AnOVA results for mean vegetation heights
tablica 8. Rezultati programa ANOVA za prosječne visine vegetacije
Variable /
Varijabla Source of Variance / Izvor varijance (Sum of Squares) / (Zbroj kvadrata) (df) (Mean Square) / (Prosječna vrijednost kvadrata) F p
Aboveground / Nadzemna Intergroup / Međugrupni 881.746 3 293.915 3.008 0.045 Intragroup / Unutargrupni 3028.710 31 97.700 total / Ukupno 3910.455 34 Belowground / Podzemna Intergroup / Međugrupni 757.866 3 252.622 0.719 0.548 Intragroup / Unutargrupni 10888.071 31 351.228 total / Ukupno 11645.937 34 total / Ukupno Intergroup / Međugrupni 2438.448 3 812.816 1.859 0.157 Intragroup / Unutargrupni 13551.161 31 437.134 3.008 0.045 total / Ukupno 15989.609 34
Table 9. AnOVA results for mean vegetation age
tablica 9. Rezultati programa ANOVA za prosječnu starost vegetacije
Variable /
Varijabla Source of Variance / Izvor varijance (Sum of Squares) / (Zbroj kvadrata) (df) (Mean Square) / (Prosječna vrijednost kvadrata) F p
Aboveground / Nadzemna Intergroup / Međugrupni 711.364 3 237.121 2.298 0.097 Intragroup / Unutargrupni 3199.091 31 103.196 total / Ukupno 3910.455 34 Belowground / Podzemna Intergroup 1516.496 3 505.499 1.547 0.222 Intragroup 10129.442 31 326.756 total / Ukupno 11645.937 34 total / Ukupno Intergroup / Međugrupni 2489.087 3 829.696 1.905 0.149 Intragroup / Unutargrupni 13500.522 31 435.501 total / Ukupno 15989.609 34
Marziliano et al. (2015) have reported, for Phillyrea latifolia
individuals, that9.15% of biomass is stored in leaves, 50.24% in aboveground, and 40.6% in belowground. Mean root/ shoot ratio was found to be 0.68. In a study that has been carried out in Portugal, the root/shoot ratio of Mediterranean woody plants has been determined (40 scrubs from 18 spe-cies) to vary between 3.7 (Arbutus unedo) and 0.1 (Cystus multiflorus) (Silva and Rego, 2004). In our study, the root/ shoot ratio was found to be 1.698. In our study, while the do-minant species up to 1000 m altitude was Phillyrea latifolia
L., it is attention-grabbing that the root/shoot ratios differed significantly from those found by Marziliano et al. (2015). In studies on determining the portion of foliage within the aboveground biomass of Phillyrea latifolia;Armand et al. (1993) have found that ratio to be 27% in France, Marzili-ano et al. (2015) found it to be 15% in Italy and Topic et al. (2009) found it to be 7% in Croatia. In our study, this value varied between 12.6% and 18.9%. The studies that have been carried out on areas, where the P. latifolia is the dominant species, revealed that even the same species shows wide va-riation in different habitats.
In general, it was observed that the sunny exposures had more biomass. A linear relation was observed between the mean vegetation height and mean biomass. It can be con-cluded that the mean age and altitude values are indepen-dent from biomass. The graphical relation observed between exposure and vegetation height levels and biomass values were found to be nonsignificant in statistical assessments (figure 1).
The reason of that is the wide variation shown by the data obtained from plot areas. On the other hand, correlating the subsequent studies on determining the maquis biomass with the mean vegetation heights is the most acceptable approach.
CONCLUSIONS
ZAKlJUČCI
In Eastern Mediterranean region, which is our study area, maquis constitutes 2.7% of the vegetation as of the year 2007,
while it is expected to increase to 14% in 2070s due to the climate change (Tamai et al., 2007). Despite its important potential, there is not enough study on maquis populations. Considering the habitats, where the maquis vegetation spre-ads over, it is seen that those lands are stony-rocky, where the absolute soil depth is very low. It is very difficult to esta-blish any production forests on these lands, and it is even impossible on some locations. The maquis populations grown under these conditions retain significant amount of biomass and also carbon in their aboveground and below-ground organs. When compared, the Taurus cedar, which is one of the main dominant species of the region, retains 136-326 ton/ha aboveground biomass at 100th age according to
site classes, while Calabrian pine retains 89-169 ton/ha (Dur-kaya et al, 2013, Dur(Dur-kaya et al., 2015). In our study, the mean aboveground biomass storage was found to be 24.183 ton/ ha at relatively less ages in maquis scrubland. The biomass storage capacity of maquis at locations, where it is very dif-ficult and even impossible to establish effective production forests, is attention-grabbing.
Besides being a carbon sink and containing high-level of biodiversity within their structures, maquis populations also serve for many traditional purposes such as providing feed in animal husbandry, firewood, and hunting. It is very likely that these utilizations will continue in future. In order to su-stain the maquis, which are exposed to multidirectional and even excessive use, and to maintain their benefits, it is ne-cessary to know the maquis scrublands and to establish the protection-usage balance via the obtained data. In establis-hing the protection-utilization balance, especially replacing the rural population’s use for energy purposes with the use of logging residues would be an efficient solution (Eker, 2014, Alkan et al. 2014). The most important problem here is that the maquis scrublands involve significant variations even in short distances. For this reason, carrying out the studies on maquis vegetation should be within narrow areas in order to achieve more reliable results.
REFERENCES
LItERAtURA
• Alkan, H., M. Korkmaz, M. Eker, 2014:Stakeholders’
Perspec-tives on Utilization of Logging Residues for Bioenergy in Turkey. Croat.J.For.Eng. 35/2: 153-165.
• Arıcak, B., A. Bulut, A.O. Altunel, O.E. Sakıcı, 2015: Estimating
Above Ground Carbon Biomass Using Satellite Image Reflection Values: A Case Study in Camyazi Forest Directorate, Turkey. Sumarski List, 7-8:369-376.
• Armand, D., M. Etienne, C. Legrand, J. Marechal, J.C. Valette,
1993: Phytovolume, phytomasse et relations structurales chez quelques arbustes méditerranéens [Phytovolume, phytomass and
structural relationships of certain Mediterranean shrubs]. Annals
For Science, 50: 79–89.
• Birdsey, R. A. 1992: Carbon Storage and Accumulation in United
States Forest Ecosystems, USDA For Serv. Gen Tech. Rep/ WO-59, p. 51.
Figure 1. Mean biomass amounts by the vegetation height levels Slika 1. Srednje količine biomase prema visini vegetacije
Sažetak
Ovo je istraživanje provedeno pomoću podataka dobivenih iz 35 područja određenih vertikalnom distribuc-ijom prostora makije na istraživanom području smještenom u regiji istočnog Sredozemlja. Podaci su grupirani prema visini, dominantnoj izloženosti, visini vegetacije I prosječnoj starosti, te su se promatrale promjene na biomasi makije ovisno o tim faktorima. Dobiveni podaci pokazuju značajne varijacije te su iz tog razloga uku-pne vrijednosti prikazane kao prosječne vrijednosti. Potencijalni odnos između spomenutih čimbenika i količine skladištene biomase provjeren je pomoću t-testa i analize varijacije. Prosječna vrijednost količine nadzemne biomase bila je 24.183 tona/ha, dok je prosječna vrijednost podzemne biomase, bez finog korijenja, bila je 41.062 tona/ha. S obzirom na rezultate dobivene iz prosječnih vrijednosti, omjer suhe mase nadzem-nih organa i korijena iznosio je 1,7.
KLJUČNE RIJEČI: Biomasa, makija, omjer suhe mase nadzemnih organa i korijena, visina, izloženost
• Brown, S. 2002: Measuring carbon in forests: current status and
future challenges. Environmental Pollution, 116, 363-372.
• Brown, S. L., P. E. Schroeder, 1999: ‘Spatial patterns of
above-ground production and mortality of wood biomass for eastern U.S. Forests’, Ecol. Appl. 9(3), 968–980.
• Canadell, J., F. Roda, 1991: Root biomass of Quercus ilex in a
montane Mediterranean forest. Canadian Journal Of Forest
Re-search, 21(12):1771-1778.
• Canteiro, C., C. Pinto-Cruz, M. Simões, L. Gazarini, 2011:
Con-servation of Mediterranean oak woodlands: understory
dynam-ics under different shrub management. Agroforestry Systems 82,
161e171.
• Cornelissen, J. H. C, S. Lavorel, E. Garnier, S. Diaz, N. Buchmann,
D. E. Gurvich, P. B. Reich, 2003: A handbook of protocols stand-ardisation and easy measurement of plant functional traits
world-wide. Australian Journal of Botany 51: 335-380.
• De Miguel, S., L. Mehtatalo, A. Durkaya, 2014: Developing
gen-eralized, calibratable, mixed-effects meta-models for large-scale
biomass predictions. Can.J.For.Res. 44:648-656.
• Durkaya. A.,B. Durkaya, E. Makineci, İ. Orhan, 2015:
Above-ground biomass and carbon storage relationship of Turkish pines, Fresenius Environmental Bulletin. 24 (11): 3573-3583.
• Durkaya, B.,A. Durkaya, E.Makineci, M. Ülküdür, 2013:
Esti-mation of above-ground biomass and sequestered carbon of
Tau-rus cedar (Cedrus libani L.) in Antalya, Turkey,
iForest-Biogeo-sciences and Forestry. 6: 278-284.
• Eker, M. 2014: Trends in Woody Biomass Utilization in Turkish
Forestry. Croat.J.For.Eng. 35/2: 255-270.
• Granstrom K. 2003: Emissions of monoterpenes and VOCs
dur-ing drydur-ingof sawdust in a spouted bed. Forest Products
Jour-nal,53(10):48–55.
• Houghton, J.T., L.G. Meira Filho, B. Lim, K. Treanton, I. Mamaty,
Y. Bonduki, D.J. Griggs, B.A. Callander, 1997: Revised 1996 Guidelines for National Greenhouse Gas Inventories. IPCC/ OECD/IEA.
• Joosten, R., J. Schumacher, W. Christian, A. Schulte, 2004:
Eval-uating tree carbon predictions for beech (Fagus sylvatica L.) in
western Germany. Forest ecology and management, 189, 87-96.
• Marziliano, P.A., R. Lafortezza, U. Medicamento, L. Lorusso, V.
Giannico, G. Colangelo, G. Sanesi, 2015: Estimating
below-ground biomass and root/shoot ratio of Phillyrea latifolia L. in
the Mediterranean forest landscapes. Annals of Forest Science, 72:
585–593.
• McKinley, D.C., M.G. Ryan, R.A. Birdsey, C.P. Giardina, L.S.
Health, R.A. Houghton, R.B. Jackson, J.F. Morrison, B.C. Mur-ray, D.E. Pataki, K.E. Skog, 2011: A synthesis of curresnt
knowl-edge on forests and carbon storage in the United States.
Ecologi-cal Applications, 21 (6): 1902-1924.
• McPherson, E.G., D.J. Nowak, R.A. Rowntree, 1994: Chicago’s
Urban Forest Ecosystem: Results of the Chicago Urban Forest Climate Project. USDA Forest Service General Technical Report NE-186, Radnor, PA, pp.83-94.
• Nair P.K.R., B.M. Kumar, V.D. Nair, 2009: Agroforestry as a
strat-egy for carbon sequestration. Journal of Plant Nutrition and Soil Science 172, 10-23.
• Özalp, G. 2000: Sert yapraklı ormanlar ve maki. İÜ Orman Fak.
Dergisi, Seri A, 50 (2): 131-155.
• Rodriguez PG, K. Annamalai, J. Sweeten, 1998: The effect of
dry-ing on the heatdry-ing value of biomass fuels. Transactions of the
ASAE, 41(4):1083–7.
• Ruiz-Peinado R, G. Moreno, E. Juarez, G. Montero, S. Roig, 2013:
The contribution of two common shrub species to aboveground
and belowground carbon stock in Iberian dehesas. Journal of
Arid Environments, 91: 22-30.
• Sağlam B, Ö. Küçük, E. Bilgili, B. Dinç Durmaz, İ. Baysal, 2008:
Estimating fuel biomass of some shrub species (maquis) in
Tur-key. Turkish Journal of Agriculture and Forestry, 32: 349-356.
• Silva JS, F.C. Rego, 2004: Root to shoot relationships in
Mediter-ranean woody plants from Central Portugal. Biologia, 59 (13):
1-7.
• Tamai, S., K. Kato, Y. Kishibe, M. Ando, J. Sano, 2007: Effect of
climate changes on the species composition and productivity of plant communities in the eastern Mediterranean region of Tur-key. In: The Final Report of the Research Project on the Impact of Climate Changes on Agricultural Production System in Arid Areas (ICCAP). Research Institute for Humanity and Nature (RIHN) of Japan, and The Scientific and Technological Research Council of Turkey (TUBITAK), ICCAP Pub. No 10 (ISBN 4-902325-09-8), Kyoto, Japan, pp. 103-110.
• Topić, V., L. Butorac, G. Jelić, 2009: Biomass in strawberry tree
coppice forests (Arbutus unedo L.) on Island Brač. Izvorni
Znan-stveni Članci, 133:5–14.
• UNFCCC, 2012: The Cancun Agreements. New York, NY:UN.
• Uslu, T. 1985: A Plant Ecological and Sociological Research on
the Vegetation of the Area Between Küçük and Büyük Menderes
Rivers at the West of Aydın.Gazi Üniversitesi. Fen-Edebiyat
Fakültesi Yayın No:8, Ankara.174 pp.
• Varol, T., M. Ertugrul, 2015: Climate change and Forest Fire
Trend in the Aegean and Mediterranean Regions of Turkey.
Fre-senius Environmental Bulletin. 24 (10b): 3436-3444.
• Westerman, R. L. 1990. Soil testing and plant analysis, 3rd ed..