PENGEMBANGAN PETA ZONASI GEMPA
PENGEMBANGAN PETA ZONASI GEMPA
INDONESIA DAN REKOMENDASI PARAMETER
INDONESIA DAN REKOMENDASI PARAMETER
DESAIN SEISMIK DENGAN ANALISIS BAHAYA
DESAIN SEISMIK DENGAN ANALISIS BAHAYA
GEMPA PROBABILISTIK TERINTEGRASI
GEMPA PROBABILISTIK TERINTEGRASI
(PULAU SUMATRA, JAWA DAN NUSA TENGGARA)
(PULAU SUMATRA, JAWA DAN NUSA TENGGARA)
Disiapkan Untuk:
KEMENTERIAN NEGARA RISET DAN TEKNOLOGI
Disiapkan Oleh:
Koordinator: Dr. I Wayan Sengara,
Anggota: Prof. Dr. Widiadnyana Merati, Dr. Masyhur Irsyam
Dr. Danny Hilman Natawidjaja, Ir. Engkon Kertapati, Prof. Dr. Sri Widiantoro,
Dr. Wahyu Triyoso, Dr. Irwan Meilano
Asisten: P. Sumiartha, MT, Hendarto MT, Mudrik Daryono, MT, Ir. KM.
Aburoyroch, In In Wahdiny, MT; Zulfarizka, ST; Oktavia Dewi, ST
Disampaikan dalam Workshop:
Peta Zonasi Gempa Indonesia Terpadu Dalam Membangun Kesiapsiagaan Masyarakat
Jakarta, 21 Juli 2009
OUTLINE PRESENTASI
1.ȱLingkupȱKegiatan
1.ȱLingkupȱKegiatan
2.ȱReviewȱStudiȬStudiȱSebelumnyaȱ
2.ȱReviewȱStudiȬStudiȱSebelumnyaȱ
3.ȱMetodologiȱPSHA
3.ȱMetodologiȱPSHA
4.ȱHasilȱPSHA
4.ȱHasilȱPSHA
5.ȱRekomendasi
5.ȱRekomendasi
LINGKUP KAJIAN
a. Melakukan review terhadap studi-studi bahaya gempabumi
yang telah dilaksanakan.
a. Melaksanakan analisis detail bahaya gempabumi
probabilistik (PSHA) dan memperoleh spectra bahaya yang
seragan (
Uniform Hazard Spectra
- UHS) atau target spectra
untuk lokasi-lokasi di Indonesia untuk
Periode Ulang 475
dan 2475 tahun.
a. Menyiapkan peta zonasi gempa Wilayah Sumatra, Jawa,
Nusa Tenggara dan rekomendasi parameter desain
gempabumi atau
Spektra Disain
untuk perbaikan dari zonasi
kegempaan serta kode bangunan yang saat ini ada.
Seismicity of Indonesia and Scope of
Seismic Zonation
Team Member:
Koordinator: Dr. I Wayan Sengara (Geotechnical Earthquake Engineering)
No
Name and Academic Degree
Field
1.
2.
3.
4
5.
6.
7.
8.
9.
10
11.
Prof. Widiadnyana Merati
Dr. Masyhur Irsyam
Ir. Engkon Kertapati
Dr. Danny H.Natawidjaja
Dr. Wahyu Triyoso
Prof. Sri Widiantoro
Dr. Irwan Meilano
Hendarto, MT
P. Sumiartha, MT
Mudrik Daryono, MT
KM Aburoyroch, ST; In In
Wahdiny, MT; Zulfarizka, ST;
Oktavia Dewi, ST
Earthquake Engineering
Geotech. Earthquake Engineering
Earthquake Geology
Plate/Crustal Mapping
Seismicity (Recurrence)
Seismicity (Tomography)
Crustal Deformation
Probabilistic Analyst
Probabilistic Analyst
Assistant Crustal Mapping
Assistants
Summary on Development of Indonesian
Seismic Zonation
Before the year of 2002, Indonesia seismic zonation was
based on 10% PE in 25 years (200 years RP).
In 2002, SNI-03-1726-2002 officially released. Zonation
is based on 10% PE in 50 years (475 years RP), T=0
sec = PBA. Referring to UBC 1997.
Recent efforts toward development of seismic zonation
for 475 years, T=PBA, T=0.2 (short period) and 1.0 sec
(long period). Also mapping for 2% PE in 50 years (2475
years RP), referring to IBC 2006.
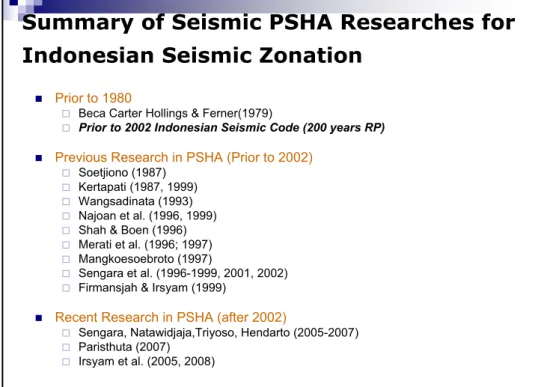
Summary of Seismic PSHA Researches for
Indonesian Seismic Zonation
Prior to 1980
Beca Carter Hollings & Ferner(1979)
Prior to 2002 Indonesian Seismic Code (200 years RP)
Previous Research in PSHA (Prior to 2002)
Soetjiono (1987)
Kertapati (1987, 1999)
Wangsadinata (1993)
Najoan et al. (1996, 1999)
Shah & Boen (1996)
Merati et al. (1996; 1997)
Mangkoesoebroto (1997)
Sengara et al. (1996-1999, 2001, 2002)
Firmansjah & Irsyam (1999)
Recent Research in PSHA (after 2002)
Sengara, Natawidjaja,Triyoso, Hendarto (2005-2007)
Paristhuta (2007)
Irsyam et al. (2005, 2008)
ILUSTRASI SEISMIC WAVE PROPAGATION
UNTUK ESTIMASI PEAK GROUND ACCELERATION
Subduction
Subduction
Ground Surface
Ground Surface
BaseRock
BaseRock
Site
Site
R
R
2a
Magnitude M
Magnitude M
1
2b
3
Ca Tc Cp To P erc epa ta n S p ek tr a l Perioda (detik)Design Response Spectra
For Design of Structures
SSRA
PSHA
T
long periodUniform Hazard Spectra Periode Ulang 475 Tahun
0.00 0.10 0.20 0.30 0.40 0.50 0.60 0.70 0.80 0 0.5 1 1.5 2 2.5 3 3.5 4 Periode (detik) PB A ( g )
T
short periodHistorical &
Instrumental
Earthquake Catalog
Geology and Tectonics
Macroseismic Intensity
& Strong Motion
Records
2. SOURCE ZONES
Faults
Area Sources
Type of Faults
Tomography
1. SEISMICITY
Historic Recurrence Rate
Geologic Recurrence Rate
Maximum Magnitude
3. ATTENUATION
Peak Acceleration (PGA)
Acceleration Spectra (PSA)
SEISMOTECTONIC MODEL
4. LOGIC TREE
Alternate Models
Parameter Uncertainty
Relative Likelihood
Expert Judgment
Next page
Seismic Hazard Methodology
4. GEODETIC CRUSTAL
DEFORMATION
Slip-rate information from
GPS Monitoring
Continued
5. HAZARD ANALYSIS (PSHA)
Hazard Curves
Uniform Hazard Spectra (UHS)
Confidence Limits
6. DEAGGREGATION
Design Earthquakes
Bedrock Time Histories
7. SITE RESPONSE
Soil Amplification
Site-Specific Time Histories
Natural Period of
Structures
Geotechnical Data
Return Period of
Design Event
Judgment
Generic Seismic
Design Criteria
Site-Specific
Seismic Design
Criteria
METODOLOGI
PROBABILISTIC SEISMIC HAZARD ANALYSIS
Digunakan Total Probability Theorem: PBA tergantung Magnitude
(M) dan hypocenter (r) sebagai
continuous independent random
variables,
dinyatakan dengan:
H (a) = ¦ v
i³³ P[A > a¨m, r] g
Mi(m) g
Ri¨Mi(r,m)drdm
dimana :
• H(a) :
annual frequency
dari gempa bumi yang menghasilkan ground motion
Amplituda A > a.
• v
i: adalah
annual rate
pada area sumber I
(dengan magnitude lebih besar dari suatu nilai Moi tertentu) pada luasan sumber I
•
g
Mi(m) dan
g
Ri¨Mi(r,m) fungsi-fungsi kerapatan probabilitas untuk masing-masing
magnitude dan jarak .
• P[A > a¨m, r probabilitas dari suatu gempa dengan magnidude m pada jarak r yang
menghasilkan PBA A lebih besar dari a
METODOLOGI PSHA
a. Earthquake Data/Catalog Collection
b. Earthquake Source Zoning
c. Use of appropriate Attenuation Functions
d. Recurrence Models
e. Ground Motion Characteristics
EZ-Frisk Computer Program
(Risk Engineering, 2004)
EZ-Frisk Computer Program
(Risk Engineering, 2009)
PSHA PROCESS
PSHA PROCESS
Compile necessary information as required to perform the PSHA, which
include :
Regional geological and tectonic-setting, identification and mapping of
subduction and active shallow crustal faults
Collect seismicity data (historical and instrumental data, Relocated)
Use seismic tomography to help identify geometry of the source zones
Compile the crustal deformation from GPS monitoring data to identify slip rates
of source zones (subduction and shallow crustal faults).
Develop seismic source zones for input to PSHA
Review and utilization of some appropriate attenuation functions for the
specific seismic sources.
Perform probabilistic seismic hazard analysis, which include determination
of PBA associated with its probabilities.
TEKTONIK SETING DAN PEMETAAN PATAHAN AKTIF
Map of the principal tectonic
elements of the indonesian plate
boundary,
Ref: [Engkon K. Kertapati, 2000]
SEISMIC TOMOGRAPHY
SEISMIC TOMOGRAPHY
DAN RELOKASI HIPOCENTER
DAN RELOKASI HIPOCENTER
Sri Widiyantoro, 2008
-2%
+2%
lambat
cepat
aÆ a’ b Æ b’ eÆ e’ cÆ c’ d Æ d’A-A
E-E
C-C
D-D
B-B
Ref: [Sriwidiantoro, 2009]
GEODETIC GPS MONITORING FOR CRUSTAL DEFORMATION INFORMATION
ANALISIS DATA DAN HASIL
PSHA SUMATRA-JAWA-NUSA
TENGGARA
SEISMIC TOMOGRAPGHY DAN RELOKASI HIPOCENTRAL
SEISMIC TOMOGRAPGHY DAN RELOKASI HIPOCENTRAL
ZONA SUMATRA
ZONA SUMATRA
Sri Widiyantoro, 2008
-2%
+2%
lambat
cepat
aÆ a’ b Æ b’ eÆ e’ cÆ c’ d Æ d’A-A
E-E
C-C
D-D
B-B
Ref: [Sriwidiantoro, 2009]
95 95 100 100 105 105 110 110 115 115 120 120 125 125 130 130 135 135 140 140 -15 -15 -10 -10 -5 -5 0 0 5 5 10 10 15 15
Subduction
Sumatra Fault Zone
102 201 301 302 401 402 501 502 601 602 701 702 801 802 901 902 101 202 95 95 100 100 105 105 110 110 115 115 120 120 125 125 130 130 135 135 140 140 -15 --10 --5 -0 0 5 5 10 1 15 1
MODEL SUMBER
GEMPABUMI ZONA
SUMATRA
SEISMIK TOMOGRAPGHY DAN RELOKASI HIPOCENTRAL
SEISMIK TOMOGRAPGHY DAN RELOKASI HIPOCENTRAL
ZONA JAWA BARAT, PULAU JAWA
ZONA JAWA BARAT, PULAU JAWA
Sri Widiyantoro, 2008
-2%
+2%
lambat
cepat
A
B
C
D
DISTRIBUSI HIPOSENTRAL PADA SEGMEN C-C
ZONA JAWA BARAT, PULAU JAWA
Dip Angle = 16
oDip Angle = 61
o 19A 19B 5K 4B4C 5A5B 4F 4D4E 2425 5J 5I 5H 5G 5F5D 5E 5C 23 6C 6A 6B 6D 21 6E6F6G 7 8 99B 14 17 22 10 11E11D11C 12D12C 12B12A 11B11A 181321 13 15 16Potongan Melintang C-C
C
C
RANGKUMAN SUDUT SUBDUKSI ZONA
JAWA – NUSA TENGGARA
Penampang
Sudut
Subduksi
dangkal (
0)
Sudut Subduksi
dangkal (
0)
I – I’
22
58
J – J’
19
61
K – K’
21
63
L – L’
30
65
M – M’
21
59
N – N’
22
54
O – O’
17
47
P – P’
21
55
Q – Q’
16
49
R – R’
16
44
Penampang
Sudut
Subduksi
dangkal (
0)
Sudut Subduksi
dangkal (
0)
A – A’
21
55
B – B’
21
55
C – C’
20
59
D – D’
21
53
E – E’
22
56
F – F’
22
56
G – G’
17
42
H – H’
13
48
MODEL SUMBER GEMPA BUMI ZONA JAWA-NTT
19A 19B 5K 4B 4C 5A5B 4F 4D 4E 24 25 5J 5I 5H 5G 5F 5D 5E 5C 5C 6C 6A 6B 6D 21 6E 6F 6G 7 8 99B 14 17 22 10 11E 11D11C 12D 12C 12B 12A 11B11A 18 1321 13 15 16 (7) BANDUNG JAKARTA YOGYAKARTA 19A 19B 5K 4B 4C 5A 5B 4F 4D 4E 24 25 5J 5I 5H 5G 5F 5D 5E 5C 5C 6C 6A 6B 6D 21 6E6F 6G 7 8 9 9B 14 17 22 10 11E 11D11C 12D 12C 12B 12A 11B11A 1321 13 15 16 YOGYAKARTA BANDUNG JAKARTA DENPASARr DENPASARSlip Rate
Slip-rate For Lembang Fault
Ref: [Irwan Meilano, 2009]
EARTHQUAKE RECURRENCE MODEL
1.
Least Square Method
2.
Weichert
3.
Kijko & Sellevol Method
Log N = a – bM
Kelemahan dari metoda LS dalam penentuan parameter a-b
adalah metoda ini tidak memperhitungkan kemungkinan
digunakannya gabungan data dari sumber-sumber yang
berbeda, misalnya data dari sejarah kegempaan yang
digabungkan dengan data dari informasi geologi. Nilai b yang
didapat dengan menggunakan metoda ini juga umumnya
overestimated
yang mengakibatkan rate dari gempa-gempa besar
akan underestimated.
Least Square Method (Gutenberg & Richter, 1954)
Eksponensial Model
Characteristic Recurrence Model
(Schwartz and Coppersmith, 1984 adopted in EZFrisk, Risk Engineering, 2004)
Characteristic Magnitudes
Exponential Magnitudes
• Selain pendekatan geologi, diadopsi juga “Statistical Method”
MAGNITUDA MAKSIMUM
Good Method 1 a M_max according to Kijko-Sellevoll (APPROX.) M_max according to Least Square Method (LS) b M_max according to Normal Distribution (L1)
2 a Uncertain, Incomplete, Doubtful seismic M_max according to Tate-Pisarenko data M_max according to Kijko-Sellevoll (EXACT)
M_max according to Kijko-Sellevoll-Bayes
M_max according to Robson-Whitlock (not provide a guarantee) M_max according to Robson-Whitlock-Cooke
M_max [Based on 5 largest magnitudes]
3 a M_max according to Non-Parametric with Gaussian Kernel Procedure M_max according to Non-Parametric Procedure based on Order Statistics b M_max according to Tate-Pisarenko-Bayes Procedure
c Presence of characteristic events Temporal Trend
Parameters of the assume distribution functions are known without error. Magnitude distribution properly describes the observations
The empirical distributions of earthquake magnitudes are of bi- or multi-modal character
The log-frequency-magnitude relation has a strong non-linear component
Attenuation Data Base
in EZ-Frisk, 2009
Abrahamson-Silva (1997)
Al-Tarazi & Qadan (1997)
Ambraseys et al. (1996)
Amrat (1996)
Atkinson (1997)
Atkinson - Boore (2003)
Atkinson - Motazedian (2003)
Atkinson-Silva (2000)
Atkinson-Sonley (2000)
Boore - Joyner - Fumal (1997)
Bray 2002
Campbell (1997)
Campbell - Bozorgnia (2003)
Crouse (1991)
Frankel (1996)
Fukushima-Tanaka (1992)
Gregor (2002)
Huo-Hu (1992)
Idriss (1993)
Joyner-Boore (1981)
Malkawi-Fahmi (1996)
Martin (1990)
Sabetta-Pugliese (1996)
Sadigh et al. (1997)
Silva (1999)
Silva et al. (2002)
Somerville (2001)
Spudich (1997/99)
Toro et al. (1999)
Idriss (2004)
Youngs (1997)
Boore and Atkinson (2007).. [NGA]
Chiou and Youngs (2007).. [NGA]
Campbell - Bozorgnia (2008) [NGA]
FUNGSI ATTENUASI
For Subduction Mechanism
Youngs et al. (1997)
ln (y) = 0.2418 + 1.414 .M + C
1
+ C
2
(10 – M)
3
+ C
3
ln(r
rup
+
1.7818e
0.554M
) + 0.00607.H + 0.3846.Z
T
For Shallow Crustal Fault
Idriss (2008) NGA
Campbell-Bozorgnia (2008) NGA
Boore-Atkinson (2008) NGA
LOGIC TREE……
PATAHAN DANGKAL SUBDUKSI KARAKTERISTIK Youngs (1997) Interface Rock Youngs (1997) Interface Rock KARAKTERISTIK EKSPONENSIAL Idriss (2008) NGA Boore-Atkinson (2008) NGA Campbell-Bozorgnia (2008) NGA Least SquareKijko And Sellevol
Weichert M.max M.max + 0.25 M.max - 0.25 M.max M.max + 0.25 M.max - 0.25 M.max M.max + 0.25 M.max - 0.25
MODEL FUNGSI ATTENUASI RECURRENCE RATE MAGNITUDA MAXIMUM
[ 1.0 ] [ 0.7 ] [ 0.3 ] [ 0.33 ] [ 0.33 ] [ 0.33 ] [ 0.5 ] [ 0.2 ] [ 0.3 ] [ 0.6 ] [ 0.1 ] [ 0.3 ] [ 0.6 ] [ 0.1 ] [ 0.3 ] [ 0.6 ] [ 0.1 ] [ 0.3 ]
GRAFIK RECURRENCE RELATIONSHIP
SEGMEN BENGKULU, SUMATERA
0.00001 0.0001 0.001 0.01 0.1 1 10 5.0 5.5 6.0 6.5 7.0 7.5 8.0 8.5 9.0 Magnitude N( M > m o ) Data Least Square Weichert KS 0.00001 0.0001 0.001 0.01 0.1 1 10 5.0 5.5 6.0 6.5 7.0 7.5 8.0 Magnitude N( M > m o ) Data Least Square Weichert KS
Benioff
Megathrust
GRAFIK RECURRENCE RELATIONSHIP
SEGMEN JAWA BARAT
0.00001 0.0001 0.001 0.01 0.1 1 10 100 5.0 5.5 6.0 6.5 7.0 7.5 8.0 8.5 9.0 Magnitude N( M > m o ) Data Least Square Weichert KS
Benioff
0.00001 0.0001 0.001 0.01 0.1 1 10 100 5.0 5.5 6.0 6.5 7.0 7.5 8.0 8.5 9.0Magnitude
N(
M>
mo
)
Data Least Square Weichert KSMegathrust
RECURRENCE PARAMETER ZONA SUBDUKSI SUMATRA
b-value b rate b-value b rate b-value b rateIntraslab B1 Andaman Active 0.845 1.945 0.106 0.968 2.229 0.139 0.899 2.072 0.170 Aceh Active 0.845 1.945 0.295 0.968 2.229 0.451 0.899 2.072 0.504 Nias Active 0.845 1.945 0.195 0.968 2.229 0.300 0.899 2.072 0.313 Intraslab B2 Batu Active 1.034 2.380 0.193 0.912 2.099 0.184 0.560 1.290 0.163 Mentawai Active 1.034 2.380 0.454 0.912 2.099 0.496 0.560 1.290 0.487 Intraslab B3 Bengkulu Active 0.993 2.288 0.705 0.604 1.392 0.583 0.624 1.436 0.440 Sunda Active 0.993 2.288 0.540 0.604 1.392 0.437 0.624 1.436 0.330 Intraslab B4
West Java Active 0.658 1.514 0.334 0.722 1.663 0.342 0.683 1.573 0.254 Central Java Active 0.658 1.514 0.136 0.722 1.663 0.138 0.683 1.573 0.103
Weichert
Source Zone fault
activity
Least Square Kijko Sellevol
Subduks
i Zona
Megathrust
Sumatra
b-value b rate b-value b rate b-value b rate
Interface M 1 Andaman Active 0.974 2.242 0.724 0.702 1.617 0.551 0.656 1.510 0.433 Aceh Active 0.974 2.242 0.549 0.702 1.617 0.485 0.656 1.510 0.399 Nias Active 0.974 2.242 0.317 0.702 1.617 0.274 0.656 1.510 0.224 Interface M 2 Batu Active 0.748 1.723 0.362 0.565 1.300 0.276 0.560 1.290 0.186 Mentawai Active 0.748 1.723 0.715 0.565 1.300 0.684 0.560 1.290 0.464 Interface M 3 Bengkulu Active 0.671 1.545 0.992 0.543 1.250 0.851 0.576 1.327 0.607 Sunda Active 0.671 1.545 0.286 0.543 1.250 0.259 0.576 1.327 0.183 Interface M 4
West Java Active 0.667 1.537 0.332 0.723 1.664 0.343 0.726 1.671 0.295 Central Java Active 0.667 1.537 0.145 0.723 1.664 0.147 0.726 1.671 0.127
Weichert
Source Zone fault
activity
Least Square K ijko Sellevol
Subduks
i Zona
Benoff
Sumatra
Mmax, b-value, rate Pada Segmen-Segmen Utama
No Segment Slip rate L Mw Mm/year km 1 Sunda 5 150 7.6 2 Semangko 5 65 7.2 3 Kumering 11 150 7.6 4 Manna 11 85 7.3 5 Musi 11 70 7.2 6 Ketaun 11 85 7.3 7 Dikit 11 60 7.2 8 Siulak 23 70 7.2 9 Suliti 23 95 7.4 10 Sumani 23 60 7.2 11 Sianok 23 90 7.3 12 Sumpur 23 35 6.9 13 Barumun 4 125 7.5 14 Angkola 19 160 7.6 15 Toru 24 95 7.4 16 Renun 27 220 7.8 17 Tripa 27 180 7.7 18 Aceh 2 200 7.7 19 Seulimeum 13 120 7.5 b-value b rate
Sumatra Fault Zone
Aceh Fault Active 0.682 1.571 0.045 Seumeluem Fault Active 0.682 1.571 0.045 Tripa Fault Active 0.682 1.571 0.058 Renun Fault Active 0.682 1.571 0.051 Toru Fault Active 0.682 1.571 0.043 Barumun Fault Active 0.682 1.571 0.038 Angkola Fault Active 0.682 1.571 0.019 Sumpur Fault Active 0.682 1.571 0.019 Sianok Fault Active 0.682 1.571 0.001 Sumani Fault Active 0.682 1.571 0.001 Suliti Fault Active 0.682 1.571 0.043 Siulak Fault Active 0.682 1.571 0.076 Dikit Fault Active 0.682 1.571 0.043 Ketaun Fault Active 0.682 1.571 0.108 Musi Fault Active 0.682 1.571 0.049 Manna Fault Active 0.682 1.571 0.039 Kumering Fault Active 0.682 1.571 0.063 Semangko Fault Active 0.682 1.571 0.058 Sunda Fault Active 0.682 1.571 0.043
Source Zone fault activity
Least Square
Perhitungan Berdasarkan Rumusan Wells & Coppersmith
Jabar Jateng Jatim Bali-Lombok Sumba Flores Timor
1 M_max according to Kijko-Sellevoll (APPROX.) 7.59 6.70 7.41 7.01 7.33 6.88 7.08
2 M_max according to Kijko-Sellevoll (EXACT) 7.59 6.70 7.41 7.01 7.33 6.88 7.08
3 M_max according to Tate-Pisarenko-Bayes 7.63 6.73 7.41 7.04 7.34 6.88 7.08
4 M_max according to Kijko-Sellevoll-Bayes 7.53 6.70 7.39 7.00 7.30 6.86 7.06
5 M_max according to Robson-Whitlock 7.70 6.47 7.21 7.27 7.46 6.87 6.91
6 M_max according to Robson-Whitlock-Cooke 7.50 6.53 7.26 7.05 7.30 6.86 6.96
7 M_max [Integral(N-P-Gaussian Kernel CDF)^nr_eq] 7.60 6.66 7.40 7.00 7.31 6.88 7.07
8 M_max [Integral(Order Statistics CDF)^nr_eq] 7.49 6.57 7.29 7.01 7.28 6.92 6.98
9 M_max [Based on 5 largest magnitudes] 7.51 6.62 7.34 6.98 7.26 6.89 7.01
10 Max Magnitude m_max (Norm L1) 7.02 6.66 7.04 6.92 7.08 6.67 6.68
Avearage 7.52 6.63 7.32 7.03 7.30 6.86 6.99
No Benioff Zone M.Max ( Mw )
Jabar Jateng Jatim Bali-Lombok Sumba Flores Timor
1 M_max according to Kijko-Sellevoll (APPROX.) 8.00 7.15 8.03 7.30 8.02 7.54 7.99
2 M_max according to Kijko-Sellevoll (EXACT) 8.00 7.15 8.03 7.30 8.01 7.54 7.99
3 M_max according to Tate-Pisarenko-Bayes 8.10 7.28 8.04 7.31 8.01 7.62 8.05
4 M_max according to Kijko-Sellevoll-Bayes 7.91 7.13 8.02 7.28 7.99 7.50 7.95
5 M_max according to Robson-Whitlock 8.60 7.39 7.94 7.46 7.97 8.42 7.80
6 M_max according to Robson-Whitlock-Cooke 8.10 7.11 7.95 7.30 7.95 7.80 7.75
7 M_max [Integral(N-P-Gaussian Kernel CDF)^nr_eq] 8.20 7.00 8.04 7.34 8.05 7.78 8.08
8 M_max [Integral(Order Statistics CDF)^nr_eq] 8.00 7.06 7.96 7.28 7.98 7.66 7.89
9 M_max [Based on 5 largest magnitudes] 8.00 7.03 7.99 7.24 8.00 7.59 7.95
10 Max Magnitude m_max (Norm L1) 7.16 7.03 7.04 7.17 7.04 7.18 8.98
Avearage 8.01 7.13 7.90 7.30 7.90 7.66 8.04
No Mega Thrust Zone M.Max ( Mw )
PERKIRAAN NILAI Mmax DENGAN MENGGUNAKAN
METODA STATISTIK
Reff :
Different Techniques For estimation of the Maximum arthquake Magnitude mmax By : Andrzej KIJKO
Aon-Benfield Natural Hazard Centre, 2009
HASIL ANALISA
PENJELASAN HASIL PSHA
Pada kajian PSHA ini dibuat dua alternatif model, yaitu :
• Model Pertama dikembangkan dengan menggunakan model
patahan ault yang terindentifikasi dengan baik (well
defined)
+ sumber gempa background,
• Model Kedua dikembangkan dengan cara mengaktifkan
keseluruhan patahan yang teridentifikasi dengan
baik ditambah dengan patahan yang dicurigai memiliki
keaktifan karena beberapa ciri fisik dan karakteristik seismik yang
memberikan indikasi keaktifannya.
**) Catatan : Zonasi Pulau Sumatra, Jawa dan Nusa Tenggara dilakukan untuk Perioda Ulang 475
tahun dan 2475 tahun, masing-masing untuk T=PBA, T=0,2detik, dan T=1,0 detik
95 95 100 100 105 105 110 110 115 115 120 120 125 125 130 130 135 135 140 140 -15 -15 -10 -10 -5 -5 0 0 5 5 10 10 15 15 102 201 301 302 401 402 501 502 601 602 701 702 801 802 901 902 101 202 95 95 100 100 105 105 110 110 115 115 120 120 125 125 130 130 135 135 140 140 -15 --10 --5 -0 0 5 5 10 1 15 1
HASIL PSHA
WILAYAH KAJIAN PULAU SUMATRA
Hasil Makrozonasi Pulau Sumatra yang
menunjukkan nilai percepatan gempa di
batuan dasar (T=PBA) untuk periode
ulang gempa 475 tahun
Sumber Gempa
Subduction
Suber Gempa
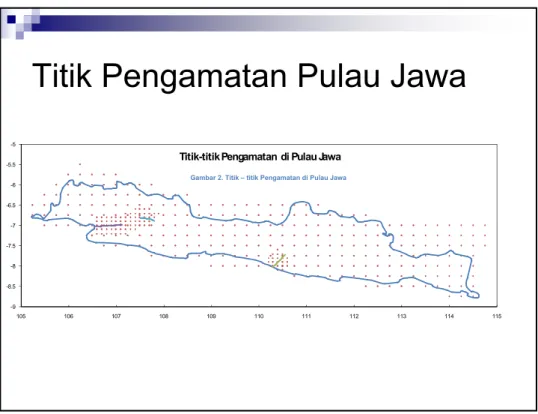
Titik Pengamatan Pulau Jawa
-9 -8.5 -8 -7.5 -7 -6.5 -6 -5.5 -5 105 106 107 108 109 110 111 112 113 114 115Titik-titik Pengamatan di Pulau Jawa
Gambar 2. Titik – titik Pengamatan di Pulau Jawa
Hasil Makrozonasi Pulau Jawa yang menunjukkan nilai percepatan gempa di batuan dasar
(T=PGA) untuk periode ulang gempa 475 tahun, Hasil pengembangan model 1
HASIL PSHA
Hasil Makrozonasi Pulau Jawa yang menunjukkan nilai percepatan gempa di batuan dasar
(T=0.2 detik) untuk periode ulang gempa 475 tahun, Hasil pengembangan model 1
HASIL PSHA
WILAYAH KAJIAN PULAU JAWA
Hasil Makrozonasi Pulau Jawa yang menunjukkan nilai percepatan gempa di batuan dasar
(T=1 detik) untuk periode ulang gempa 475 tahun, Hasil pengembangan model 1
HASIL PSHA
Hasil Makrozonasi Pulau Jawa yang menunjukkan nilai percepatan gempa di batuan dasar
(T= PGA) untuk periode ulang gempa 475 tahun, Hasil pengembangan model 2
HASIL PSHA
WILAYAH KAJIAN PULAU JAWA
Hasil makrozonasi Nusa Tenggara yang menunjukkan nilai percepatan gempa di batuan
dasar (T=PBA) untuk periode ulang gempa 475 tahun, Hasil pengembangan Model 1
HASIL PSHA
Hasil makrozonasi Nusa Tenggara yang menunjukkan nilai percepatan gempa di batuan
dasar (T=0.2 detik) untuk periode ulang gempa 475 tahun, Hasil pengembangan Model 1
HASIL PSHA
WILAYAH KAJIAN BALI-NUSA TENGGARA
Hasil makrozonasi Nusa Tenggara yang menunjukkan nilai percepatan gempa di batuan
dasar (T=1 detik) untuk periode ulang gempa 475 tahun, Hasil pengembangan Model 1
HASIL PSHA
HASIL PSHA KOTA BESAR PULAU
SUMATRA, JAWA-NUSATENGGARA
BANDA ACEH
Mean UHS Kota Aceh Untuk Periode Ulang 475, 975 dan 2475 Tahun Koordinat Lokasi PBA (g’s) 475 tahun 2475 tahun Aceh 0.34 0.42 0 0.2 0.4 0.6 0.8 1 1.2 1.4 1.6 1.8 2 0 0.4 0.8 1.2 1.6 2 2.4 2.8 3.2 3.6 4 Spectral Period (s)
Mean for 2475-year Return Period Mean for 975-year Return Period Mean for 475-year Return Period
BANDA ACEH
Nilai Hazard Dari Sumber-Sumber Gempa Subduksi Dan Shallow Crustal Intraslab Untuk Tingkat Annual Frequency of Exceedance
Tertentu Yang Mempengaruhi Kota Aceh Pada T=PGA
1E-10 1E-09 1E-08 1E-07 1E-06 1E-05 1E-04 1E-03 1E-02 1E-01 1E+00 0.00001 0.00010 0.00100 0.01000 0.10000 1.00000 10.00000
Peak Ground Acceleration, (g)
Total Hazard Aceh Andaman A Nias A Aceh Andaman C Nias C Renun F_C Renun F_E Tripa F_C Tripa F_E Aceh F_C Aceh F_E Seulimeum F_C Seulimeum F_E Batee F_C All Other Sources
Period = PGA
Hazard by Seismic Source
Period: PGA Amplitude: 0.33848 Hazard: 0.00211047 Mean Magnitude: 7.28 Mean Distance: 82.65 Magnitude-Distance Deaggregation
PADANG
Mean UHS Kota Padang Untuk Periode Ulang 475, 975 dan 2475 Tahun
0 0.2 0.4 0.6 0.8 1 1.2 1.4 1.6 1.8 2 0 0.4 0.8 1.2 1.6 2 2.4 2.8 3.2 3.6 4 Spectral Period (s)
Mean for 2475-year Return Period Mean for 975-year Return Period Mean for 475-year Return Period
Uniform Hazard Spectra
Nama Kota
PBA (g’s) 475 tahun 2475 tahun
PADANG
Nilai Hazard Dari Sumber-Sumber Gempa Subduksi Dan Shallow Crustal Intraslab Untuk Tingkat Annual Frequency of Exceedance
Tertentu Yang Mempengaruhi Kota Padang Pada T=PGA
1E-10 1E-09 1E-08 1E-07 1E-06 1E-05 1E-04 1E-03 1E-02 1E-01 1E+00 0.00001 0.00010 0.00100 0.01000 0.10000 1.00000 10.00000
Peak Ground Acceleration, (g)
Total Hazard Nias A Batu A Mentawai A Enggano A Nias B Batu B Mentawai B Nias C Batu C Mentawai C Enggano C Siulak F_E Suliti F_C Suliti F_E Sumani F_C Sianok F_C Sumpur F_C Toru F_E All Other Sources
Period = PGA
Hazard by Seismic Source
Period: PGA Amplitude: 0.38064 Hazard: 0.00307993 Mean Magnitude: 7.91 Mean Distance: 77.35 Magnitude-Distance Deaggregation
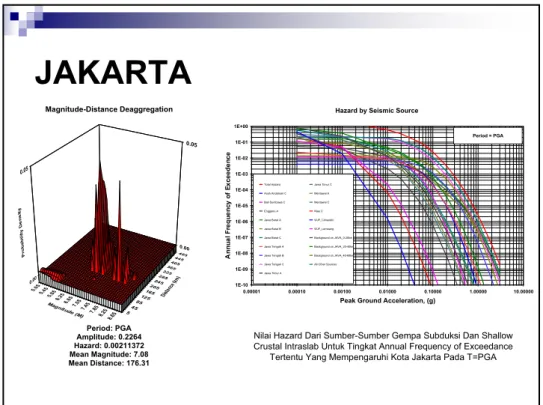
JAKARTA
Nama Kota PBA (g’s) 475 tahun 2475 tahun Jakarta 0.22 0.276 0 0.1 0.2 0.3 0.4 0.5 0.6 0.7 0.8 0.9 1 0 0.4 0.8 1.2 1.6 2 2.4 2.8 3.2 3.6 4 Spectral Period (s)Mean for 2475-year Return Period Mean for 975-year Return Period Mean for 475-year Return Period
Uniform Hazard Spectra
JAKARTA
Period: PGA Amplitude: 0.2264 Hazard: 0.00211372 Mean Magnitude: 7.08 Mean Distance: 176.31 Magnitude-Distance Deaggregation 1E-10 1E-09 1E-08 1E-07 1E-06 1E-05 1E-04 1E-03 1E-02 1E-01 1E+00 0.00001 0.00010 0.00100 0.01000 0.10000 1.00000 10.00000Peak Ground Acceleration, (g) Total Hazard Aceh Andaman C Bali Sumbawa C Enggano A Jawa Barat A Jawa Barat B Jawa Barat C Jawa Tengah A Jawa Tengah B Jawa Tengah C Jawa Timur A Jawa Timur C Mentawai A Mentawai C Nias C WJF_Cimandiri WJF_Lembang Background on JAVA_0-20km Background on JAVA_20-40km Background on JAVA_40-60km All Other Sources
Period = PGA
Hazard by Seismic Source
Nilai Hazard Dari Sumber-Sumber Gempa Subduksi Dan Shallow Crustal Intraslab Untuk Tingkat Annual Frequency of Exceedance
Tertentu Yang Mempengaruhi Kota Jakarta Pada T=PGA
REKOMENDASI NILAI SPEKTRAL UNTUK
KOTA JAKARTA (10% PE in 50 years)
Tabel 3 Nilai percepatan spektral batuan dasar Kota Jakarta
Level Hazard
T=PGA
(g)
T=0.2 detik
(g)
T=1.0 detik
(g)
10 % PE dalam 50 tahun
0.22 0.51 0.21
BANDUNG
Mean UHS Kota Bandung Untuk Periode Ulang 475, 975 dan 2475 Tahun Nama Kota PBA (g’s) 475 tahun 2475 tahun Bandung 0.33 0.41 0 0.2 0.4 0.6 0.8 1 1.2 1.4 1.6 1.8 2 0 0.4 0.8 1.2 1.6 2 2.4 2.8 3.2 3.6 4 Spectral Period (s)
Mean for 2475-year Return Period Mean for 975-year Return Period Mean for 475-year Return Period
Uniform Hazard Spectra
BANDUNG
Nilai Hazard Dari Sumber-Sumber Gempa Subduksi Dan Shallow Crustal Intraslab Untuk Tingkat Annual Frequency of Exceedance
Tertentu Yang Mempengaruhi Kota Bandung Pada T=PGA
1E-10 1E-09 1E-08 1E-07 1E-06 1E-05 1E-04 1E-03 1E-02 1E-01 1E+00 0.00001 0.00010 0.00100 0.01000 0.10000 1.00000 10.00000
Peak Ground Acceleration, (g) Total Hazard Bali Sumbawa A Bali Sumbawa C Enggano A Jawa Barat A Jawa Barat B Jawa Barat C Jawa Tengah A Jawa Tengah B Jawa Tengah C Jawa Timur A Jawa Timur C Mentawai A Mentawai C WJF_Cimandiri WJF_Lembang Background on JAVA_0-20km Background on JAVA_20-40km Background on JAVA_40-60km All Other Sources
Period = PGA
Hazard by Seismic Source
Period: PGA Amplitude: 0.33281 Hazard: 0.00214692 Mean Magnitude: 6.63 Mean Distance: 57.10 Magnitude-Distance Deaggregation
DENPASAR
Mean UHS Kota Denpasar Untuk Periode Ulang 475, 975 dan 2475 Tahun Nama Kota
PBA (g’s)
475 tahun 2475 tahun
Denpasar 0.26 0.31
DENPASAR
Nilai Hazard Dari Sumber-Sumber Gempa Subduksi Dan Shallow Crustal Intraslab Untuk Tingkat Annual Frequency of Exceedance
T i m i k a T e m b a g a p u r a M e r a u k e W a m e n a K a i m a n a T a n g g u h F a k f a k M a n o k w a r i S o r o n g J a y a p u r a
KAJIAN AWAL UNTUK ZONASI PULAU IRIAN
1 - 1 a 1 - 1 b 1 - 2 a 1 - 2 b 4 - 1 3 - 1 3 - 2 3 - 3 3 - 4 3 - 5 7 - 2 b 7 - 2 a8 b 8 a 7 - 1 a 7 - 1 b 6 - 3 6 - 2 6 - 1 4 - 2 5 2 a 2 b S F Z RF Z Y F Z T A F Z Aru Tren ch Se ram Trough Aru Trou gh MTFB N ew G uin e a Tre nch
Model Sumber gempa zonasi
Pulau Irian
(Sengara, Kertapati, Delitriana, 2003)
Hasil makrozonasi Irian yang menunjukkan nilai percepatan
gempa di batuan dasar (T=PGA) untuk periode ulang gempa
475 tahun (Sengara, Kertapati, Delitriana, 2003)
DRAFT PETA ZONASI SELURUH INDONESIA
140°0'0"E 140°0'0"E 135°0'0"E 135°0'0"E 130°0'0"E 130°0'0"E 125°0'0"E 125°0'0"E 120°0'0"E 120°0'0"E 115°0'0"E 115°0'0"E 110°0'0"E 110°0'0"E 105°0'0"E 105°0'0"E 100°0'0"E 100°0'0"E 95°0'0"E 95°0'0"E 10 °0 '0 "N 10 °0 '0 "N 5 °0'0"N 5°0'0"N 0° 0 '0" 0° 0 '0" 5°0'0"S 5°0'0"S 10 °0 '0 "S 10 °0 '0 "S Legend PGA (g) 0.000- 0.050 0.051 - 0.100 0.101 - 0.150 0.151 - 0.200 0.201 - 0.250 0.251 - 0.300 0.301 - 0.350 0.351 - 0.400 0.401 - 0.450 0.451 - 0.500 0.501 - 0.550 0.551 - 0.800
:
0 250 500 1,000 1,500 KilometersUniform Building Codes (UBC97)
International Building Codes (IBC-2006
)
Site Class Soil Profile Name s
v ft/sc (m/s) N-SPT u s psf (kPa) SA Hard rock >5000( >1500) - - SB Rock 2500 < vsd 5000 (760 < vsd 1500) - - SC
Very dense soil and soft rock
1200 < vsd 2500 (360 < vsd 760)
> 50 > 2000 (> 100)
SD Stiff soil profile
600 dvsd 1200 (180 dvsd 360) 15< N d 50 1000 d sud 2000 (50 d sud 100) s v < 600 (vs< 180) < 15 < 1000 (< 50)
SE Soft soil profile Any profile with more than 10 feet of soil having the
following characteristics:
PI>20, wnt 40% dan Su < 500 psf (< 25 kPa)
SF
-Any profile containing soil having one or more of the following characteristics:
1. Soil vulnerable to potential or collapse under seismic loading such as liquefiable soils, quick and highly sensitive clay, collapsible weakly cemented soils.
2. Peats and/or highly organic clays (H > 10 feet of peat and/or highly organic clay).
3. Very high plasticity clays (H > 25 feet with plasticity index PI > 75).
4. Very thick soft/medium stiff clays (H > 120 feet)
In IBC 2006:
S
MS= F
ax
S
S=> S
DS= 2/3 x S
MSS
M1= F
vx
S
1=> S
Dl= 2/3 x S
M1F
aat 0.2 second (for short period)
F
vat 1 second (for long period)
Design Response Spectra in UBC97
Usulan Design Response Spectra untuk SNI Baru
Site Class Soil Profile Name
s v ft/sc (m/s) N-SPT u s psf (kPa) SA Hard rock >5000( >1500) - - SB Rock 2500 < vsd 5000 (760 < vsd 1500) - - SC
Very dense soil and soft rock
1200 < vsd 2500
(360 < vsd 760)
> 50 > 2000 (> 100) SD Stiff soil profile
600dvsd 1200 (180 dvsd 360) 15< N d 50 1000 d sud 2000 (50 d sud 100) s v < 600 (vs< 180) < 15 < 1000 (< 50) SE Soft soil profile Any profile with more than 10 feet of soil having the
following characteristics:
PI>20, wnt 40% dan Su < 500 psf (< 25 kPa)
SF
-Any profile containing soil having one or more of the following characteristics:
1. Soil vulnerable to potential or collapse under seismic loading such as liquefiable soils, quick and highly sensitive clay, collapsible weakly cemented soils.
2. Peats and/or highly organic clays (H > 10 feet of peat and/or highly organic clay). 3. Very high plasticity clays (H > 25 feet with
plasticity index PI > 75).
4. Very thick soft/medium stiff clays (H > 120 feet)