Degree Programme of Computer Science and Engineering
Patrik Nis´en
Implementation of a timeline analysis
software for digital forensic
investigations
Master’s Thesis Espoo, March 4, 2013
Supervisor: Professor Tuomas Aura
Degree Programme of Computer Science and Engineering MASTER’S THESIS Author: Patrik Nis´en
Title:
Implementation of a timeline analysis software for digital forensic investigations
Date: March 4, 2013 Pages: 77
Professorship: Data Communication Software Code: T-110 Supervisor: Professor Tuomas Aura
Instructor: Antti Nuopponen M.Sc. (Tech.)
Organizations today are trying to manage the many risks they percieve to be threatening the security of their valuable information assets, but often these risks realize into security incidents. Managing risks proactively is important, but equally important and challenging is to efficiently respond to the incidents that have already occurred, to minimize their impact on business processes. A part of managing security incidents is the technical analysis of any related computer systems, also known as digital forensic investigations. As a result of collecting evidence such as log files from these systems, the analysts end up with large amounts of data, which can form a timeline of events. These events describe different actions performed on the system in question. Analysing the timelines to find any events of interest is challenging due to the vast amount of data available on modern systems. The goal of this thesis is to create a software program to support the analysis of very large timelines as a part of digital forensic investigations.
As a result, we have implemented a software with an efficient query interface, which supports iterative exploration of the data and more complex analytical queries. Furthermore, we use a timeline visualization to compactly represent dif-ferent properties of the data, which enables analysts to detect potential anomalies in an efficient way. This software also serves as a platform for future work, to experiment with more automated analysis techniques.
We evaluated the software in a case study, in which it proved to show a great level of flexibility and performance compared to more traditional ways of working. Keywords: digital forensics, incident management, information security,
databases, visualization Language: English
Tietotekniikan tutkinto-ohjelma TIIVISTELM ¨A Tekij¨a: Patrik Nis´en
Ty¨on nimi:
Aikajanojen analysointiohjelmiston toteutus tietoturvapoikkeamien tutkintaan P¨aiv¨ays: 4. maaliskuuta 2013 Sivum¨a¨ar¨a: 77
Professuuri: Tietoliikenneohjelmistot Koodi: T-110 Valvoja: Professori Tuomas Aura
Ohjaaja: Diplomi-insin¨o¨ori Antti Nuopponen
T¨arke¨a osa nykyp¨aiv¨an organisaatioiden riskienhallintaa on tietop¨a¨aoman turvaa-miseen liittyvien riskien tunnistaminen. N¨ait¨a riskej¨a ei kuitenkaan usein oteta tarpeeksi vakavasti, sill¨a monesti ne my¨os realisoituvat tietoturvapoikkeamina. Kattava etuk¨ateisvalmistautuminen on t¨arke¨a¨a, mutta poikkeamien vaikutusten minimoimisen kannalta oleellista on my¨os valmius tehokkaaseen poikkeamatilan-teiden hallintaan.
Osana tietoturvapoikkeamien hallintaa toteutetaan siihen liittyvien j¨arjestelmien tekninen analyysi. Todistusaineiston, kuten erilaisten lokitiedostojen, keruun tu-loksena tutkijat muodostavat aikajanan j¨arjestelm¨ass¨a suoritetuista toiminnoista. Koska modernien j¨arjestelmien sis¨alt¨am¨a tiedon m¨a¨ar¨a on poikkeuksetta suuri, on aikajanan analysointi mielenkiintoisten j¨alkien l¨oyt¨amiseksi erityisen haasta-vaa. T¨am¨an diplomity¨on tavoitteena onkin luoda ohjelmisto tukemaan kooltaan erityisen suurten aikajanojen analysointia.
Ty¨on tuloksena luotiin ohjelmisto, joka tarjoaa tehokkaan kyselyrajapinnan, tu-kee tutkimukselle tyypillist¨a iteratiivista tiedon etsint¨a¨a ja monimutkaisempia analyyttisia kyselyit¨a. Lis¨aksi ohjelmisto mahdollistaa monipuolisen aikajanan vi-sualisoimisen, mik¨a helpottaa huomattavasti k¨ayt¨ospoikkeamien l¨oyt¨amist¨a. Ta-voitteena oli my¨os tuottaa alusta, jota voidaan k¨aytt¨a¨a jatkossa uusien automaat-tisten analyysitekniikoiden kehitt¨amisess¨a.
Ohjelmiston toimivuus todennettiin tapaustutkimuksessa, joka osoitti ohjelmis-ton olevan erityisen joustava ja suorituskykyinen verrattuna aikaisempiin toimin-tatapoihin.
Asiasanat: digitaalinen forensiikka, tietoturvapoikkeaminen hallinta, tie-toturva, tietokannat, visualisointi
Kieli: Englanti
Foremost, I would like to express my gratitude to my employer Nixu and namely Antti Nuopponen for making this thesis possible and for providing an interesting subject to study.
I also wish to thank my friends and colleagues who have listened to my ideas and given feedback.
The most sincere thanks to my family, without you none of this would have been possible. Finally, thank you Anna for your love and support.
Espoo, March 4, 2013 Patrik Nis´en
ACID Atomicity, Consistency, Isolation, Durability API Application Programming Interface
CD Compact Disk
CERT Computer Emergency Response Team CPU Central Processing Unit
CSIRT Computer Security Incident Response Team CSS Cascading Style Sheets
CSV Comma Separated Value
DBMS Database Management System FTP File Transfer Protocol
GUI Graphical User Interface HTML Hypertext Markup Language HTTP Hypertext Transfer Protocol
I/O Input/Output
IDS Intrusion Detection System IIS Internet Information Services
IP Internet Protocol
IT Information Technology
ITIL Information Technology Infrastructure Library JSON Javascript Object Notation
OLAP Online Analytical Processing OLTP Online Transaction Processing
OS Operating System
RAM Random Access Memory
REST Representational State Transfer SHA Secure Hashing Algorithm
SIEM Security Information and Event Management SQL Structured Query Language
UI User Interface
URL Uniform Resource Locator
Abbreviations and Acronyms 5
1 Introduction 9
2 Responding to computer security incidents 11
2.1 Incident management in general . . . 11
2.1.1 Objectives . . . 12
2.1.2 Prioritization . . . 12
2.1.3 Escalation . . . 13
2.2 Security incidents . . . 13
2.2.1 Lessons from past incidents . . . 14
2.2.2 Risks . . . 15
2.3 Security incident management . . . 15
2.4 Management process . . . 17
2.5 Digital forensics . . . 19
2.5.1 Forensics and digital investigation . . . 19
2.5.2 Forensics process . . . 20
2.5.2.1 Collection . . . 20
2.5.2.2 Examination & Analysis . . . 23
2.5.2.3 Reporting . . . 25
3 Analyzing compromised systems in practice 26 3.1 Beginning for a forensic investigation . . . 26
3.2 Methods for investigations . . . 27
3.3 Efficient analysis . . . 28
4 Analysis methods 29 4.1 Storing and querying event data . . . 29
4.1.1 Databases . . . 30
4.1.1.1 Row and column orientation . . . 31
4.1.1.2 Full-text search engines . . . 31
4.1.2.2 B-trees . . . 32 4.1.2.3 Hash maps . . . 33 4.1.2.4 Bitmaps . . . 34 4.1.3 Progressive queries . . . 35 4.2 Information visualization . . . 36 4.2.1 Visualization . . . 36 4.2.2 Visualization process . . . 39 4.2.3 Timelines . . . 40
4.2.4 Network flow data . . . 41
4.2.5 Attack visualization . . . 43
4.3 Anomaly detection . . . 45
4.3.1 Denning’s model . . . 46
4.3.2 Quantitative and statistical methods . . . 47
4.3.3 Data mining and machine learning . . . 48
4.3.4 Application specific techniques . . . 48
4.4 Existing solutions . . . 49
4.5 Suitability of existing solutions . . . 51
5 Design and implementation 52 5.1 Flexible query interface . . . 52
5.1.1 Database . . . 53
5.1.2 Query pipeline . . . 54
5.1.2.1 Data reduction . . . 54
5.1.2.2 Progressive queries and caching . . . 55
5.1.2.3 Paging . . . 56 5.1.2.4 Core commands . . . 57 5.2 Timeline visualization . . . 58 5.3 Application . . . 59 5.3.1 Server . . . 59 5.3.2 Client . . . 59
5.3.3 Parser and importer . . . 60
6 Case study 62 6.1 Background . . . 62 6.2 Investigation . . . 63 6.3 Comparison . . . 68 6.4 Summary . . . 69 7 Conclusions 70 8
Introduction
Business processes today are increasingly dependent on information. The ef-ficient management of information reduces the risk of interruptions in these processes and also the related costs. Information is therefore also an im-portant asset, which organizations need to protect just as any other busi-ness critical asset, and which needs to be managed as a part of everyday risk management. However, most organizations are still not adequately pro-tected, which is made especially noticeable from the increased reporting of information security incidents in the media. Even if they were adequately protected, security incidents would still occur. There has to be an efficient way to manage these incidents to minimize the damage and restore opera-tions to the normal level of service. This is the objective of security incident management.
The technical analysis of the incidents, known as digital forensic investi-gations, is an important part of the security incident management process. It is performed to understand the full impact of an incident and even to collect evidence admissible in court. In that respect, it can seen as a digital equivalent to more typical crime scene investigations. What makes digital forensic investigations challenging, though, is the vast amount data available on modern computer systems. Collecting this data is relatively easy due to the many tools created for this very purpose. However, processing and analysing the data to find events or artifacts of interest can be a daunting task without efficient supporting tools.
As a result of collecting evidence, the analysts typically end up with a single, very large timeline of events. These events are collected from all the possible logs saved on a system, and describe in detail what has happened and what kind of actions have been performed on that system. The goal of this thesis is to implement an efficient software program, which assists the analysts during digital forensic investigations to analyse these timelines or
other individual log files. The software should help to find good starting points to guide the analysis and support iterative exploration of the data. In addition, we want to develop a platform for the experimentation of more automated analysis techniques.
Responding to computer
secu-rity incidents
The following sections will introduce the reader to management of computer security incidents and digital forensics. First, section 2.1 explains how in-cidents are managed within organizations in general and how they relate to operations of an organization. Next, section 2.2 expands the concept of an incident to security incidents and describes what kind of challenges they pose for today’s organizations. Chapter 2.3 will then define different concepts around managing security incidents, and chapter 2.4 introduces an incident management process from a security point-of-view. After the general intro-duction, the term incident is used interchangeably with the term security incident.
As a result of understanding the process, we will notice the importance of efficient technical analysis of these incidents and take a closer look into the triage phase of the process in the form of digital forensics in section 2.5.
2.1
Incident management in general
As a part of everyday operations of an organization, it will regularly face events that cause interruptions or reductions in the quality of their services. These unexpected interruptions are also called incidents, and are normally first handled by the Service Desk function of an organization. Because of the general problem-solving nature incident management process spans through all of the functions of an organization. [49]
In the context of information technology (IT), Information Technology Infrastructure Library (ITIL), which provides practices for IT service man-agement, defines incident in the following way: [49]
An unplanned interruption to an IT service or a reduction in the quality of an IT service. Failure of a configuration item that has not yet impacted service is also an incident. For example, failure of one disk from a mirror set.
The following sections first introduce the objectives of incident manage-ment in chapter 2.1.1, then explain the basic concepts of prioritization (sec-tion 2.1.2) and escala(sec-tion (sec(sec-tion 2.1.3).
2.1.1
Objectives
The objective of incident management is to restore the operations of an or-ganization to the normal level of service with the smallest possible impact, which is either defined for the organization itself or committed to the cus-tomers. Efficient and controlled intervening to deviations on service level is crucial to not only constrain the direct costs related to resolving and incident, but also for maintaining the productivity of the whole organization. [49]
Naturally, when talking about possible risks that an organization might be facing, the foremost action is to first identify them. Only after knowing the risks, one is able to work pro-actively to prevent them from realizing into incidents. However, almost never it is possible to remove all of the risk, because some of the parameters are always out of the hands of an organization. That is why there must be a way to respond efficiently when all the preventive measures have failed. Furthermore, only being prepared helps to constrain the costs of a possible incident. [49]
Incident response in general terms is an organized and managed approach to addressing these unexpected events of emergency (incidents). Incident re-sponse team (IRT) is then a group of people which is trained and prepared to respond to these incidents. Team consists of pre-selected members with different capabilities to fill roles needed to handle the situation in question. For instance, there needs to exist an incident commander who takes respon-sibility of managing the situation, team and other resources.
2.1.2
Prioritization
Prioritization is an important part of the incident management process. As there will always be multiple incidents submitted to be resolved at the same time, being able to recognize the overall importance and priority of an inci-dent helps to resolve the most threatening inciinci-dents much more efficiently. It is important to realize that the priority is actually a sum of two different factors: impact and urgency.
Impact of the incident is the overall disruption for the level of service in terms of the number of business process affected. Furthermore, an incident is considered to have major impact also when timespan of the disruption is remarkable, even when the number of affected users is low.
Urgency of the impact, on the other hand, is the acceptable delay for the affected functions in solving the incident.
This means that event though a certain incident might at first sight seem to threaten the whole organization, its urgency might be very low and allow more urgent incidents to be dealt with first. Incident management may approach the overall risk by reducing either impact or urgency of the incident. It has to be understood that impact or urgency may also change during the lifetime of an incident. [49]
2.1.3
Escalation
Another important part of managing incidents is the concept of escalation. To resolve an incident, it is not necessary to engage more resources than ab-solutely required, because constant interruptions of, for instance, certain ex-perts will decrease their productivity substantially. That is why a structured approach will yield more efficient results, but on the other hand requires clear policies to be defined. When the incident cannot be resolved by the first line within a certain time span, it will be escalated, that is, more expertise will be involved to resolve the incident. Functional escalation will involve per-sonnel with more specialist skills or authority. Hierarchical escalation means involving personnel with a higher level of authority in the organization. [49]
2.2
Security incidents
In the previous section we introduced the notion of incidents and important basic concepts related to management of incidents. This section will con-centrate on opening the notion of security incidents and the challenges they pose for today’s organizations.
Most of the business process today are fully dependent on supply of infor-mation, and the true value of information increases at the same time. Failing to protect one of the three basic factors of security (confidentiality, integrity and availability) leads to security incidents, where one of the factors is either threatened or already compromised.
However, information security should not be seen as a goal of its own, but rather linked to the operational efficiency where correct and complete
information is available where needed, and to the quality of service provided to the customers. [49]
The following chapters will discuss the history and lessons from past security incidents based on reported data (section 2.2.1), and the potential risks and reasons for preparing to security incidents (section 2.2.2)
2.2.1
Lessons from past incidents
In 1986 occurred the first well-documented international security incident on ARPANET, the predecessor of Internet. Only two years later, the first auto-mated security incident called ”the Morris worm” spread on the ARPANET and caused a first known denial-of-service on about 10 % of the computers connected to the ARPANET. This major event of the time triggered founding of the first computer emergency response team known as CERT Coordina-tion Center, to help responding to computer security incidents. After that, we have witnessed an explosive growth in security incidents. [11] Already in 1995 the number of reported incidents to CERT was at a level of 2500. After that, the problem has exploded, and most of the small incidents go either unnoticed or are left unreported. [18]
What is notable here, is that the majority of the breaches reported to Verizon’s Data Breach Investigations Report 2012 [62] are opportunistic and low difficulty [62], which has been the case since the very beginning [11]. In 85 % of these cases it took more than two weeks before the breach was noticed and in over half of the cases months. Furthermore, 97 % of the breaches were not detected by the organizations themselves, but rather by third-parties, mainly by the law enforcement. After the breach is detected, 42 % of the problems are fixed within days. This strongly implies that in most of the organizations incident prevention and detection are not adequately taken care of.
The report also notes that even though being a very typical driver behind preparing to incidents, the vast majority of the victims did not suffer any extensive financial losses in addition to the incident handling costs, or long term brand damage because of the breach. However, a few reported losses of hundreds of millions and some companies went out of business because of a breach. One has to remember though, that a lot of the costs may impact other organizations indirectly and more severely, as it is the case in payment card breaches where the card issuer might have to absorb the costs of the compromised credit cards. [62]
2.2.2
Risks
Unfortunately many organizations realize the importance of proper security management only after their first severe incident. Even if the possible risks have been considered, they are often times widely neglected. Proper inci-dent management should be an integral part of organizations’ normal risk management strategy. [48]
Some of the important risks are introduced below. [15]
Direct costs A clearly understandable risk, however not that obvious to fully recognize, is the direct costs of the incident. Handling and fully resolving an incident and all of its after-effects might result in major financial expenses. Even though, as noted in chapter 2.2.1, in most of the cases the expenses stay relatively low, they are still always present and hard to estimate.
Business impacts Perhaps even bigger threats are all the unclear indirect effects on the business itself. A breach may have an effect on daily operations of the business making it hard or impossible to operate. In addition, it can cause permanent damage on the reputation and brand of the organization or a product, and result in loss of confidence in the eyes of stock owners and clients.
Legal reasons Legal concerns may also require an organization to recog-nize security risks and prepare oneself to respond to incidents. For instance, entities handling credit cards, healthcare-related information or being part of a critical infrastructure might be required to obey certain regulations and even individuals may be held accountable for severe incidents. Furthermore, privacy concerns in general have be-come a major driving force behind preparing organizations to face this risk. European Union, for instance, has taken actions to strengthen privacy in its member countries by enforcing it in a specific regulation (on proposal stage). [19]
2.3
Security incident management
Typically, the term incident response has been used to describe the activi-ties of a Computer Security Incident Response Team (CSIRT), which is an organization or a team taking care of performing the response within an or-ganization. However, in [4] the definition is restructured into the following phrase:
a capability or team that provides services and support to a de-fined constituency for preventing, handling and responding to computer security incidents
The authors wanted to emphasize that the response ”team” can exist in many forms, depending on the organization and operational purpose in question, and it should be seen more as a capability therein. Nevertheless, CSIRT is the entity formed to take care of the handling of security incidents within an organization.
However, this definition also resulted in reconsideration of the term inci-dent response, as it was seen as too narrow to include all the possible services a CSIRT might provide. The authors of [4] consider incident response to be part of a more generalincident handlingservice, among other preceding func-tions such as detecting and reporting, triage and analysis. That is, incident response is the last process of incident handling.
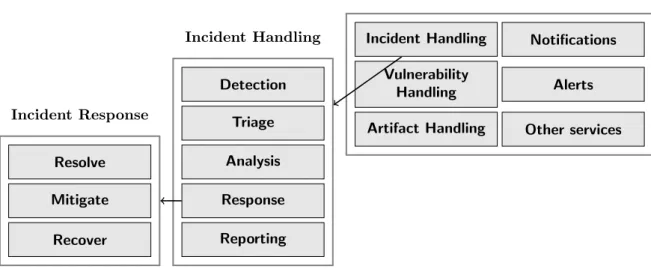
Even further, CSIRT may provide many other services outside of the scope of only reacting to incidents and handling them. Term covering everything around managing incidents is incident management and it includes also all the pro-active services such as vulnerability handling and awareness training. Division of these concepts is illustrated in figure 2.1.
Incident Handling Notifications Vulnerability
Handling Alerts
Artifact Handling Other services Detection Triage Analysis Response Reporting Resolve Mitigate Recover Incident Handling Incident Management Incident Response
Figure 2.1: Incident management concepts
Building a well functioning capability is not a trivial task, since typically knowledge is needed from many different divisions, such as management, IT, Security, HR, legal and public relations. Thus, the capability must consist of knowledge from many different disciplines. Having such as a dedicated
multi-disciplinary capability might be hard to accomplish and that is the reason why it can take so many forms within an organization and only a strictly dedicated team might not be a reasonable form for it. [58]
It is even possible that the capability exists in a distributed form without the organization realizing it. This means that some processes and plans are in place, but not in a coordinated way. Depending on the level of imple-mentation, the capability can be a comprehensive collection of policies and procedures, or more loose group responsible of handling incidents.
Furthermore, management is often under pressure to implement the secu-rity strategy of the organization as cost-efficiently as possible. This typically leads to centralization of the IT related tasks to avoid duplication and out-sourcing of the tasks that cannot be executed efficiently in-house. Outsourc-ing, however, results in a situation where the managers are not anymore in direct control of the execution, but still responsible for the completion of the security strategy. [4]
2.4
Management process
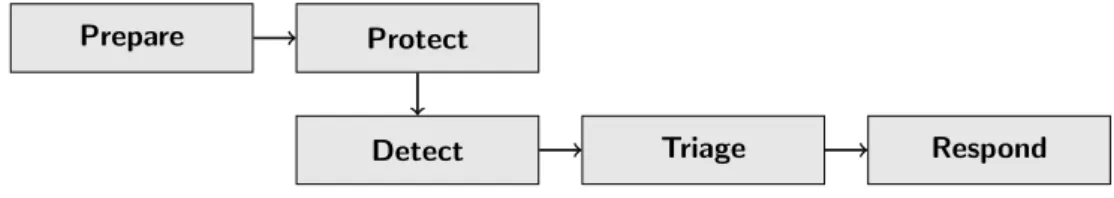
During the years, many different authors have published their own view about efficient incident handling processes, thoroughly summarized in [4]. All of the authors agree on a high level, but differences can be seen in granularity. The process introduced in [4] and illustrated in Figure (2.2) is based on this summary and experience of its authors, and designed to support existing organizational mission, policies and procedures. Here, detailed descriptions of underlying subprocesses are omitted and instead introduced on a general level.
Prepare Protect
Detect Triage Respond
Figure 2.2: Incident management process
1. Prepare: In this phase, incident management or CSIRT capability is implemented in an organization and kept up-to-date. Plans are made and iteratively improved based on feedback from previous incidents. Information about found improvements is passed to theprotect process. The base for effective response to incidents is built here and should
include planned processes on areas such as notification, communication, coordination, analysis of incidents and responding to incidents.
2. Protect: This phase implements changes in infrastructure to stop an on-going incident or to prevent incidents in future. Also, the infrastruc-ture is pro-actively inspected and risks are evaluated. Any previously unknown security related information is transferred to the next detect process. Protection process ensures that the organization is adequately protected in advance and is aware of possible risks involved within its infrastructure.
3. Detect: Detection process actively monitors and analyzes events, for-wards any suspicious events to thetriage process and possibly reassigns events to other areas outside incident management processes. It is en-sured that the organization is capable of detecting possible intrusions efficiently and communicating this information to responsible parties for further analysis.
4. Triage: Here, the overall impact of an event is investigated. Events arriving to this process are categorized, prioritized, correlated and for-warded to the responsible process depending on the context. This can meanresponding, reassigning or closing unimportant events. Typically, this process is part of responding itself, but the authors argue that be-cause it can be done in many different ways and by many different parties, even outsiders, it should be separated.
5. Respond: In this process, actions are taken to respond to an event. It is first analyzed to understand the full context, and then a response strategy is designed and executed. Actions concerning all the partici-pating entities are coordinated and any actions required to resolve and recover from the incident are taken. Information to learn from is passed back to prepare process.
Especially important is to understand the links and communication be-tween the processes. For instance, an important question when performing the analysis and responding is how and when should the system be contained to constrain the incident surface and preserve evidence. This is again only a matter of clearly defined and understood policies and procedures.
Detect and Triage phases of this process are the most technically chal-lenging ones. As noted previously in the chapter 2.2.1, most of the security incidents typically remain unnoticed for a long period of time or even com-pletely from the organization. And even though the issue is fixed relatively
shortly after, gaining a thorough understanding of what has really happened in the triage phase may be extremely challenging.
2.5
Digital forensics
In the previous section we introduced the reader to incidents, security in-cidents and their management. We identified that detection and triage or analysis phases of the management process are the most technically challeng-ing and important for a successful handlchalleng-ing of incidents.
This section will take describe how the actual analysis of incidents is performed on a general level, in the context of digital forensic investigation. It will first introduce forensics as a concept in section 2.5.1 and then look in more detail into a forensics process and an its many phases in section 2.5.2.
2.5.1
Forensics and digital investigation
Forensic science (or forensics) is typically defined as the application of a broad spectrum of sciences to answer questions of interest to a legal system. That is, the goal of forensics is to identify, collect, examine and analyse evidence that makes it possible to prove a certain chain of events. In addition, all this must happen while preserving the integrity of the evidence and information, and while maintaining a strict chain of custody for the evidence. Chain of custody means a chronological documentation of handling of the evidence.
This general definition applies as well to digital forensics, where the evi-dence is however, ”information stored in binary form that may be introduced and relied on in court” [45]. Term data here refers to distinct pieces of in-formation in a certain format.
Digital investigation is the process where hypothesis, which answer ques-tions about digital events, are developed and then tested. Due to the complex nature of digital evidence and the technology underneath, analysts must re-alize the importance of fully understanding the results of the analysis, which means not only trusting the tools used, to be able to draw holding conclu-sions. [10]
Even though the definition of digital investigation lacks the aspect of proving the results in court, we will use the term interchangeably with digital forensics because the main difference is in management of the evidence.
In addition to using digital forensics in response to incidents, the same techniques can be used in plenty of other cases too, such as general trou-bleshooting, data recovery or regulatory compliance. In this case, however,
we limit our interest to firmly and efficiently proving a certain chain of events or finding other digital artifacts of interest.
2.5.2
Forensics process
A general forensics process is illustrated in figure 2.3. The phases of the pro-cess are collection, examination, analysis and reporting. A short description of each is given in here, and more in depth in the following sections.
Collection Examination Analysis Reporting
Figure 2.3: Forensics process
1. Collection: This phase includes identifying, labeling, recording and acquiring relevant information from different sources, while preserving the integrity of the data.
2. Examination: In this phase, collected data is processed using au-tomated and manual methods and particularly interesting data is ex-tracted for further analysis.
3. Analysis: Next, information is derived and conclusions are drawn from the results of the examination. This phase finds answers to the research questions, which were the reason to start the investigation in the first place.
4. Reporting: Finally, the results of the analysis are presented. The report should describe how the data was processed, what tools and procedures were used and what are the following actions to take. In addition, recommendations for improving the forensics process may be given.
2.5.2.1 Collection
The first phase of the forensics process identifies relevant sources and collects data from them. Even identifying all the possible sources may be a daunting task considering the wide adoption of a variety of technologies in organi-zations. In addition to the obvious sources such as workstations, laptops, mobile phones and servers, one has to also consider the variety of transfer-able medias and other devices. External hard drives, USB memory sticks, memory cards and CDs may store vast amounts of data outside the control of
an organization. One problematic source, which has seen a quick adoption in many organizations, is all the different software and services hosted by other external service providers, from where the acquisition of data might be hard or even impossible. That is why one has to be able think alternate sources that might provide the same information and circumvent possible legal and ownership considerations.
Today, what even small organizations have in their hands is an explosively growing amount of data that they do not know even existing. Having enor-mous amounts of data, however, results in equally big challenges when trying to analyse and extract information and evidence out of that data. Indeed, these facts are forcing analysts to begin using live-analysis data collection techniques, pinpointing important pieces of data remotely and retrieving only those absolutely necessary for further analysis. Full copies of all the data available might not be feasible or even possible anymore. [54]
If the organization has realized the need for preparing to the worst and taken proactive measures to respond to incidents they should have identi-fied important systems and enhanced logging and audit capabilities in these systems. This data is typically extremely valuable for the forensics process.
Valuable sources for forensics data are:
Filesystem In addition to the files themselves, filesystems provide plenty of other information about the data it stores (metadata), which occa-sionally proves to be even more valuable than only the content of the files. Depending on the filesystem in question, this metadata includes information such as timestamps for file creation, access and modifica-tion. In addition, information about deleted files is usually preserved for a relatively long period of time. All this time information helps to build an detailed picture of actions performed on the filesystem, and on the system itself.
Network Because practically every computer is connected to a some kind of network, data exchanged between different systems might reveal useful information about network-based attacks. Even though all the data within organizations usually cannot be saved due to the vast amount data produced every day, routers, firewalls, Intrusion Detection Sys-tems (IDS) and other sysSys-tems produce lots of event data about what is happening inside an organization. In case more detailed data is needed for instance after a breach is suspected, a packet collection system or more specialized network forensics system can be set up, in case such a system is not already in place.
is used for troubleshooting in error situations. These logs are often very useful for forensics as they reveal more in detail how a user was using the system. Not all applications are interesting nor produce a detailed log, but especially server applications such as web servers, keep a log that can be used to investigate how the application running behind it was used on a higher level.
Operating system In addition to the OS level logging, operating systems provide information about what is happening on a particular system at the very moment. Most of this data is volatile and can be lost due to any actions taken. Important volatile data are for example network connections, login session, contents of memory, running processes and open files. Furthermore, any changes in configuration might be a sign of a potential issue.
Acquiring the data should follow a three-step process: developing a plan, acquiring data and verifying integrity of the data. This process is illustrated in figure 2.4
Develop a plan Acquire data Verify integrity Figure 2.4: Collection process
Making a plan beforehand helps to better understand the environment and prioritize the sources. As mentioned previously, one of the issues in data collection is handling the enormous amounts of data available. This is why identifying the right sources is important, instead of collecting everything available. The collection plan should take into account all the information and pointers available to detect the right sources. These pointers may in-clude, for instance, any suspicious events or alerts from virus or intrusion detection systems.
Prioritization should take into consideration the following elements: Value Estimating relative value of the data from each source helps to focus
on most important sources.
Volatility Volatile data means all the data that is lost or modified due to ac-tions performed on a running system or when the system is shut down. Because the data might be lost unexpectedly, it should be preserved earlier than non-volatile data. Also, data saved on non-volatile media might also have a volatile nature if it is modified often. [46] One has to
remember that actions that at first might not seem to be harmful might still modify the state of the system and lose valuable information. For instance, only accessing a file might destroy an important timestamp from the metadata of the file. So at first, one should collect information only by observing the running system and systems interacting with it, with no active actions taken.[60]
Effort Some sources might be a lot harder and costly to get access to, and thus taking a lot of time and effort. It might be more useful to focus on sources within an organization rather than trying to access, for instance, networks of third-parties.
Data acquisition is normally performed using automated forensics tools, which collect volatile data and takes copies of non-volatile data. Acquisition can be performed also over the network, but generally doing it locally is the preferred way because of the additional control and the certainty it brings.
However, one has to keep in mind that every action performed on the system in question will have an effect on its running state. That is why all the interaction has to be kept to minimum and it has to be verified that the actions of the tools used are understood correctly.
After the collection, integrity of the data needs to be verified to ensure that the data was transferred correctly and has not been tampered with. This is typically done by calculating a digest of the original and the copy, using algorithms such the SHA family [47].
2.5.2.2 Examination & Analysis
After the collection, what analysts typically have in their hands is a exten-sive collection of different types of data from many different sources. Next, the relevant pieces of information are extracted and conclusions are drawn. Having vast amounts of data makes finding the relevant pieces difficult and time-consuming, just as finding a needle from a haystack. This is true espe-cially when the amount of initial, prior knowledge is limited or non-existent. Of the millions of events, only a couple might end up being relevant to the case. That is why the help and quality of supporting tools and techniques is particularly important.
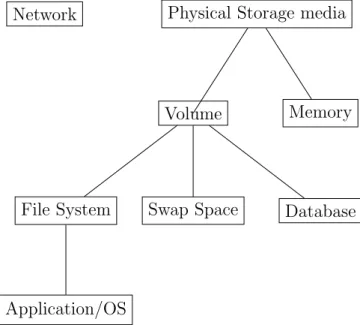
Different types of data require their own specific domain knowledge and analysis techniques. Figure 2.5 introduced in [10] illustrates a layered model of the different types of analysis for digital evidence. This model first sepa-rates the analysis of storage devices from communication devices. The next level makes a difference between volatile, RAM memory, and persistent stor-age, such as hard drives. Volume analysis is a general term for the analysing
of ”collections of storage locations”, under which the real data is stored, most typically under file systems. This layer tells where the actual data is located, and where possibly hidden data could exist. Inside volumes are the actual file systems (or other structured layers). The last important layer is application and OS layer, which links files from file systems to applications. This layer also includes all the log data generated by applications or different monitoring systems. [10]
Network Physical Storage media
Volume
File System
Application/OS
Swap Space Database Memory
Figure 2.5: Analysis types
All these layers may provide a lot of information about the activities oc-curred on a system, but they all require their own tools and techniques to extract the relevant information. Despite the differences, even the tools typ-ically output a vast amount of data that needs to be filtered and interpreted by the analyst. And this can be daunting task to perform especially without any helpful prior knowledge. Nevertheless, many times the output of these tools resemble a log of any normal application.
As explained previously, the result of the analysis is typically to discover a chain of events that prove certain incident or event in detail. All this log data collected or extracted from the sources is chronological by nature and typically contains some sort of time information. This allows to combine that data into a single timeline, giving a deep view on the use of a system or many systems. The resulting timeline is then analyzed to prove or disprove certain defined hypothesis.
In other phases, known steps are followed to first find the sources, prioritize and collect the data. Here, however, it is not known beforehand what kind of information or patterns are found, which makes entirely automated analysis difficult. Instead, tools and different methods are applied creatively to test hypothesis, and that is why the tools should also support this kind of iterative exploration of the data.
2.5.2.3 Reporting
After having gained a thorough understanding, conclusions are reported. This report contains the discovered issues, methods used to find them, and actions that needs to be taken to remedy these issues. Suggested improve-ments can be related to policies and procedures of the organization, or to the infrastructure itself. This important to prevent possible future incidents and to learn from the experience.
It might happen that the research questions were not fully answered, and more information is still needed to remedy that. In this case, the needed sources are reported and collection is continued.
Analyzing compromised systems
in practice
In the previous chapter we learned how organizations manage the risks re-lated to security incidents. In addition, we described how these incidents are investigated on a very general level. This chapter will give a brief in-troduction to digital forensics investigations in practice. First, we describe how the investigations typically begin in section 3.1. Then we describe what methods are used in different cases in chapter 3.2. And finally, we describe the methods needed for efficient forensic investigations in chapter 3.3.
3.1
Beginning for a forensic investigation
As explained previously, in an ideal situation an organization has a man-agement process for security incidents in place and the incidents should be discovered in the detect phase of the process (section 2.4). In practice this typically happens through an automated monitoring system. In case of a malware infection this system can be an anti-virus software and other types of attacks might be detected by firewalls or intrusion detection systems (IDS). These systems generate alerts containing information about the origin of the event and about the reason, which makes a certain event suspicious. The events are then taken further in the process and responded to.
As explained in section 2.2.1, however, this is not how these situations typically proceed. Most of the organizations are not able to detect or handle the incidents themselves. Rather, a third-party, such as law enforcement or an internet service provider, might detect the incident months later, when the worst might have already happened. Only at this point, when the organi-zation realized the importance and impact of the incident, a full investigation
is started to minimize the damage and to understand what has happened and how.
It is also possible that the organization has been a target of a more directed attack, even by an insider. These cases can be very hard to detect because the actions might not be directly malicious by nature at all, and thus not detectable by any monitoring systems.
3.2
Methods for investigations
When an incident has been detected, the goal of the started investigations is to try to find answers, for instance, to the following questions. Has a breach or infection happened at all? How and when? What has a particular user done? Is there any evidence of certain actions executed? Depending on the question, different methods can be used to look for an answer.
From the different analysis types introduced in 2.5.2.2, in practice the most common ones are analysis of volatile memory (RAM), analysis of an individual application or operating system, and analysis of a full hard drive. Volatile memory is analyzed typically in cases where a malware infection or a direct attack is suspected, and a full image of the running system is needed. Analysing artifacts from the volatile memory can reveal many in-teresting things that simply are not available on the disk or application logs. This is due to advanced hiding techniques of modern malware and hackers, there might be data available only on volatile memory and hidden from nor-mal ways of accessing it through the operating system. For instance, we might find hidden processes, files, or network connections. The Volatility Framework [59] is an open source toolkit used for this purpose.
Similar individual artifacts can also be found from the hard drive. We might be interested to look for certain keywords from the files available on a system, find certain types of files or suspicious executables created by malware. Tools such as EnCase [24] and FTK [3] can be used to index the entire contents of a hard drive and then execute queries against this data.
More importantly, a forensic investigation is typically interested in prov-ing a certain chain of events. For this, we must be able to build some kind of a timeline of all the events occurred in a system. As explained previously, most of the applications and operating system and file systems save a great amount of information on disk in different log files and formats. All this information can be combined to build a full timeline of events occurred on a system. Log2timeline [39] is able to combine logs from at least 35 differ-ent sources, including for instance, WWW-browser usage, Apache and IIS, Windows event log, anti-virus engines, firewall logs and generic linux logs,
among many others. The result is called a super timeline. This timeline is then analyzed in detail to understand what has happened on a system or what kind of actions or chain of actions a particular user has taken.
3.3
Efficient analysis
What is typically needed here, in addition to manual exploration of the raw events or artifacts, is support for more analytical queries and more compact ways of representing the timeline. We might want to know what moments of time differ from the normal use, based on a selected property of the events. For example, if the overall level of activity has changed, if a distinct amount of data was transferred out of the system or if suspicious files or other artifacts were brought into the system. Representing these results visually can benefit the analyst considerably, because of the capabilities of humans to process visual information efficiently, explained in detail in the following chapter. However, no such ready system currently exists for analysing these kinds of timelines in detail.
What typically complicates all these methods, is the vast amount of data available for analysis. Without an efficient tool to support this kind of ex-ploration and more intelligent analytical queries, it is very time taking and difficult to find relevant information from the data. In addition, it is impor-tant to be able to efficiently find starting points for the investigation. This is where visualizations can be of a great help.
It is very possible, however, that no usable results are found at all within the time reserved for analysis. Analysing very large datasets is challenging, but often the biggest issue is the lack of relevant logging enabled in the configuration of the system.
Analysis methods
The previous chapters gave background for the problem we are solving. We now understand incident management and digital forensics on a general level and the challenges present in that context. We also gave an introduction to investigations more in practice. We chose to look into solving the technical challenges of a digital forensic investigation, more specifically the challenge of handling big amounts of data either the systems under investigation have produced or the tools used to extract information produce.
The following sections will give the reader an overview into technical themes we identified to be of importance in designing an investigation sup-porting system. First, we study efficient storing and querying of data in section 4.1. Then, we look into compact representation of data in forms of visualizations, which help the analyst to find anomalies in the data, in sec-tion 4.2. Further, we will introduce automatic anomaly detecsec-tion in secsec-tion 4.3.
Finally, we will first introduce currently existing software solutions for forensic analysis in section 4.4 and then evaluate their suitability for our purposes in section 4.5.
4.1
Storing and querying event data
As explained in section 2.5.2, after the collection of many different types of data, the evidence is examined and analyzed. To be able to efficiently process the vast number of data collected, the underlying system must be designed for highest possible performance and to support specific needs. The raw data itself, for instance a log file with potentially millions of lines, may be hard to process in the original format. However, the lines are typically formatted in an unified way and thus have an internal structure that contains
more meaningful information. This is where database systems come into the picture. They provide means to store this structured data in a way that enables execution of complex queries against the data and information represented by the structure.
The following sections will introduce different types of data management systems and features related to the efficient analysis of event data. Section 4.1.1 will look into database systems in general, section 4.1.2 introduces different indexing techniques for efficient querying, and finally section 4.1.3 will discuss background for a novel technique of progressive queries to support efficient exploration of the data in an iterative investigation process.
4.1.1
Databases
By definition, database is a collection of related data, that have an implicit meaning. Further, the common meaning of database also includes the follow-ing properties: database represents some aspect of the real world, database is a logically coherent collection with an inherent meaning and database is de-signed, built and populated with data for a specific purpose. A database itself represents only the collection of data and is unusable on its own. Database management system (DBMS) defines a collection of programs or routines to enable defining, constructing and manipulating databases. Combining a database and software yields a full database system. The main idea behind database system is to provide a data abstraction and representation through a standard interface based on the defined data model. This means that a database system hides the details of storage access behind the system, thus making accessing it more feasible to access. [52]
A general purpose database is typically meant to allow concurrent use from many users at the same time through a unified interface. This means that the database system must implement some kind of transaction process-ing, which follows so called ACID properties [31]:
• Atomicity: It is required that either all or none of the parts of a transaction are executed.
• Consistency: The system must assure that after a transaction, the database satisfies all of the defined consistency requirements.
• Isolation: Two or more concurrent transactions must be isolated from one another in a way that the result would be the same when ran sequentially.
• Durability: After a successful transaction, the effects most not get lost in case of a system failure.
In our case, we want to store and query very large collections of events, that have an order (time) and a description of what happened (event). In addition, the event is typically carrying other pieces of data, defined by a data model, that describe the event in more detail.
There are many types of database systems meant to be used for different purposes. These systems can be categorized using many criteria, but here we are interested in high performance analytics, so we are going to focus on the difference between online transaction processing (OLTP) and online analytical processing (OLAP), and row versus column oriented databases. 4.1.1.1 Row and column orientation
Traditional databases store records in a row-oriented fashion. This means that pieces of data related to an individual record are stored sequentially allowing efficient processing of these full records. The design is well suited for the general-purpose databases, traditionally processing transactions on records (OLTP). However, for more analytical needs (OLAP) this is not optimal.
Along with the growth in need for efficient analytical data processing we have seen an emergence of new DBMSs focusing on delivering the highest performance on read-intensive analytical workloads. These new technologies like MonetDB [42] and InfiniDB [43] are promising and can provide even an order-of-magnitude gains on certain workloads. These column-oriented databases store the data of each column or field sequentially, which enables I/O efficiency and better CPU and cache performance. This difference in efficiency is true even when using techniques such as vertical partitioning, index-only plans or a specific collection of materialized views on row ori-ented databases. Other optimizations related to column-oriori-ented design are late materialization of the records, block iteration and column compression techniques. [2]
4.1.1.2 Full-text search engines
Full text search engines are a special type of document databases that employ special indexing structures to allow fast searching against different fields in its documents. What makes them relevant here is their optimized string search performance and the ability use them also as a more typical document database.
The most known and widely used such database is Lucene [6], and its derivates Solr [7] and elasticsearch [16]. However, as these systems are mostly search oriented and optimized to return only a few top matching results, they
lack many more analytical features present in traditional database systems. Although features such as Field Collapsing [8] are available in, for instance, Solr, they cannot match the performance of traditional databases and thus they are many times used to add certain search functionalities on top of traditional databases.
4.1.2
Indexing
Indexes are access structures used to speed up retrieval of records. When queries are executed to retrieve records based on values on certain column, that is, the primary organization cannot be used, a full scan over the records is needed. To avoid scanning through all the records, an index may be constructed to map values of a column to individual records, thus enabling efficient queries.[52]
Efficient retrieval of interesting data is crucial when performing an iter-ative investigation. The goal of this section is to understand what kind of techniques are available for efficient querying and retrieval of records from the database. Commonly used indexing techniques are introduced in the following sections.
4.1.2.1 Single level index
The most simple access structure is an ordered file with two fields. The first one, also by which the file is sorted, is the indexing field containing the value of the column in the indexed record. The second field acts as a pointer to the original record. The index file contains one entry for each record, thus allowing a quick traversal by the column values.
Because the index is sorted by the indexing field, search can be performed using binary search, which has a logarithmic execution time. This is already a great improvement over the linear search in the case of no indexing at all. [52]
4.1.2.2 B-trees
Single level index provides already a significant performance improvement. However, to reduce the number of different blocks accessed during a search, we can introduce additional levels to the index. These multilevel indexes reduce the search space even faster. They are typically implemented as a tree structure, where each node guides the search to the next subtree of the search tree. Generally, a node in a search tree contains a field value and the corresponding pointer to the record itself. In addition, node contains
pointers to the next level in the tree, for both smaller or larger values than stored in the node in question. The details then vary a lot, how the tree is structured and maintained. The most common version of a search tree used in databases is a B-tree and its variants B+-tree and B*-tree. [52]
B-tree is a constrained instance of a tree structure, which ensures that the tree stays balanced, meaning all the leaf nodes are at the same level. This holds for both insert and delete operations. The basic B-tree stores the indexed values on nodes of all the levels, along with a pointer to the record itself. B+-tree, which is the most used variant, takes another kind of approach. It stores all the data pointers only at the leaf nodes, creating a leaf node for every unique value of the index. In case of a not unique search field, an extra level of indirection is added from the leaf node, pointing to a block containing all the data pointers (row identifiers). In addition, leaf nodes form a linked list, which allows efficient ordered traversal on the search field. [52]
Figure 4.1: B+-tree [23]
4.1.2.3 Hash maps
Hash map is a data structure that maps keys with their corresponding values using a hash function. Hashing derives a compact representation of the key and is used internally, for instance as a table index, to efficiently find the corresponding value. Due to its great performance, hash map is widely used for cases where functionality of an associative array is needed.
Generally, hash map performs better than tree based structures as its average cost of each operation is independent of the number of elements stored in the structure. However, even though the average cost is very low, the optimal performance is achieved mainly in cases where the use pattern can be predicted. Furthermore, hash map lacks other features of trees as well, such as ordered traversal. [52]
4.1.2.4 Bitmaps
Typical indexing, as explained for instance in section 4.1.2.2, reference each row individually in the structure using a row identifier, which is a pointer to the storage system (disk). This means that for very large databases, as encountered for instance in data warehousing, indexes typically grow very large in size and become hard to maintain. Bitmaps have become an inter-esting solution for very large scale database indexing for read intensive use patterns. [50]
In this case, bitmap is basically a compact representation of the set of row identifiers. For a given set of rows, nth bit in the bitmap is set when the corresponding nth row has a certain property. An example of a bitmap index is illustrated in figure 4.2. This is especially efficient for columns with low cardinality, such as boolean columns, as the required number of bitmaps is low. In case of a column with unique values, one bitmap is needed for each value, thus the number of bitmaps would equal the number of rows and can become inefficient. However, proper use of compression and encoding techniques have been shown to overcome this inefficiency and yield better performance for columns of any cardinality. Indeed, using bitmaps or not is mainly a question of application. [50, 63] FastBit project [20] uses Word-Aligned Hybrid (WAH) code, analyzed in [64], for compression and a multi-level encoding [65]. The authors argue that these are the most efficient methods known in literature.
Figure 4.2: A sample bitmap index [64]
In addition to the space efficiency, handling bitmaps benefit of CPUs performant bit operations, and for instance boolean operations on bitmaps become extremely efficient. Furthermore, as needed in analytical use cases, bitmaps are well suited for grouping and calculating aggregates in ad hoc
queries. For OLTP applications normal B-tree indexes are a better fit be-cause the data changes more, but the executed queries are typically known beforehand [50, 63].
4.1.3
Progressive queries
Data exploration is typically an iterative process. The queries are not nec-essarily known beforehand, and thus supporting data structures to answer the queries cannot be constructed in advance. Iterative querying also implies that the results of the next slightly modified query is many times a subset of the previous query. If the result set is populated entirely, it could be possible to use this set as a starting point for the following queries and reduce the number of records to be inspected radically.
Four general level techniques to support these kinds of queries are pre-sented in [67].
1. Repeated evaluation via query merging: In this strategy, the previous results are not used in the following step queries. Rather, a new query is evaluated fully with only the differing conditions, and later the results are merged with all the previous step queries.
2. Incremental evaluation via sequential scan: This technique uses the results of a previous step query as an input for the following step query. For each subsequent step, a sequential scan has to be performed because the intermediate results are temporary and thus the indexes created for the original data cannot be employed.
3. Incremental evaluation via dynamically created indexes: Dy-namic creation of indexes resolves the problem of the previous tech-nique. This would make the query evaluation itself faster but decrease the overall performance, because of the dynamic index creation. 4. Incremental evaluation via dynamically maintained indexes:
This technique transforms the indexes dynamically to suit the needs of the subsequent queries.
The last technique was considered to be the most promising one in the same paper [67]. The authors introduced an additional layer between the actual records and indexes, which they named as ”router”. This router adds a layer of indirection that can be dynamically updated to support progressive queries.
Typically this kind of functionality is constructed over the view function-ality of the database systems. Another paper [66] investigates the use of dynamic materialized views to speed up the execution of progressive queries. The authors build a superior-relationship graph based on historical queries and deploy an algorithm to decide if the sub result set should be materialized as a view or not. Using views to speed up queries is well studied subject and summarized in the same paper.
Another approach [28] studies automatic recycling of intermediate results of a query plan to speed up any following queries with overlapping interme-diates.
4.2
Information visualization
This section will introduce the reader to information visualization. The goal is it understand, what kind of techniques and information are needed to create supporting visualizations, that would help the analysts to process vast amounts of information more efficiently.
We will first briefly explain theory behind visualizing data in sections 4.2.1 and 4.2.2. Then, we will take a closer look into useful visualization techniques in the context of security visualizations in the following sections. Section 4.2.3 introduces visualizations of timelines, section 4.2.4 explains visualizations related to network flow data, and finally section 4.2.5 shows techniques to detect attacks using visualizations.
4.2.1
Visualization
Information visualization produces visual representations of abstract data, with a goal of reinforcing human cognition to enable the viewer to understand the structure and relationships in the data.
visual representations and interaction techniques take advantage of the human eye’s broad bandwidth pathway into the mind to allow users to see, explore, and understand large amounts of in-formation at once. Inin-formation visualization focused on the cre-ation of approaches for conveying abstract informcre-ation in intu-itive ways. [29]
This means that because visualizations make use of the human mind itself, analysts do not need to learn any specific skills to interpret the data. They are able to quickly draw conclusions or generate hypothesis to later verify
with more formal analysis. Visualization is thus an important part of data analysis techniques, among with other tools such as statistics. This ability of humans was successfully exploited, for instance, to solve an previously unknown structure of a protein, which had troubled scientists for more than a decade. This breakthrough was achieved by playing a game called Foldit. [13, 22, 33]
In addition to more basic tools of representing data, such as charts (pie chart, bar chart, histogram, etc.), plots and graphs, the information visu-alization community has come up with plenty of other intelligent ways of visualizing different types of data. Examples of these include treemap, which can be used for hierarchical data, and heatmap, which illustrates intensity of a value in an matrix.
Information security is facing the same problems as for instance business corporations. Plenty of data is available or generated in data collection, but the problem is to make a good use of it. After a security incident, the analysts might be facing an amount of data that cannot be handled only through manual inspection, and looking only the raw data might be very hard to interpret any clear patterns in the data. Visualization is a useful way of getting a quick insight of the data to guide the investigation further. Security visualization is still relatively young area of research and the techniques used are mainly based on the results of more traditional informa-tion visualizainforma-tion research. The following chapters will present techniques to support the analysis and to detect attacks, anomalies and structures. The in-formation presented here is mainly based on the work done by Raffael Marty [51] and the SecViz-community.
Benefits of visualization include: [51]
Answer and pose questions It is possible to create a visualization for each of the question that needs to be answered during an investiga-tion. Very often these visualizations then make the viewer to pose new questions, which makes the process iterative by nature.
Explore and discover Visualizations make it possible to explore very large datasets through a compact representation. Different representations are needed to highlight different properties and relationships of the underlying data.
Communicate information Due to the fact that visualizations encode a lot of information into a easy to understand format, they are a way to communicate information efficiently.
Increase efficiency Visualizations can speed up the investigation process dramatically compared to for instance raw log analysis, because the
pattern and relationship recognition capabilities of humans are in full use.
However, these described benefits are only valid when the visualization in question is created properly and by recognizing how human eye processes information. Visualizations done wrong can even misguide the analyst and result in completely incorrect conclusions. Human visual system has a certain set of rules that define how visual perception works.
Some elements in an image are detected immediately when the image is first viewed. These so called pre-attentive visual properties require no concious attention to interpret. These basic visual properties can be grouped into four groups: form, color, position and motion. Each of the groups have additional sub-elements to consider, and they are illustrated in figure 4.3 Important information should be presented using these properties to make the viewer spot important parts immediately.
Figure 4.3: Pre-attentive visual properties [51]
Keeping these basic features of human vision in mind, we are able to present a set of basic principles of graph design [51]. Following these princi-ples results in better quality and understandable graphs.
Reduce nondata ink The less ink is used to draw the graph the better. All the ink spent should be used to present the data, everything else should be removed.
Distinct attributes Previously presented visual properties are used to high-light important parts of the graph. However, humans cannot remember too many features of a graph, so one should not try to encode too many properties into a single graph.
Gestalt principles Gestalt principles are a set of visual characteristics that help viewer to find a graph and detect important parts of it. Gestalt principles are proximity, closure, similarity, continuity, enclosure and connection.
Emphasize exceptions One should make exceptions stand out even more, because usually those are the things the graph tries to communicate in the first place.
Show comparisons Instead of presenting only the raw data, showing some-thing to compare with allows the viewer to understand the differences better and find the interesting anomalies.
Annotate data Graph should also state what the data is about by using legends and axis labels. Sometimes even a text explaining certain values can be used.
Show causality When a graph shows an exception, the next questions typ-ically are looking for a reason for it. Graph should try to give an expla-nation for the root cause behind the exception. Here, one graph might not be enough and a second one is needed to clarify the interpretation.
4.2.2
Visualization process
Previous section discussed the basic elements that make a good visualization. The path from a collection of data to highly informative visualization is, however, not just a easy single step, but requires a careful processing of the data through a complete visualization process.
Marty introduces a six-step information visualization process in [51]. 1. Describe the problem: First, define the questions that need to be
answered by the resulting visualization.
2. Assess available data: Find out what data is available and what additional information is needed.
3. Process information: In this phase, information is extracted from the source, filtered and processed into a format that can be visualized. 4. Visual transformation: Next, the extracted data is transformed into
5. View transformation: If the previous phase did not result in already easily interpretable result, it can be modified by zooming, aggregating the data or for instance modifying the selected properties to better represent the interesting parts. This phase is also iterative in nature, since the result is viewed in between and then further modified to better represent the wanted features.
6. Interpret and decide: Finally, the conclusions are drawn based on the result from previous phases. Often, however, the result may be hard to interpret on its own and needs other graphs or verifying to support the decision. At this point it is also useful to remind oneself if the result really answered to the original questions posed, or did it reveal some other features of the data that should be investigated with new question and perhaps with a better suiting graph.
4.2.3
Timelines
When performing a forensic analysis, the time factor is strongly present. Analysis tries to discover when and in which order certain events happened, thus a timeline is generated from the data obtained from different sources. Log entries typically carry a timestamp revealing when that entry was writ-ten, and often the tools used to extract data from the inspected system also are able to attach a time for the data.
Analyzing this kind of timeline, that is, a sorted set of log events, by only looking at the entries does not easily give a good image about the level of activity of the system at a given point of time. A visualization of the level of activity over a selected field and aggregation function can help to better understand the time relations between entries. Furthermore, many times anomalous activities can be seen to differ from the normal activity profile of the system, either as a increase or decrease, by looking at different metrics. These points of time are good pointers to focus the investigation to. Figure 4.4 shows an example of activity visualization, clearly indicating an increased level of activity.
![Figure 4.1: B+-tree [23]](https://thumb-ap.123doks.com/thumbv2/123dok/2223075.2718941/33.892.272.617.543.709/figure-b-tree.webp)
![Figure 4.2: A sample bitmap index [64]](https://thumb-ap.123doks.com/thumbv2/123dok/2223075.2718941/34.892.298.587.694.931/figure-a-sample-bitmap-index.webp)
![Figure 4.3: Pre-attentive visual properties [51]](https://thumb-ap.123doks.com/thumbv2/123dok/2223075.2718941/38.892.236.657.533.775/figure-pre-attentive-visual-properties.webp)
![Figure 4.4: Visualization showing an increased level of activity [51].](https://thumb-ap.123doks.com/thumbv2/123dok/2223075.2718941/41.892.215.680.197.391/figure-visualization-showing-increased-level-activity.webp)
![Figure 4.5: Overview visualizations [51]](https://thumb-ap.123doks.com/thumbv2/123dok/2223075.2718941/42.892.217.670.467.919/figure-overview-visualizations.webp)
![Figure 4.6: Treemap showing an overview of services used in a network [51]](https://thumb-ap.123doks.com/thumbv2/123dok/2223075.2718941/43.892.272.619.258.602/figure-treemap-showing-overview-services-used-network.webp)
![Figure 4.7: The upper image shows network traffic to a single host visual- visual-ized with parallel coordinates [51]](https://thumb-ap.123doks.com/thumbv2/123dok/2223075.2718941/44.892.281.605.193.668/figure-network-traffic-single-visual-visual-parallel-coordinates.webp)
